

After the Easter weekend, oil prices are declining for the second consecutive day. Investors are trying to assess the strong oil demand in China, on the one hand, and the increase in oil production in the US, on the other hand. In China, there is a higher growth of the national economy in the 1st quarter. It is likely that the impetus for growth in the PRC will remain at least in the first half of this year. Against this background, oil imports to the PRC in March reached a record high.
After the US Energy Ministry reported that the production of shale oil in the seven oil-rich regions of the country could grow by another 2.5% per day in May, compared with the forecast, oil prices fell by about 1% on Monday. If this happens, the monthly increase will be the strongest in two years.
Many analysts of the oil market believe that in the next two years the production of shale oil in the US may exceed forecasts. The International Energy Agency (IEA) predicts that oil production in the US by the end of this year will grow by 680,000 barrels per day compared to the end of 2016. Oil production outside OPEC this year could thus increase by 485,000 barrels per day.
The next meeting of the cartel, which may decide to extend the deal to reduce oil production, will be held on May 25. If hopes do not materialize, oil quotes may fall sharply.
Today at 20:30 (GMT), the American Petroleum Institute (API) will publish its report on changes in oil reserves in the US over the past week. And on Wednesday at 14:30 the Ministry of Energy of the United States publishes a weekly report on oil and petroleum products in the US storage. Reduction of reserves favorably affects oil prices, and vice versa. The growth of stocks puts pressure on oil prices.
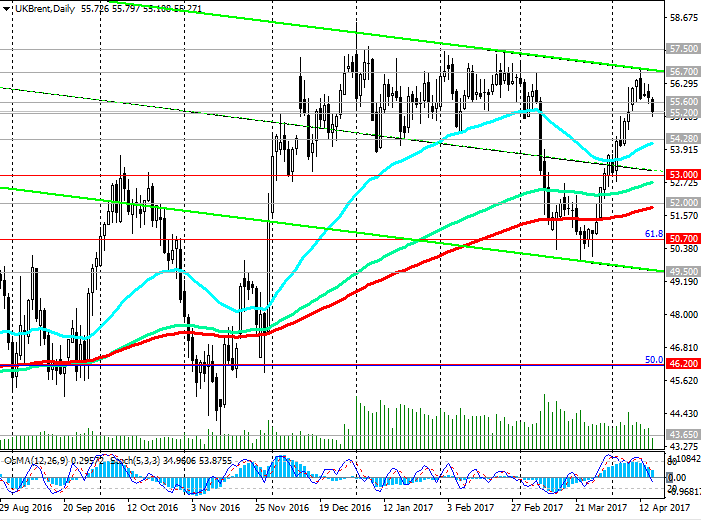
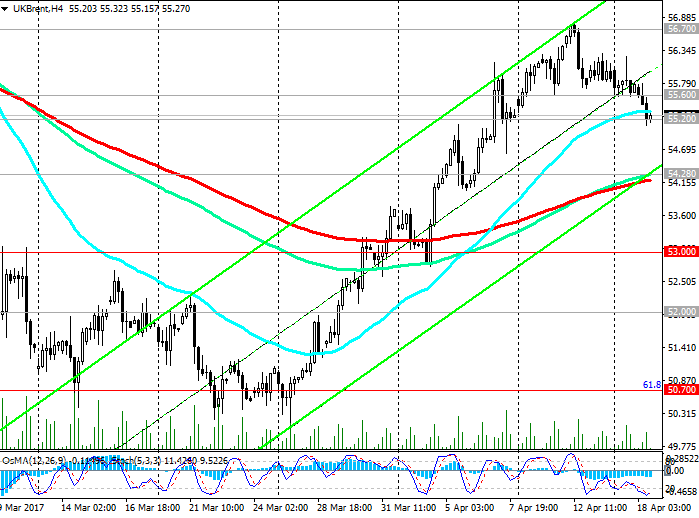
Support and resistance levels
With the opening of the current week, the price of oil is declining. During the European session, the price reached a short-term support level of 55.20 (EMA200 on the 1-hour chart).
Indicators OsMA and Stochastics on the 1-hour, 4-hour, daily charts went to the side of sellers.
If the decline continues, the price for Brent crude will reach support level 54.28 (EMA200 and the bottom line of the ascending channel on the 4-hour chart).
With further decrease, the targets will be support levels of 53.00 (June and October highs), 52.00 (EMA200 on the daily chart), 50.70. In the case of a confirmed breakdown of the support level of 50.70 (the Fibonacci retracement level of 61.8% of the correction to the decline from the level of 65.30 from June 2015 to the absolute minimums of 2016 near the 27.00 mark) and fixing below the level of 50.00, the upward trend in the price for Brent crude oil will be canceled.
However, from the current level of 55.20 it is also highly probable that there will be a retreat and a resumption of growth.
Updating the monthly highs near the 56.70 mark will indicate a further increase in the price of Brent crude oil.
Support levels: 55.20, 54.28, 54.00, 53.00, 52.00, 50.70
Levels of resistance: 55.60, 56.70, 57.00, 57.50
Trading scenarios
Sell Stop 54.85. Stop-Loss 55.60. Take-Profit 54.00, 53.00, 52.00, 50.70
Buy Stop 55.60. Stop-Loss 54.85. Take-Profit 56.70, 57.00, 57.50


 Terminals on One Windows PC (Complete Beginner Guide)")