
FX Technical Weekly: Next Cycle Low for GBP/USD is Early 2017

FX Technical Weekly: Next Cycle Low for GBP/USD is Early 2017
- EUR/USD – 20 day range is insanely small
- GBP/USD relationship at 1.0970
- USD/JPY – watch 105.45 (May low)
EUR/USD
Daily
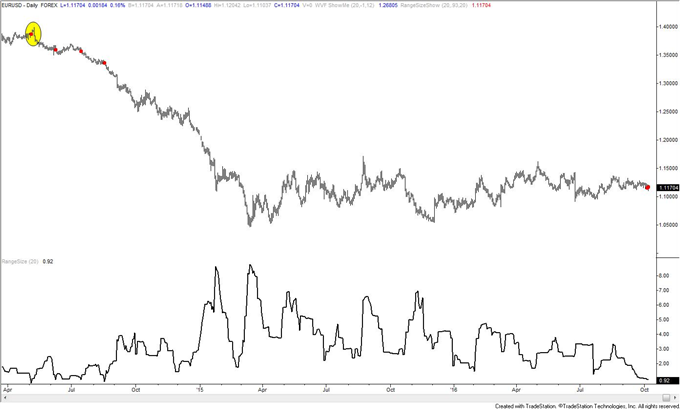
-I’m running out of things to say about EUR/USD. This is a weekly report but I’m showing this daily chart to show that the 20 day range (closing prices) is now the smallest since just before the collapse. The range is a measly .92% right now. The lowest range 20 day range EVER was on 5/5/2014 at just .67%. The top was 3 trading days later. I’m wondering if the initial move out of the current tight range will similarly be a ‘false’ move before a trend takes hold.
GBP/USD
Monthly
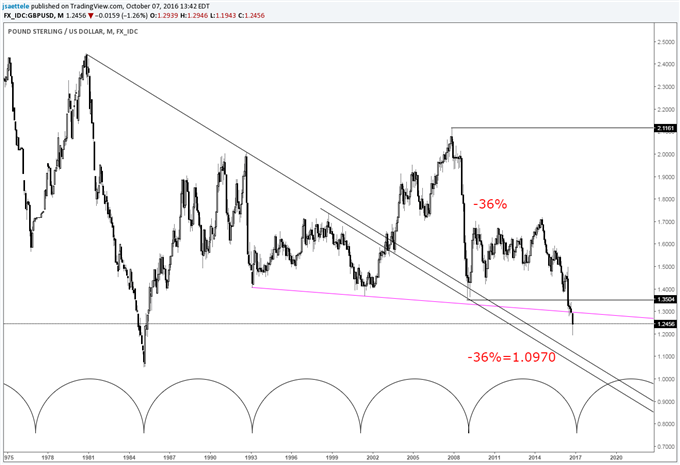
-The last update noted that “the importance of the current juncture cannot be overstated. If the July low gives, then there may be no support until early 2017 based on the 96 month (8 year) cycle low count.” That cycle count is shown on this chart. A price level of interest is where the decline from the 2014 high (1.7191) would be equal to the 2007-2009 decline in percentage terms (36% declines). The math produces 1.0970.
Weekly
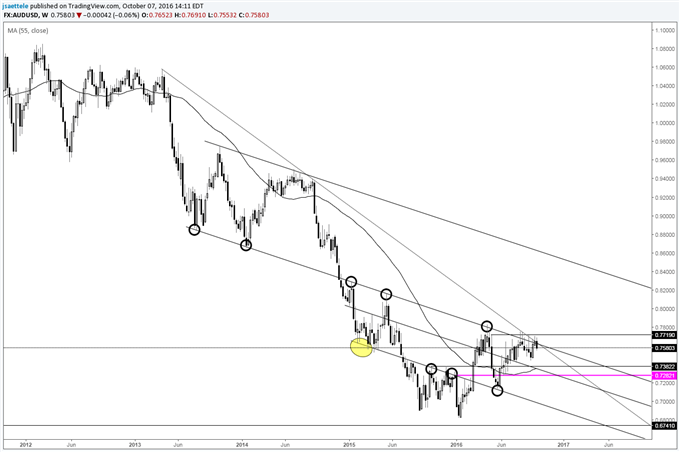
-AUD/USD remains capped by major slope resistance after finding low earlier in the year at ‘macro’ slope support (see the link to the quarterly charts at the beginning of the report). The bullish breakout level (weekly closing basis) is .7719. Strength through there would signal that a basing process is complete for a move to the mid-.80s. Until then, scope remains for additional range trade with support near .7380 (October and December 2015 highs).
Weekly
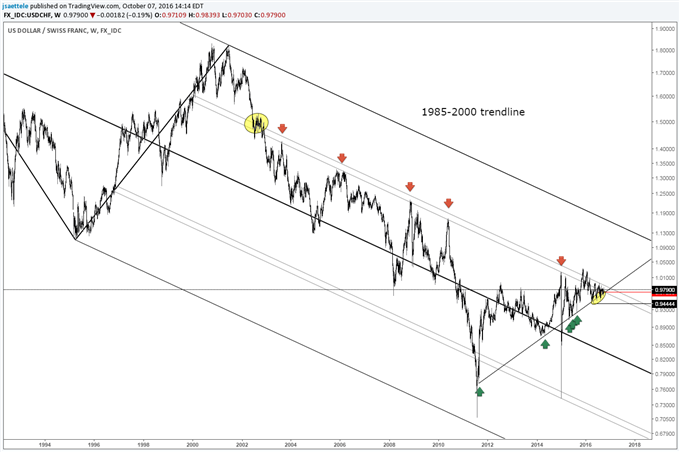
-USD/CHF continues to trade on a parallel to the 1985-2001 trendline. The parallel has been resistance since October 2006 on each advance so a break higher would be a game changer and target the trendline near 1.1500. Swissie has also reached an important pivot in time. Q3 is 63 quarters from the 2000 high. The 2000 high is 63 quarters from the 1985 high. The way I see it, the symmetry warns of a shift in conditions; from range to a MOVE. The 2011-2014 trendline remains the trigger for a downside break. Given the long term symmetry, caution is urged as per SNB history.


 & AMD Framework")
")