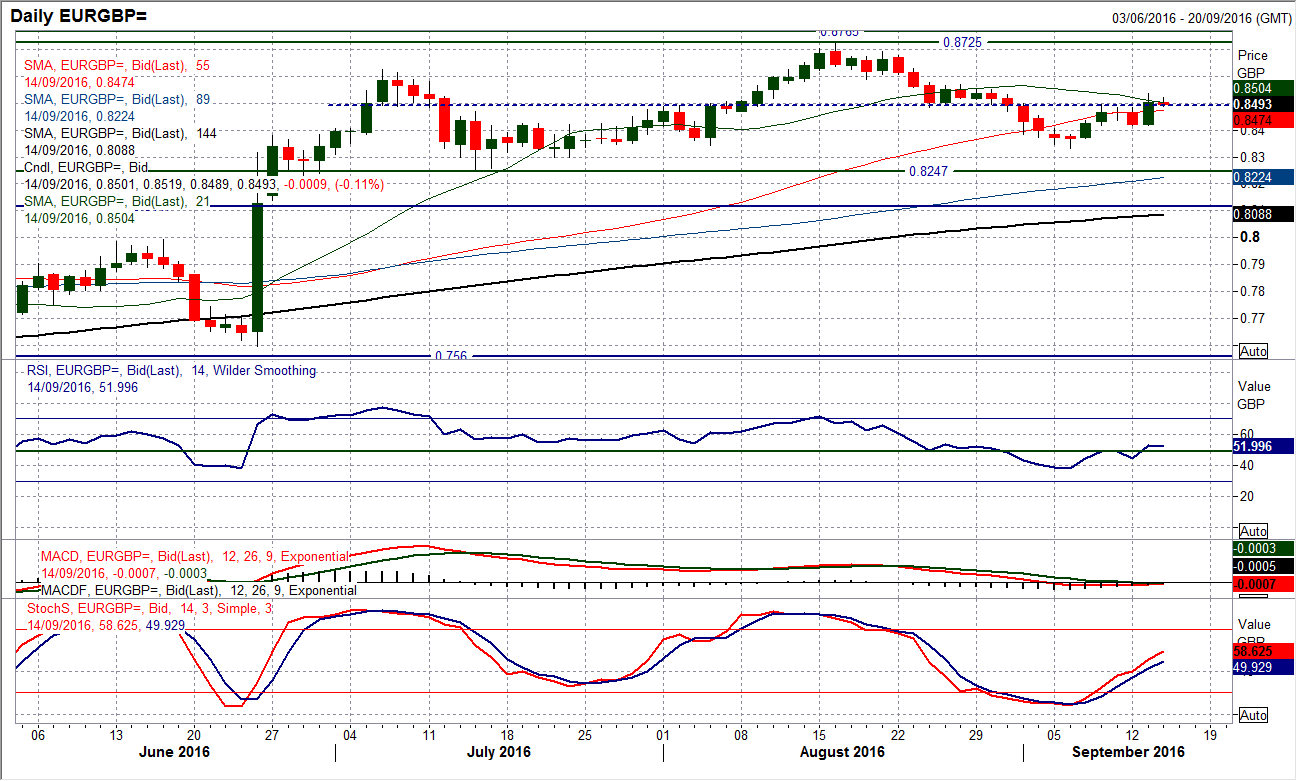
Chart of the Day – EUR/GBP
Euro/Sterling has been trading broadly in a range (albeit with a mild upside bias) for the past few months since the huge volatility in the immediate aftermath of Brexit began to subside. There have been periods of euro strength but also then sterling strength within this move, however I discussed last week that the three week trend of sterling strength back from the high at £0.8725 was coming to an end. The chart has now taken another step forward in this move back towards the bulls favouring the euro again with a strong bull candle that was posted yesterday. The move took Euro/Sterling clear of a medium term pivot line around £0.8490 which has consistently provided support and resistance over the past two months. Although not deadly accurate the number of highs and lows posted between £0.8480/£0.8500 suggests that a pivot line around £0.8490 is a fairly strong gauge for the near term outlook within the range. Yesterday’s bull break means that this line now becomes supportive (the level is holding in the early moves today) and the upside is open. Interestingly this also has coincided with a move back above 50 on the RSI, whilst the Stochastics already pulling strongly higher following their bull cross last week. The immediate resistance now to be tested is £0.8570 and if this can be breached there is upside potential for a test of the August high of £0.8725. The pivot range between £0.8480/£0.8500 is supportive now for a pullback, whilst the bulls are in control above the support at £0.8415. The amount of fundamental data in the next couple of days is likely to drive significant volatility across the pair.

The material has been provided by Hantec Markets


