Will US Retail Sales be a Catalyst for the Dollar?
Market Overview
There has been a hint of move towards more of a safe haven preference overnight as the yen has started to regain ground again and the gold price has been supported and the dollar is looking to gain ground. However, can the dollar finally find some sustainable direction after ranging for the past few days? Perhaps today we will finally get a decisive catalyst for the dollar with the announcements of Retail Sales and Michigan Sentiment. Recent US data has clouded the perception of when the Fed will be able to next raise interest rates and the disappointing earnings from Macy’s this week will put added influence on the data today. The US consumer is a vital element to the economy and if the signs are that the data is tailing off then it will add to the difficultly present for deciding on a rate hike. Despite this though Fed members continue to talk about the potential for two rate hikes this year with Eric Rosengren, usually on the dovish end of the scale, suggesting that the market is too pessimistic on the US economy. Perhaps todays data will help to provide more clarity.
Wall Street seems to have lost any upside traction closing almost flat last night, whilst Asian markets have fallen away as the safe haven bias has crept in overnight (Nikkei closed -1.4%). European markets are also cautiously negative at the open. In forex trading there has been something of a safe haven shift today with the yen the biggest outperformer whilst the dollar is trading mildly stronger against all the other major currencies. The yield on the 10 year Treasury continues to fall, whilst the precious metals of gold and silver are both making gains. The oil price is just under a percent lower today.
Traders will be looking towards the announcement of Eurozone GDP at 1000BST with an expectation that Q1 growth could have been +0.6%. Then the focus turns to the US with the release of Retail Sales at 1330BST which is expected to show core month on month data at +0.5%. PPI inflation is also at 1330BST and is expected to show an improvement from -0.1% to +0.2% for the year. The preliminary reading of Michigan Sentiment is at 1500BST and is expected to come in at 90.0 which is slightly higher than the final 89.0 last month.
Chart of the Day –
USD/CAD
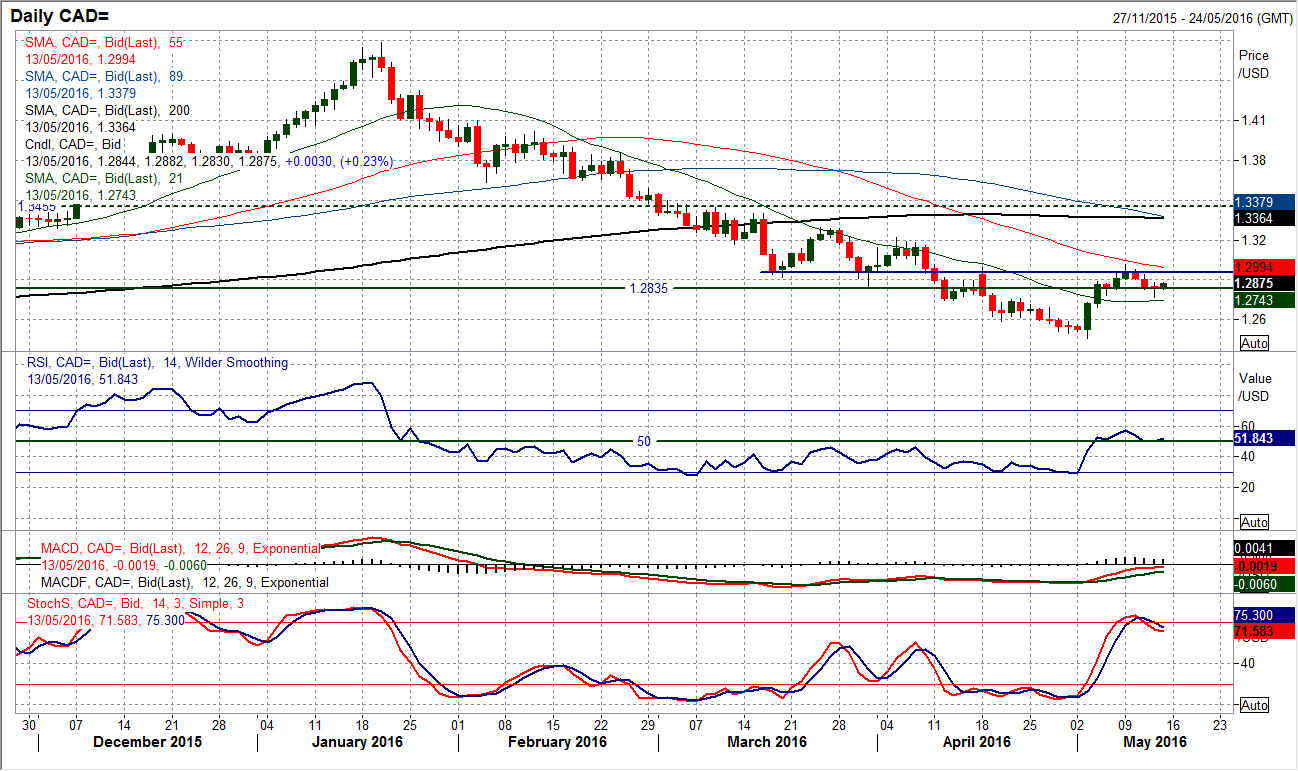
The technical rally on USD/CAD has hit the buffers and there are now big questions over whether the this is simply a pause in the recovery or whether there will be renewed downside potential again. On a closing basis, the pivot of the old floor from March has once more become the basis of resistance around 1.2970 on the latest rally (just as it did on the original pullback in April). The concern for the bulls is that this has coincided not only with the unwinding of bearish momentum in the RSI and Stochastics, but there has also been a crossover sell signal which is looking like it will be confirmed today. However, the intraday technical rally yesterday meant that the decline was reversed to form a long tailed doji, which reflects the uncertainty that the sellers of USD/CAD are not quite ready to regain control, something that has continued into today. The fact that this rebound came from just above the now rising 21 day moving average (currently 1.2740 and which has also previously acted as a strong gauge for the pair) also adds to the uncertainty of the renewed downside. This now means that the key levels to watch for control would be an intraday move above 1.3015 with a close above $1.2970 for the bulls, whilst the bears need a breach of 1.2740. The hourly chart shows the deterioration and a formation of lower highs in the past few days, with initial resistance in the bans 1.2880/1.2900.
EUR/USD
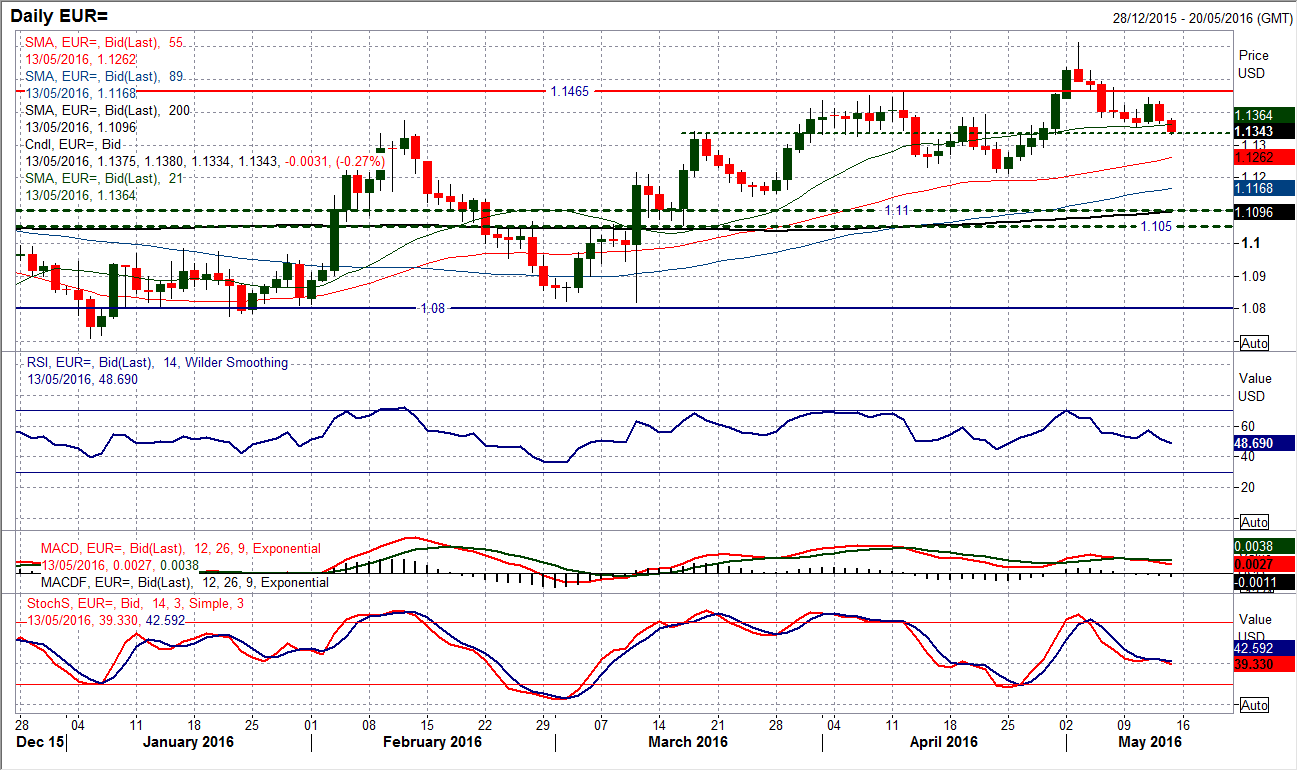
The bulls have failed to regain control with the gains that were posted during a positive day on Wednesday being entirely undone by a retracement candle that has left key near term resistance at $1.1445 yesterday. The move neutralised the outlook but now further losses today have breached the support at $1.1357 to test $1.1330. The momentum indicators are starting to fall away again with the RSI dipping below 50 however there is no confirmation as yet of a deterioration. The old pivot at $1.1330 is now under pressure and a decisive breach would re-open the key April low at $1.1215. The hourly momentum has turned corrective near term. Initial resistance is the overnight high at $1.1380 and $1.1415, with $1.1445 now key near term. Watch out for the US consumer data today (Retail Sales and Michigan Sentiment) which will also provide some direction.
GBP/USD
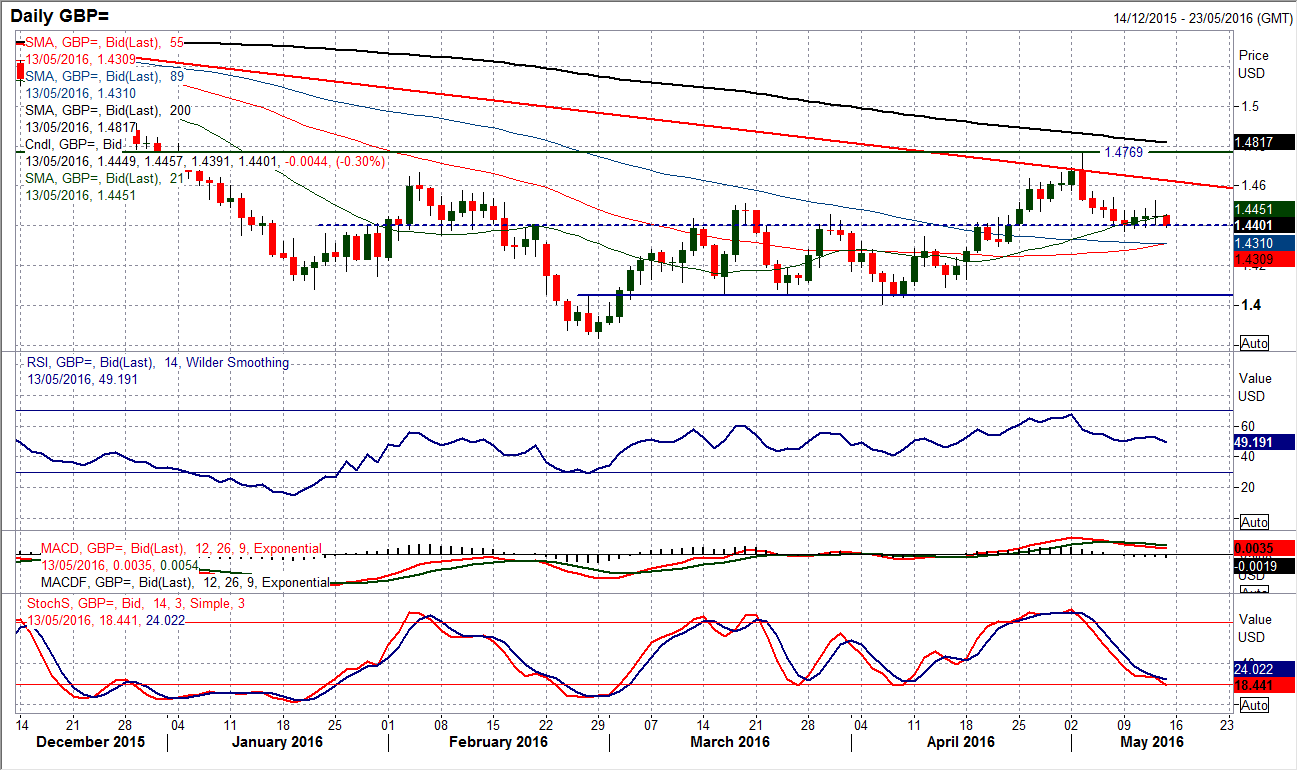
After a couple of marginally positive candles had set up for some early gains yesterday the bulls looked to be getting back in control again, however a retracement to form a doji candle questions this outlook and the uncertainty continues. However the bulls will point to a sequence of higher lows in the past three days with the support around $1.4400 still seeming to hold. As with the euro, there is little indication of direction on the momentum studies, with a mixed outlook on RSI, MACD and Stochastics. The hourly chart shows that there is an improvement in the last few days with the hourly RSI bouncing from the 40 level and up towards 70, whilst the MACD lines are mildly positively configured. This suggests that the support around $1.4400 is strengthening. Yesterday’s peak at $1.4530 is the initial resistance and be a marker for the bulls in this consolidation period. A breach of $1.4372 opens the key support at $1.4300. Once more, as with the euro a catalyst may be needed.
USD/JPY
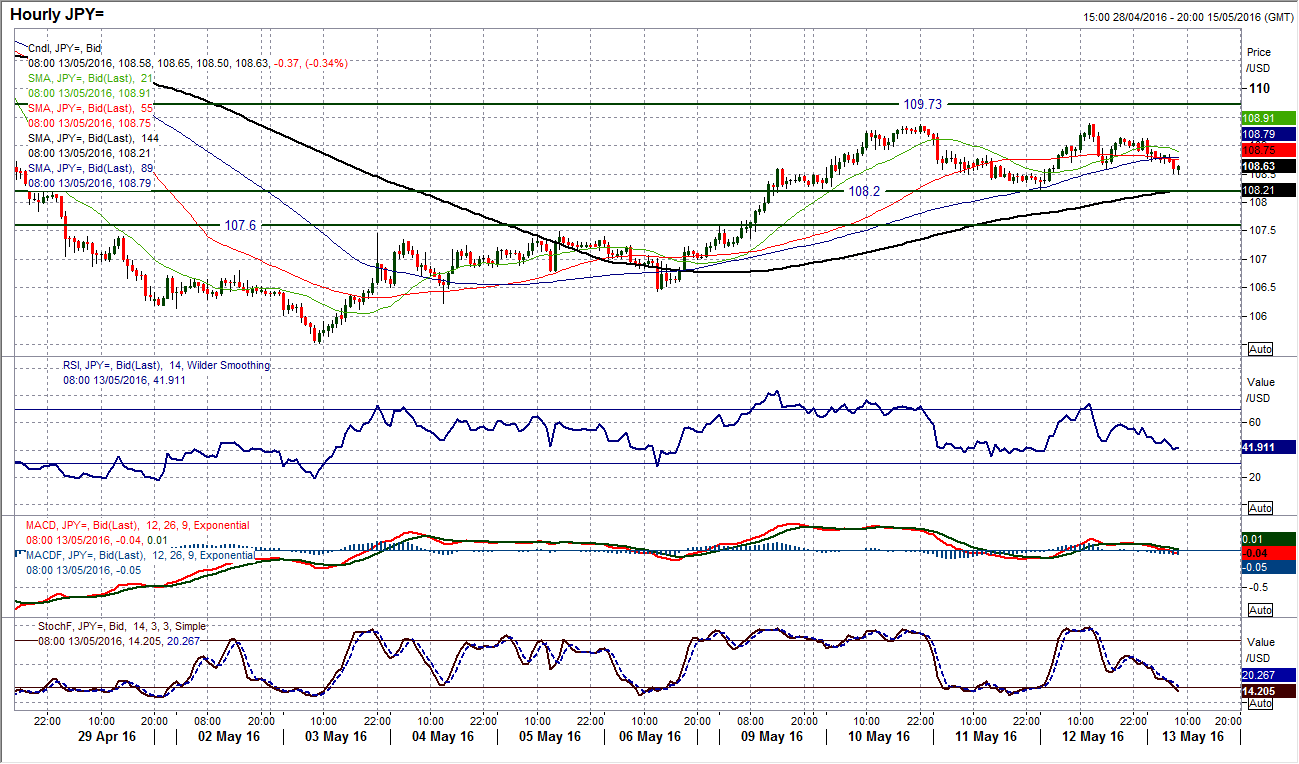
A consolidation has set in for the past few days with some choppy moves and a lack of direction This is helping to neutralise the momentum indicators with the Stochastics and RSI both flattening around their mid-points of 50. The hourly chart shows a range bas built up as yesterday’s failure to decisively break 109.37 has simply added to the resistance at 109.39. A breach of yesterday’s intraday low at 108.60 would confirm the loss of the bull control in this rally and re-open the low at 108.20 which is now the bottom of a 120 pip range. I continue to believe that rallies are a chance to sell on Dollar/Yen despite the jawboning of Japanese government officials. There is further overhead resistance around 109.75.
Gold
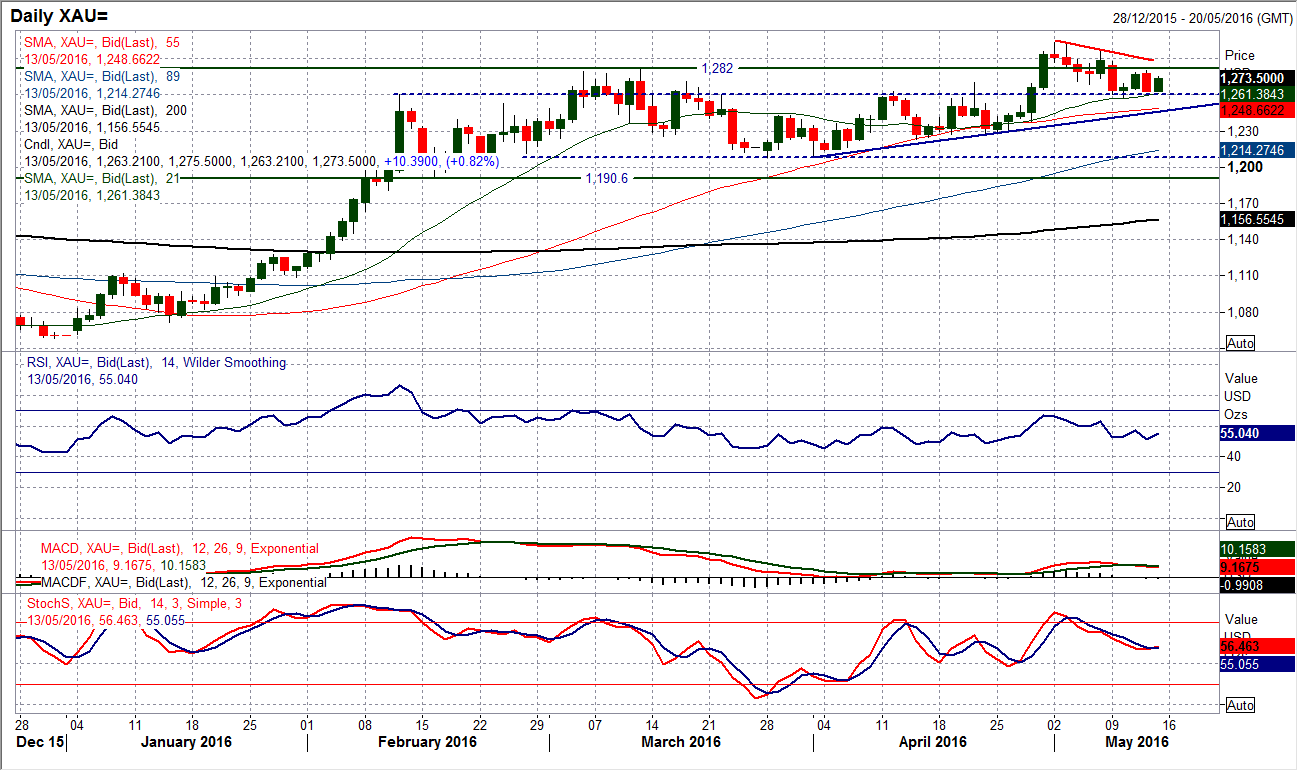
The period of consolidation that is evident on the dollar also stretches to gold which has spent the past four days trading between the low at $1257.25 and resistance at $1280.60. This near term slide and sequence of lower highs over the past two weeks is building support around the old resistance at $1260 and with the momentum indicators still in medium term positive configuration this is still likely to be a near term correction that is seen as a chance to sell. However, for now the consolidation has set in, with yesterday’s candle unwinding the gains of Wednesday only to be followed once more by $8 of gains this morning. The hourly chart shows an increasingly neutral configuration has formed in the past few days. The near term downtrend resistance comes in around $1287 today, whilst it is clear that the market is once more looking for a catalyst. A decisive move above $1280 or below $1257 would start to build some momentum again.
WTI Oil
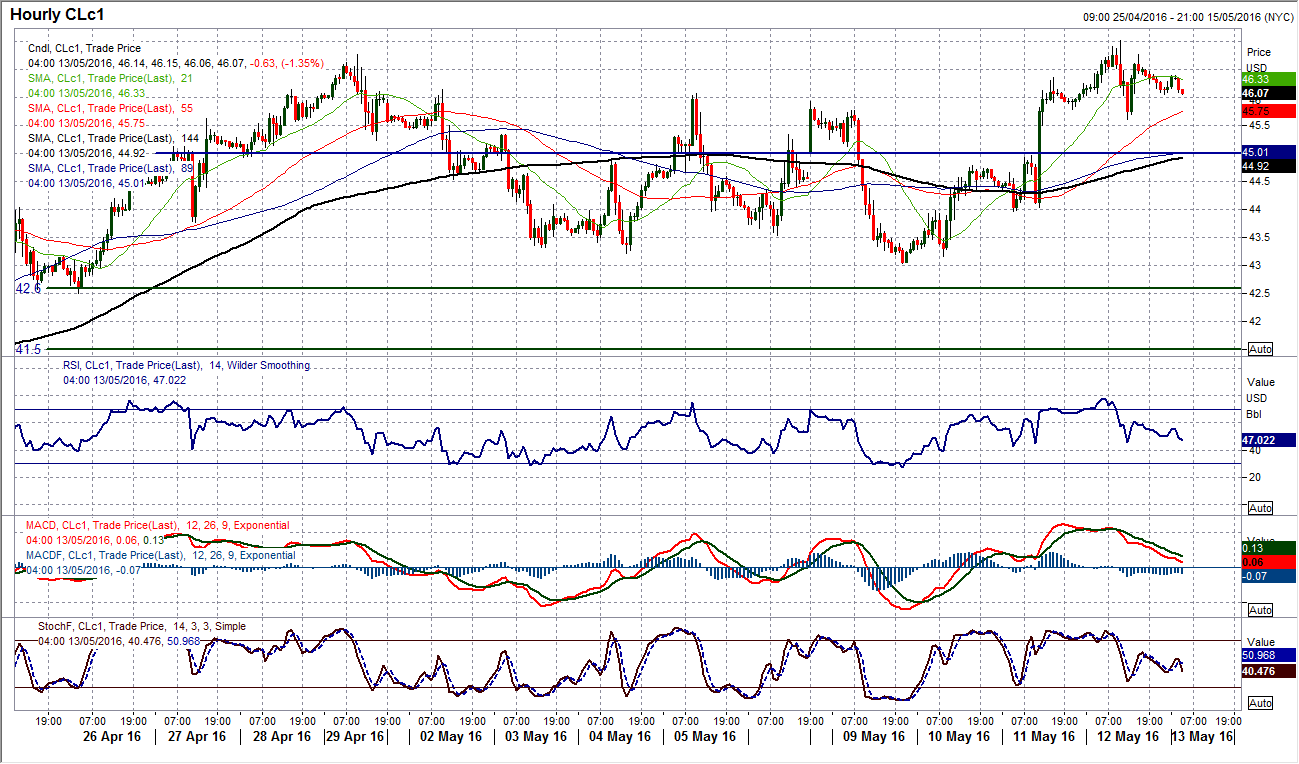
The oil price remains supported with three successive strong bull candles. Yesterday’s move saw WTI push above $46.80 to a new high dating back to early November. Although the bulls pulled back from $47.02 to close below the breakout, momentum indicators remain positive and there is little reason to think at this stage that there will not be a breakout that will be sustained in the coming days. The RSI still has further upside potential whilst the Stochastics have only just turned up. With the medium term outlook and uptrend all pointing to further gains, it would suggest that near term corrections are a chance to buy. The hourly chart shows a near term support at $45.60 was posted as the bulls has formed a sequence of higher lows in the past few days. However the support in the range $44.00/$45.00 is more considerable for a potential pullback today. A decisive breakout above $46.80 would open the November high at $48.35 and subsequently the October high at $50.92. The key support remains $42.50/$43.50.
![]()


