
US DOLLAR Technical Analysis: Is The Dollar Dominance Fading?

US DOLLAR Technical Analysis: Is The Dollar Dominance Fading?
Talking Points:
- US Dollar Technical Strategy: US DOLLAR May Retest 11,850
- Probability of Fed Hike Is Vanishing Alongside US Dollar Bulls
- Recent Fed Commentary on Uncertainty Pushes Down Treasury Yield & US Dollar
*FED'S WILLIAMS SAYS NEGATIVE RATES `POTENTIALLY IN TOOLBOX.'
The US Dollar has had a February to forget. The US Dollar has had its toughest month since June & April of last year while currencies like the Japanese Yen are having their best month in nearly a decade. An unwind of optimism that is hitting equity markets, and commodity sectors seem to be spreading to the US Dollar and the Federal Reserve’s plans for US interest rates and thereby, the US Dollar. The quote from SF Fed President John Williams at a speech on February 25, which is evidence to market liquidity and overall uncertainty at present.
US Dollar May Have Run Into Long-Term Resistance Again
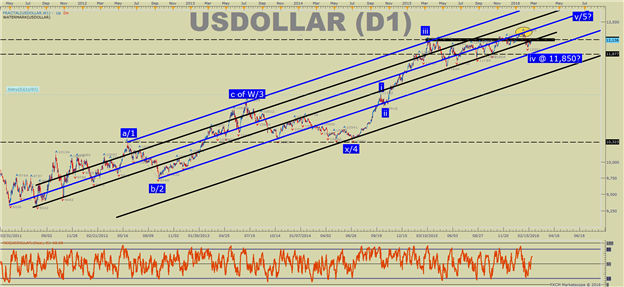
The chart above shows a price channel that has framed price relatively well from the 2011 low. Lower. The validity of the price channel can be seen on the snap-back into the price channel in summer of 2014 and the resistance points holding back further price advances in March ’15 and January. Now, price appears to be wallowing as traders are unsure if they should buy more JPY, even in light of negative interest rates or if theBritish Pound has fallen below fair value and therefore should be bought.
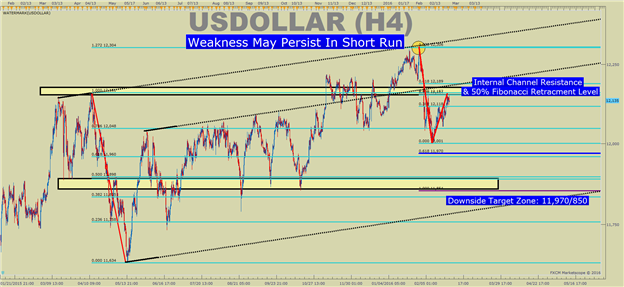
Key Levels: Watch the 10-Month Trendline
Looking at a more relevant chart for short-term price action, you can see an 11-month price channel that also appears to provide guidance. You can see the late January channel resistance aligns with 127.2% Fibonacci Extension of the April-May range. Since then, we have moved aggressively lower followed by a 50% retracement at 12,154 at present.
We have noted before that the month or February is a seasonally weak month for the US dollar. Whether or not we see, sustained weakness will likely depend on a break below the recent higher low of 12,053. A break and daily close below 12,053 could be the first sign of a further wipe out of recent hard-fought gains in October-January.
Fibonacci expansions provide downside levels. The 61.8% expansion of the early February decline targets 11,970. A further breakdown would turn focus to a level of technical confluence at 11,850. As you can see on the first and second chart, 11,850 would bring us to support, and buyers may jump in to propel us to another leg higher.
A break below 11,850 could argue a larger behavior change is afoot, and US Dollar weakness could become a broader and surprising theme for 2016.


")
")
")