
Good Morning Forex Friends
We were looking for weekly closing and it was hanging man candle stick closing.That indicating the bearish move this week.I am sharing weekly , daily and 4 hour chart to give my bearish view this week.Please have a look
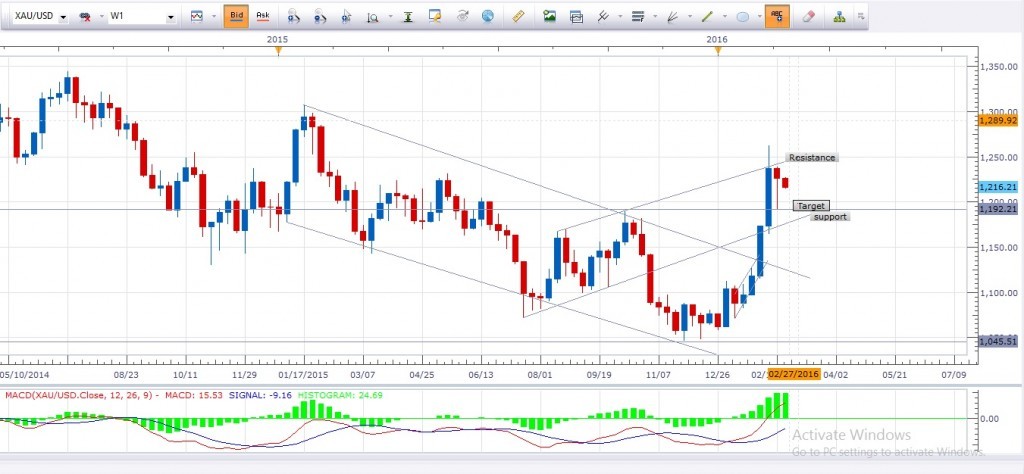
Weekly Chart Pattern
We can see hanging man candle stick forming in weekly chart that indicating a bearish move this week.I am expecting gold may touch its support again at 1191-93 and movement above 1245 will invalidate our bearish point of view this week.


 Trading Guide")

")