

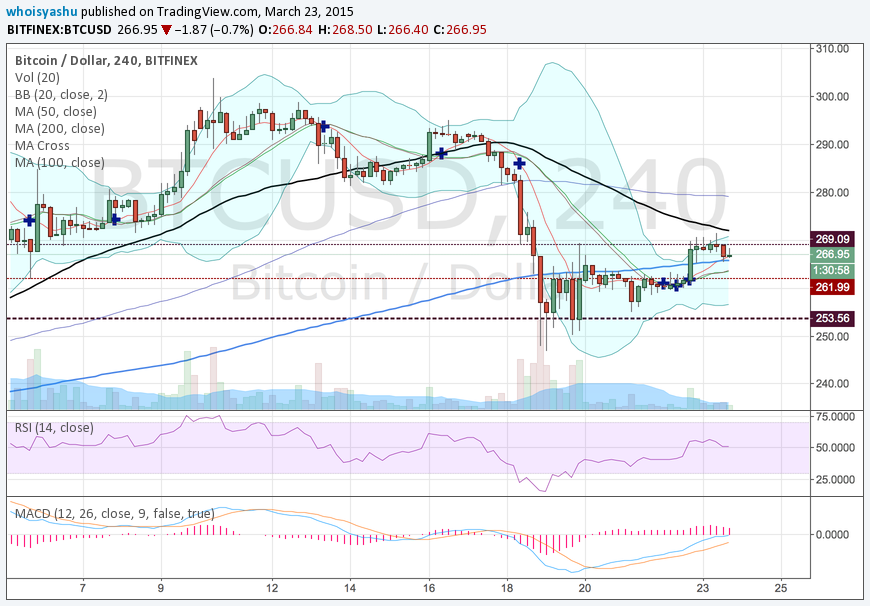
As you can see the chart above, the Bitcoin price currently sighting to
cross above the Bollinger Band limit, while testing its 50H MA in the
process. The temporary support has definitely shifted near 261, the
point which marked the previous short upside correction. The RSI
meanwhile has managed to float above 50 whole day, giving market a
neutral position. And the MACD has almost aligned with the signal line,
indicating yet another countdown towards moving into a positive
territory. These indicators together indicate a neutral scenario in the
Bitcoin market.
Things are looking smoother than the last few days. But it doesn’t mean
it will remain to be. An overlong consolidation will ensure an equally
vibrant breakout so traders should be ready to set their risk management
plans. Let’s discuss the scenarios then.
The 269-seems to an ultimate resistance point as per the current price
movements. Therefore, setting your exit points near 263 will ensure a
timely exit in case the retest succeeds. However, in case the price
extends above the resistance line, the pressure would likely fall on the
50H MA curve (at present it is around 271). Setting your long positions
near this point would ensure a decent profit takeout. Make sure to set
you long positions only when price breaks above 269. Do not go long
towards until the 271 upside risk is breached.


![[Two Different Approaches to Market Timing]: The Spiral Calendar and the VISTmany Research Project](https://c.mql5.com/6/1012/splash-preview-771691.png "[Two Different Approaches to Market Timing]: The Spiral Calendar and the VISTmany Research Project")

