

Candle Breakdown
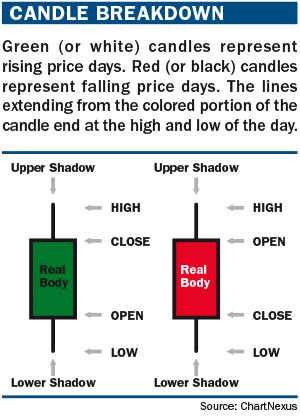
For those not familiar with the details of candlestick charting, it’s important to go over the fundamentals. The difference between the open and the close is called the “real body” of the candlestick. The higher of these values creates the upper extreme of the real body, and the lower of these values creates the lower extreme. The amount the stock rose in price above the real body is called the upper shadow. The amount that the stock fell below the real body is called the lower shadow.
If the candle is green or white, it means the lower extreme is defined by the opening price and that the stock’s price rose during the period being charted. If the candle is red or black, then the lower extreme identifies the closing price, and the stock fell during the period.
DOJI
The doji is one of
the most important candlestick patterns. A doji formation is a
single-candle pattern. It occurs when prices opened and closed at the
same level. A doji represents equilibrium between supply and demand, a
tug of war that neither the bulls nor bears are winning. Traders should
not take action on the doji alone. Always wait for the next candlestick
to make an appropriate trade.
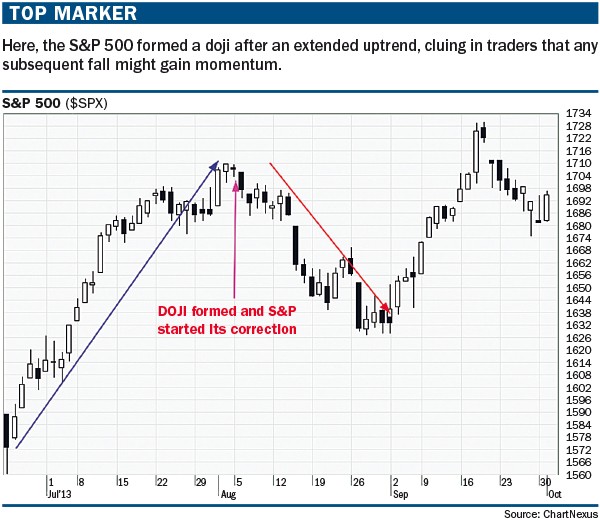
Confirmation of a new downtrend came on Aug. 6 when the S&P 500 broke the Aug. 5 low of 1703 and closed at 1697.3. A reasonable stop loss could have been placed at the Aug. 5 high of 1709.
Engulfing pattern
The bullish engulfing pattern is most significant when it occurs after a prolonged downtrend. The stock or index has been selling off sharply. On the day of the bullish engulfing pattern, prices will often start the day by falling. However, strong buying interest comes in and turns the market around.
As seen in “Expanding opportunity” (below), the trader would not buy exactly on June 23 when the bullish engulfing pattern was formed, however. The trader would wait for the June 23 high of $331.69 to be broken and sustained for a subsequent trading session. Confirmation came on June 28, when prudent traders might have initiated long positions. A reasonable level for a stop loss would be the June 23 low of $318.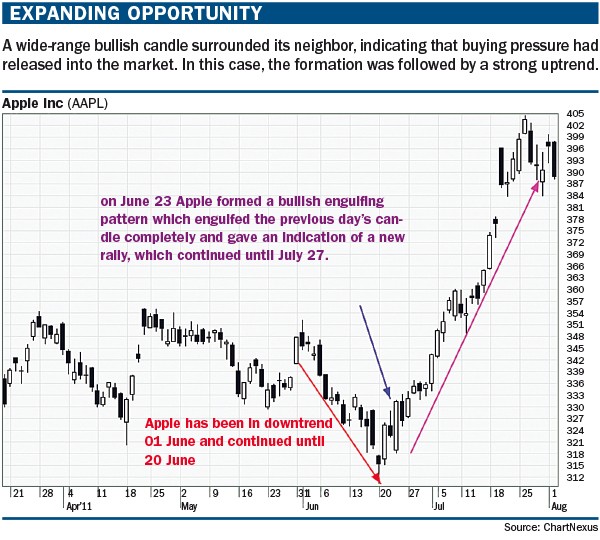
The bearish engulfing pattern is the opposite of the bullish engulfing
pattern. Like its companion, it is most significant when it occurs after
a prolonged, steady trend. On the day of the bearish engulfing pattern,
prices often begin by rising. However, strong selling comes in and
turns the market around.
Hammer
The hammer candlestick pattern forms after a prolonged downtrend. It is considered a strong reversal signal. On the day of the hammer candle, there is strong selling as the market opens up. As the day goes on, however, the market recovers and closes near the unchanged mark, or in some cases even higher.
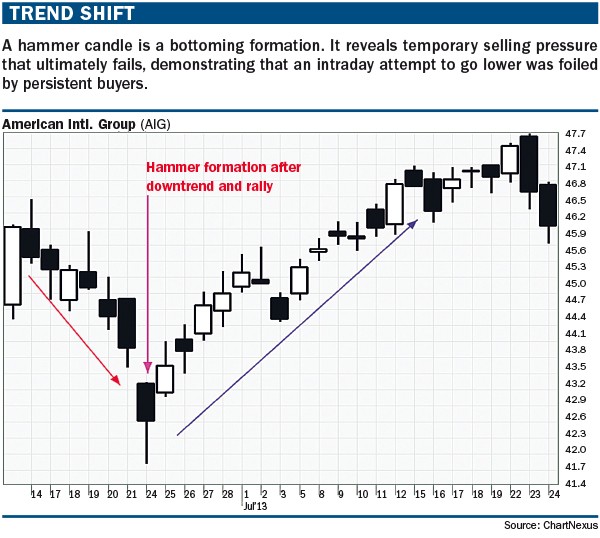
A reasonable entry point for this particular hammer pattern would be at the high of June 23 at $43.04. On June 25, AIG opened at $42.85 and once $43.01 was broken, longs could have been initiated with a stop loss at the June 23 low of $41.53. AIG in the coming sessions made a high of $46.83.
Hanging man
Hanging man candlestick formations are another reversal pattern. This formation typically happens after a prolonged uptrend when a security moves significantly lower after the open, but rallies to close well above the intraday low. It is important to emphasize that the hanging man pattern is a warning of potential price change, not a signal, in and of itself, to go short.
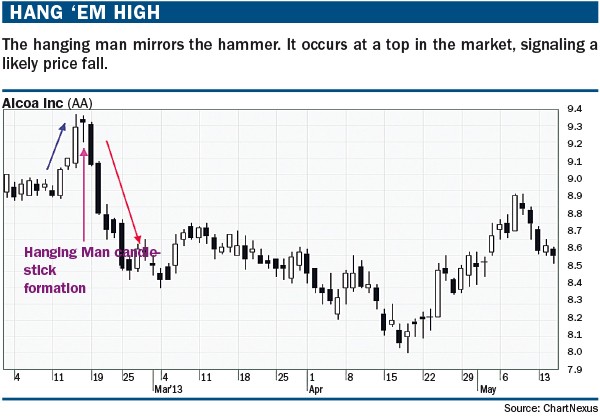
A trader might have taken short positions once the Feb. 15 low of $9.20 was taken out in subsequent trading sessions. This happened on Feb. 19 when Alcoa opened at $9.31. Once the $9.20 level was broken, shorts might have been initiated, with a stop loss set at the Feb. 15 high of $9.36. In later trading sessions, Alcoa reached a low of $8.30.
Although they are relatively reliable, candle patterns are just one
tool in a trader’s toolbox. Traders should integrate candlestick
analysis, moving averages, Bollinger bands, price patterns (such as
triangles) and indicators (such as stochastic or CCI) to reach trading
decisions.


")
 & AMD Framework")