

The Fibonacci equal wave pattern provides us at least a 1-to-2 risk-to-reward ratio trading opportunity. Below, we provide two examples of how you can incorporate the equal wave pattern into your current forex strategy and technical analysis.
GBPJPY Carves an Equal Wave Pattern
The GBPJPY has been trending to the upside, so let’s look to the equal
wave pattern to time potential reversal zones to buy into this uptrend.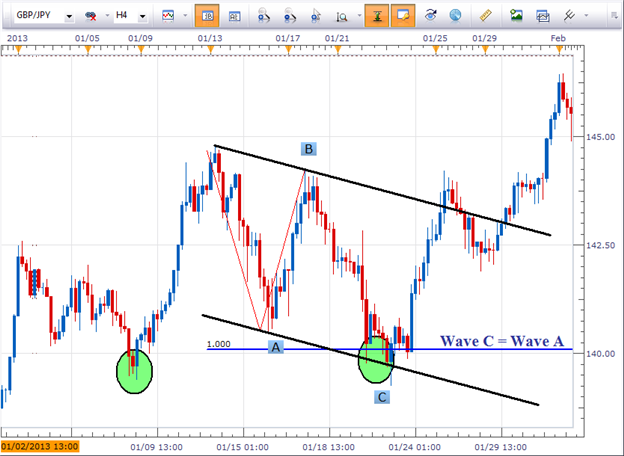
Equal Wave and Elliott Wave Theory
For those who understand Elliott Wave theory, a simple A-B-C move
where wave A equals the length of wave C may look familiar to you. A
pattern where wave A equals the length of wave C implies it is a
corrective move and the whole pattern is likely to be retraced. In the
example above regarding the GBPJPY, prices eventually broke to new
highs. So if a trader correctly bought in the support zone with a wide
enough stop loss to absorb the market’s natural breathing, the potential
for upside on the trade would have been a new swing high, nearly 400
pips away.
No Pattern is Perfect
Fibonacci Retracements and Fibonacci Expansions
A question we often get regarding the Fibonacci retracement levels is how do you know which fib line to trade?
Well, if you practice measuring out equal waves, you can use the
Fibonacci expansion tool to help focus on a particular retracement
level.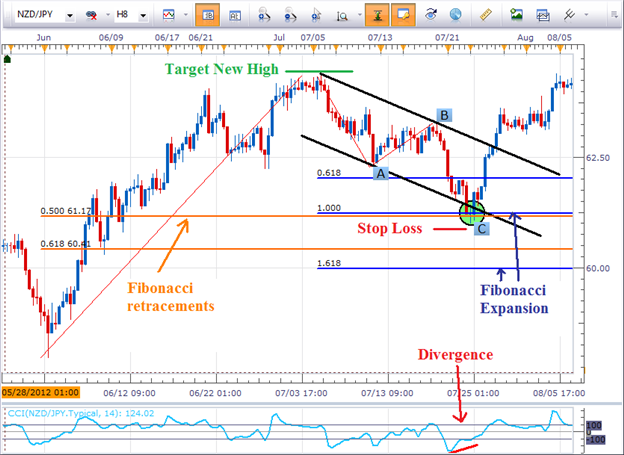
Since this is an equal wave pattern, you’ll want to place your stop loss
just below the swing low and target at a minimum a new swing high. In
this case it would be risking about 75 pips for the potential reward of
300. It is not uncommon for this pattern to produce at least a 1-to-2
risk-to-reward ratio.


