
Something To Read - Gold Value and Gold Prices From 1971 to 2021

Gold analyst Gary Christenson, author of the book “Gold Value and Gold Prices From 1971 to 2021“, observes that since June of 2013 there has been a modest downward bias in the gold market but that is changing now.
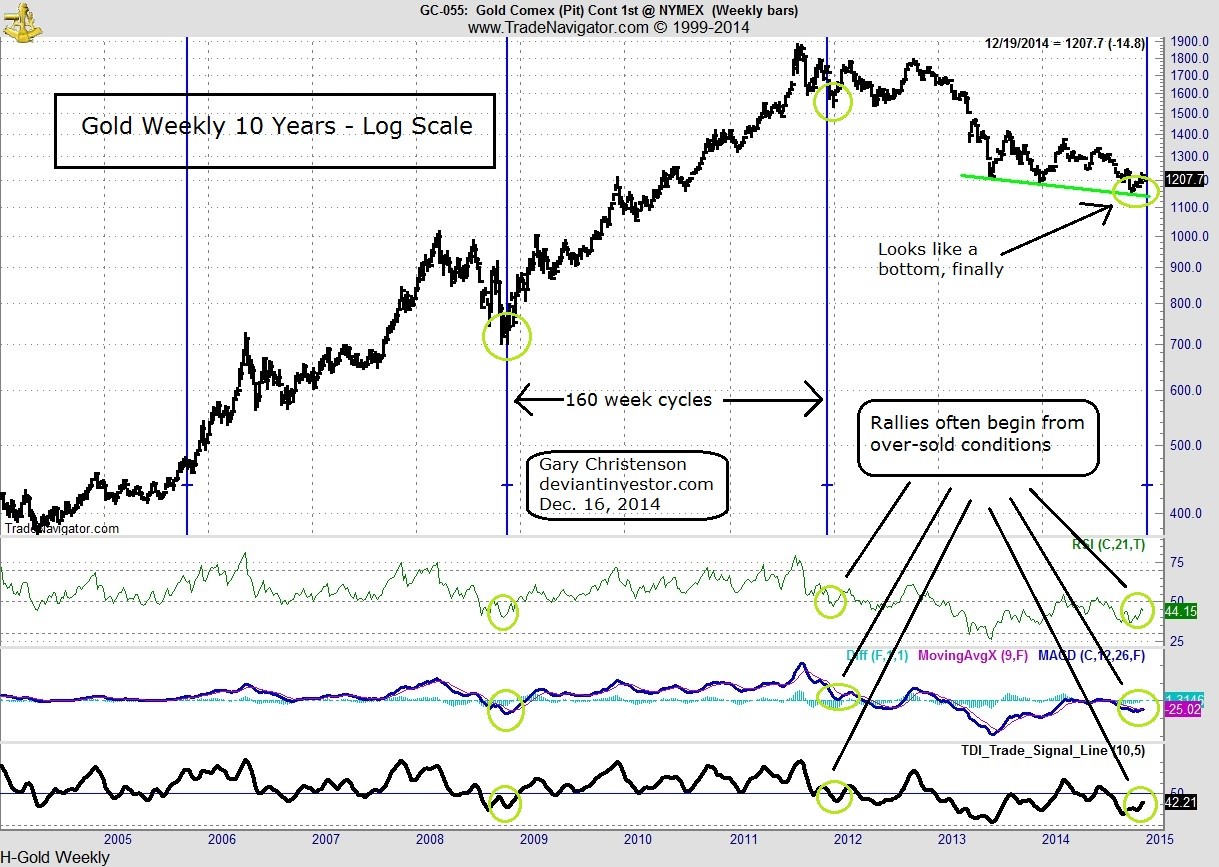
His chart analysis suggests that gold has most likely bottomed and should rally to new highs in 2015 or 2016. Why? Demand from Asia is strong, mining supply is nearly flat, and excess demand has been met by dishoarding and gold “leasing.” China, India and Russia want more gold and some western countries are requesting the return of their gold stored in New York and London. Current financial and geopolitical anxieties will encourage gold price rallies and additional gold repatriation. The weekly chart of gold prices for the past ten years shows important lows in 2005, 2008, 2011, and 2014 – all separated by about 160 weeks. Note the vertical blue lines and the supportive positions of the over-sold technical indicators, the RSI, MACD, and TDI.
Christenson says there is no guarantee that gold has bottomed and will reach new highs in the next two years, but massive demand, geopolitical anxiety, more war, time cycles, and chart based analysis all suggest that a lasting bottom has been formed and that the probabilities strongly favor continued strength instead of price weakness.


")
")
![[XAUUSD]: Weekly Liquidity Activation Points (timings), June 22-26, 2026](https://c.mql5.com/6/1013/splash-preview-771790.png "[XAUUSD]: Weekly Liquidity Activation Points (timings), June 22-26, 2026")