
In this article I will provide my view on the EUR/CAD, AUD/USD, AUD/NZD and USD/CAD . These are the pairs that I am currently interested in or was interested in last week for trading with the Hybrid Grid strategy. I will pick one to analyse in more detail from the pairs that have not been discussed yet recently.
- All trades are based on specific
rules according to the FxTaTrader
Hybrid Grid strategy.
- For the performance and closed positions click
here.
This article will provide:
- The weekly currency chart for the analyzed pair.
- The weekly(decision) chart for the analyzed pair.
- Possible positions for the coming week and positions taken.
According to the TA Charts, the "Currency score" and the "Ranking & Rating list", all the pairs in the Top10 of the "Ranking & Rating list" are good to trade but for the JPY pairs they should be below the Upper Bollinger Band in the Weekly chart. See also my previous articles of this weekend.
There are some rules for taking positions according to the FxTaTrader Hybrid Grid Strategy. The strategy can open multiple positions of a currency pair but each currency may only be present once in the same direction in the pairs chosen for trading. It means that not all the possible positions of this coming week can be opened. For more information see FxTaTrader Hybrid Grid Strategy. Another rule is that a pair outside the Bollinger Band in the Weekly chart is considered overbought/oversold. No positions are taken for these pairs which are in this case the JPY pairs. The preference for this coming week goes to the EUR/CAD with the AUD/USD.
Last week (pending) orders were placed for the EUR/CAD, USD/CAD and the AUD/NZD with profit 2x EUR/CAD, 1x USD/CAD and 1x AUD/NZD. See the Performance page on my blog for more details.
_______________________________________________________
Open/pending positions of last week
EUR/CADThis pair will be analyzed briefly, for more information read the article Review FxTaTrader Strategy Wk 47/48. Profit was made last week on 2 positions.
The pair looks interesting in the last few weeks for going short. The pull back last week offered a good opportunity and profit was made on 2 short positions. The situation is more or less similar to last week and the pair is now back on the lower side of the range of the last 2 weeks.
- In the daily chart the Ichimoku is meeting all the conditions.
- The MACD is in negative territory and consolidating.
- The Parabolic SAR is long but showing the preferred pattern of lower stop loss on opening of new long and short positions.
Rank: 4
Rating: - -
Total outlook: Down
_______________________________________________________
USD/CAD
This pair will be analyzed briefly, for more information read the article Review FxTaTrader Strategy Wk 48/49. Profit was made last week on 1 position. The situation compared to the last weeks has improved and the pair looks interesting for the Hybrid Grid strategy. After the strong pull back in the weekly chart a few weeks ago the pair made a strong rebound in the last weeks. The indicators are looking fine for going long and it seems as if the uptrend is resuming.
- In the daily chart the Ichimoku is meeting all the conditions.
- The MACD is in positive territory and gaining strength.
- The Parabolic SAR is long showing the preferred pattern of higher stop loss on opening of new long and short positions.
Rank: 21
Rating: = +
Total outlook: Up
_______________________________________________________
AUD/NZD
As promissed in the previous week this pair will be analyzed in more detail because positions have been taken on the pair. The situation compared to the last weeks has improved and the pair looks interesting for the Hybrid Grid strategy. The downtrend has resumed in the last weeks and profit has been made on 1 short position. The indicators are looking fine for going short.
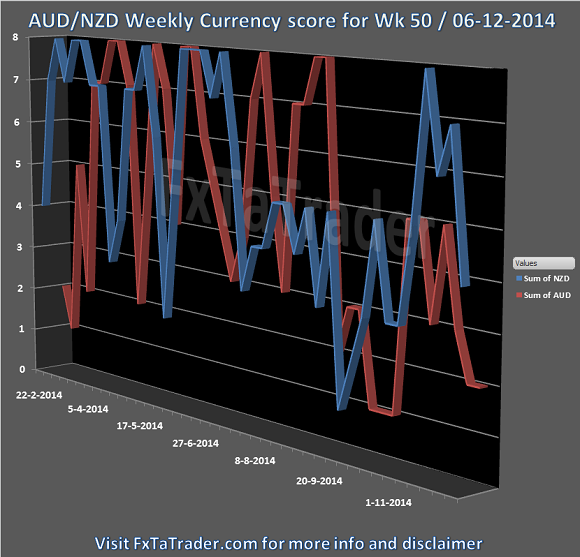
- As can be seen in the Currency Score chart in my previous article of this weekend Forex Weekly Currency Score Wk 50, the AUD is having a score of 2 and the NZD a score of 4. With a Currency score difference of only 2 and both currencies having a classification of average performers it is not an interesting pair in the coming week for going short. It was however an attractive pair last week.
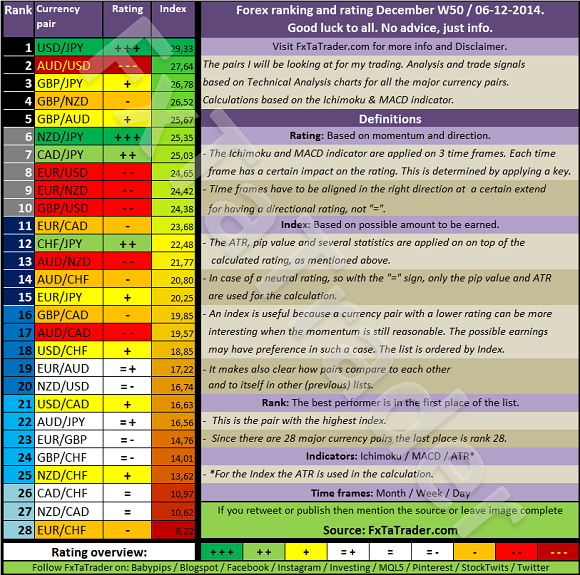
- The position in the Ranking and Rating list in the last weeks also shows that the pair is attractive for taking short positions. However in the current Ranking and Rating list Forex Ranking & Rating Wk 50 the ranking is 20 so it does not have the preference in the coming week. This list is used as additional information besides the Currency score and the Technical analysis charts.
- Besides the general information mentioned the outlook in the TA charts also makes it an attractive opportunity for the coming weeks.
Rank: 20
Rating: -
Weekly Currency score: Neutral
Based on the currency score the pair looked interesting in the last 3 months, however not for the coming week. The NZD is an average performing currency from a longer term view and currently having a currency score of 4. The AUD is also an average performing currency from a longer term view and currently having a score of 2. Based solely on this information the pair does not look interesting for going short in the coming week.
_______________________________________________________
Monthly chart: Down
- On the monthly(context) chart the indicators are looking strong for going short.
- The Ichimoku is meeting all the conditions.
- The MACD is in negative area and regaining strength.
- The Parabolic SAR is short showing the preferred pattern of lower stop loss on opening of new long and short positions.
- Since the monthly chart is used to get the context how that pair is developing for the long term the indicators are looking fine because they are showing strength in the current uptrend.
Weekly chart: Down
- On the weekly(decision) chart the indicators are looking reasonable for going short.
- The Ichimoku is meeting all the conditions.
- The MACD is in positive area but weakening very strong and almost entering into negative area.
- The Parabolic SAR is short but not showing the preferred pattern of lower stop loss on opening of new long and short positions..
Daily chart: Down
- On the daily(timing) chart the indicators are looking strong for going short.
- The Ichimoku is meeting all the conditions.
- The MACD is in negative area and looking strong.
- The Parabolic SAR is short showing the preferred pattern of lower stop loss on opening of new long and short positions.
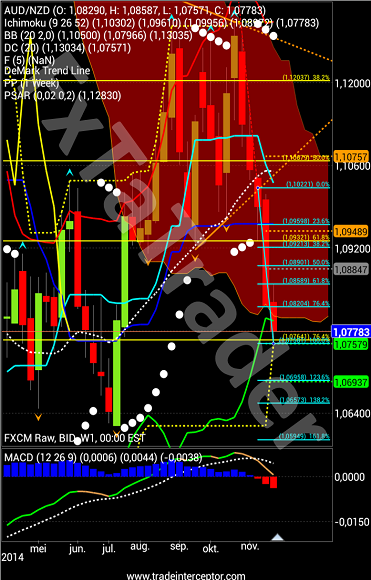
AUD/NZD Weekly chart
_______________________________________________________
Possible positions for coming week
AUD/USD
This pair will also be analyzed briefly, for more information read the article Review Hybrid Grid Strategy Wk 45&46 The pair looks interesting in the last few weeks for going short. The pair is still meeting all the conditions in the Weekly and Daily chart and remains interesting in the coming week for taking positions. With the new recent low made last week and the indicators in the Weekly and Daily chart being bearish it seems as if the downtrend will continue in the coming week.
- In the daily chart the Ichimoku is meeting all the conditions.
- The MACD is in negative territory and gaining strength.
- The Parabolic SAR is short and showing the preferred pattern of lower stop loss on opening of new long and short positions.
Rank: 2
Rating: - - -
Total outlook: Down
_______________________________________________________
Monthly review evaluation account
The longer term strategy does not differ much from the current strategy used on the daily chart. There are 3 important differences which are:
- The timing chart is the weekly instead of the daily and the decision chart is the monthly instead of the weekly. There is no context chart.
- There is also more emphasis on taking carry trades because positions will be held longer.
- The profit target is 1/4 ATR of the monthly chart instead of the weekly.
The longer term strategy uses the monthly chart for decision taking and the ATR from it for the profit target. One of the reasons for using a longer term strategy is the larger profit target. However the stop loss is also larger so the strategy will work similar to the Daily strategy except that less trades will be made and they will be held longer. The advantage of this is also that some pairs that cannot be traded Intra Week may very well be traded Intra Month. A good actual example are the JPY pairs. At the moment most of the JPY pairs are above the Upper Bollinger Band in the Weekly chart and for that reason looking overbought based on Intra Week trading. However, when looking at Intra Month trading the NZD/JPY is looking fine being below the Upper Bollinger Band. The Monthly Ranking and Rating list, see here below, has been fine tuned for this purpose and it is still being evaluated.
After using the Weekly Ranking and Rating list for a while on the longer term strategy it seemed that the match is not really there. The list is generated using also the 4H chart and this has no relevance with the longer term strategy. A similar Ranking and Rating list has been generated where the 4H chart is not used. This ranking and rating list, together with the Currency score which will also be generated based on the same input, will be used for decision making on a longer time frame. It will be provided once a month, the list is given below:
_______________________________________________________
Although the explanation may seem simple and clear there is always risk involved. I added a disclaimer to my blog for this purpose. If you like to use this article then mention the source by providing the URL FxTaTrader.com or the direct link to this article. Good luck in the coming week and don't forget to check my weekly Forex "Ranking and Rating list" and the "Currency Score".
_______________________________________________________
DISCLAIMER: The articles are my personal opinion, not recommendations, FX trading is risky and not suitable for everyone.The content is for educational purposes only and is aimed solely for the use by ‘experienced’ traders in the FOREX market as the contents are intended to be understood by professional users who are fully aware of the inherent risks in forex trading. The content is for 'Forex Trading Journal' purpose only. Nothing should be construed as recommendation to purchase any financial instruments. The choice and risk is always yours. Thank you.


")
![[iVISTscalp5]: TSI — Timing Strength Index](https://c.mql5.com/6/1015/splash-preview-772243.png "[iVISTscalp5]: TSI — Timing Strength Index")
![[XAUUSD]: Weekly Liquidity Activation Points (LAP), July 6 - July 10, 2026](https://c.mql5.com/6/1015/splash-preview-772241.png "[XAUUSD]: Weekly Liquidity Activation Points (LAP), July 6 - July 10, 2026")