
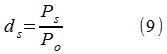
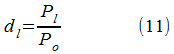
Market Theory

Introduction
Market is a mechanism of commodity-money relations that operates according to relevant laws, connects buyers (demand representatives) and sellers (supply representatives), and forms buy/sell prices. The price acts as a main landmark for the market relations. It holds (in accordance with the labour theory of value) the monetary value of goods as a product of labour [1].
In general, three types of markets can be distinguished:
Monopolistic competition with open pricing based on the price competition, the so-called competitive market. In this market seller's income is decreased with the increase of goods' sales price, and vice versa. The income elasticity coefficient from the sales price is always negative, and the profit varies with the change of sales price following the complex pattern. This market type is common for various goods and services markets.
Perfect competition where sellers are not in position to change the goods' sales price due to a high competition among sellers. Any attempts to change the price force the participant to exit the market. This type is most common for wholesale markets.
Monopolistic market where a seller or a group of sellers have an opportunity to set the goods' sales price that is most profitable for them. Their revenue and profit is increased according to the increase of goods' sales prices, and, therefore, the elasticity coefficient in such markets is always positive.
The researchers felt that the price has a paramount role in the market management mechanism, which is known as 3 axioms of Dow Theory [2]. It still remains unknown, how the price manages to control the market mechanism and form its sole correct value as a market price level that shapes the market in a wonderful and mysterious manner that is not yet understood.
The goals of this article are:
Discover the role of price in the market management mechanism based on the principle of balancing interests of its participants to ensure market stability.
Identify the types, formation nature, reasons of appearance and the extent of interaction between different levels of real and virtual market prices.
Identify the market type by the nature of changing the current price and by learning the mechanism of their interconversion.
Establish a common pattern between the market of services and goods and the Forex market.
Find out the reasons of formation and change of trends.
Generate signals for market entry and exit.
Establish the principle of the Forex market operation.
Study the relevance and potential of applying the market theory conclusions in order to create and use various indicators and Expert Advisors for trading.
We are going to begin the development of the market theory by identifying the interests of its participants. It is natural to assume that the market participants are driven by the opportunity to gain profit or other benefits to satisfy their material and spiritual needs. Therefore, we will choose it as a factor for maintaining the balance of interests for all sides of the market — both sellers and buyers. Since in the market conditions profit mainly depends on the goods' sales price, first we are going to identify this dependence.
Dependence of return on the goods' sales price
Generally, in order to calculate the return (R), all types of costs (C) (variable (Cv) and fixed costs (Cf)) are deducted from total sales (S):
![]()
As simple and obvious this formula may be, it also includes the dependence from the goods' sales price (Ps) in the implicit form, which complicates the analysis, if Ps changes. Let's try to obtain the dependence of return on the sales price in the explicit form.
We know that in the market conditions the dependence of the quantity of sold goods (Q) on the sales price (Ps) can be expressed with the hyperbole equation that reflects the law of supply and demand:
![]()
By multiplying both parts of the equation by Ps, we obtain the dependence of total sales (St) on sales price (Ps), and since QPs = S, then:
![]()
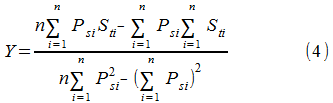
Therefore, in the market conditions the dependence of total sales (St) on the sales price (Ps) is linear, and now the coefficients in equations (2) and (3) acquire a clear physical meaning, namely, the S coefficient is the maximum virtual sale achieved by the unlimited decrease of Ps to its insignificant values, and it indirectly reveals the potential market demand for these goods. We will mark Y coefficient as the elasticity of total sales from the goods' sales price, which numerically reveals the change of total sales when the goods' sales price changes by unit in the payment currency of goods' price.
Obviously, if there is a competition in market conditions, the elasticity always holds a negative value, i.e. Y ≤ 0 and the increase of sales price (Ps) by unit leads to the decrease of total sales by Y units in the payment currency of goods' price and, vice versa, the decrease of sales price (Ps) by unit leads to the increase of total return by Y units.
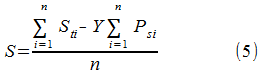
If there is an actual data array consisting of n sets of Ps and St values, numerical values of Y elasticity and virtual S sales are defined using the method of least squares:
Now, if we zero out the equation (3), we will find the limit realization price (Pl) above which goods can't be sold on this market because it exceeds the allowable value, and goods lose their attractiveness to buyers:
![]()
We will introduce the concept of the competition level (C) on the analyzed market and determine its numerical value as the ratio of difference between the sales price and the original price (Po) (its buy price and the production cost) towards the difference between the limit realization price (Pl) and the original price (Po):
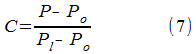
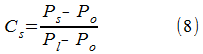
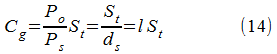
For example, the current or actual level of competition Cs on the market at the sales price (Ps) is calculated accordingly:
Let's introduce the degree of excess Ps sales price (ds) the original price (Po) and the degree of limit realization price (dl):
![]()
![]()
![]()
![]()
where:


![]()
where:
![]()
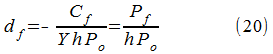
The impact of fixed costs (Cf) on the return will be considered with the coefficient of fixed expenses (df) calculated accordingly:
![]()
![]()
where:
![]()
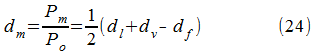
Let's introduce the market price (Pm), which will be defined numerically using the dm market coefficient as follows:
![]()
where:
Now, if we introduce the concept of optimal realization price (Popt) that guarantees the maximum return (Rmax), the equation (1) becomes a formula to determine the return (R) at any values of sales price (Ps):
![]()
If we zero out the first derivative from (25) by Ps, we will obtain the ratio to determine Popt:
The concept of an optimal level of exceeding the realization price (dopt) is entered here:
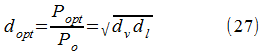
By placing the Ps=Popt in (25), we will get the form to define the maximum return:
![]()
If we zero out the return formula (25), we will obtain the ratio to determine two break-even points P1 and P2 as solutions to the obtained quadric equation:
![]()
![]()
or:
![]()
![]()
![]()
![]()
![]()
![]()
![]()
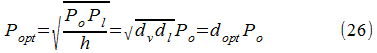
By comparing (25) and (35) we get:
![]()
![]()
Therefore, the market price (Pm) is an arithmetic average, and the optimal realization price (Popt) is a geometric average price value corresponding to two break-even points.
A French mathematician Louis Cauchy (1789-1857) proved that the arithmetic average of two non-negative numbers is no less than their geometric average, and equality can only be achieved when P1=P2:
![]()
Therefore, the optimal realization price of goods (Popt) is always less than the established market price (Pm) depending on the existing competition level, actual values of fixed and variable costs based on the ratio (24):
![]()
![]()
Now the ratio for defining the maximum return (28) becomes:
![]()
In general, the price hierarchy on the market is built as follows:
![]()
The general break-even point (Pg) occurs when meeting the conditions:
![]()
Based on (23), (24), (26), (27) and (39) we conclude that the following inequation is always valid on the market:
![]()
By solving the inequation (45) towards Po we come to conclusion that to get the return in the current market conditions, the buy price or the regular price (Pr) of goods shouldn't exceed its maximum value Pol:
![]()
![]()
![]()
By solving the inequation (28) towards the fixed costs (Cf), we discover that they are limited by the ratio:
![]()
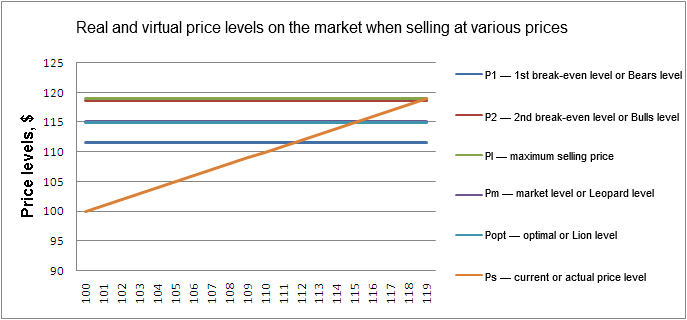
Real and virtual price levels on the market
According to the analyzed theory, multiple real and virtual price levels are formed and operate on the market. Let's list them and give a short description to all the price levels.
Real price levels:
Po — buy price or production price (cost price) of goods;
Pol — maximum buy price — when exceeded, the return from reselling it on the market can't be obtained, defined by ratios (46) - (48);
Pv — buy price provided variable expenses are present, defined by (21) and (22);
Pfc = df*Po — price of fixed costs provided variable expenses are present, defined by (20);
Ps — sales price of goods.
Virtual price levels:
P1 — first break-even or non-profit level, calculated as (30-34);
Popt — optimal price level that allows to obtain a maximum profit when selling goods at this price, in some circumstances may become a global break-even level, for example, when reaching maximum variable value and/or fixed costs, calculated as (26);
Pm — average market price, calculated as (23-24);
P2 — second break-even or non-profit level, calculated as (30-34);
Pl — maximum sell price — when exceeded, goods on the market can't be sold, calculated as (6).
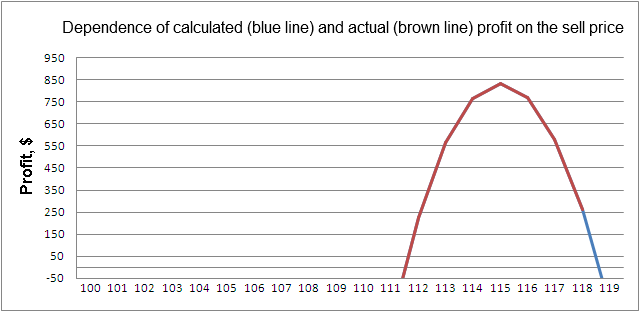
Approbation of theory conclusions using the example of selling goods on the market
We will use values of price levels and matching of actual and estimated return values as an example, and make sure how accurately the algorithm, which currently analyses the Forex market, describes and analyses the situation of the trading process on the real market of goods and services based on the example of the single entrepreneur analysis.
Supposedly, the entrepreneur has purchased the goods at the price Po=100 dollars per unit in order to resell them on the market (in the shop, supermarket etc.). During the first day of trading, while selling goods at the price Ps1=112 dollars per unit, he gained profit of St1=59300 dollars. On the second day he increased the sales price to Ps2=118 dollars and his return amounted to only St2=8800 dollars. Variable costs, including taxes, account for 10% from the income, and fixed costs are located at the level of Cf=200 dollars daily.
We have to determine the entrepreneur's return (R) for two trading days, break-even points P1 and P2, maximum values of goods' buy price (Pol), variables (Cv) and fixed costs (Cf) that after being exceeded cease profit gaining, and also to analyze the market in order to determine the optimal sales price of goods (Popt) that guarantees maximum profit (Pmax).
This is how the problem is solved by the algorithm, which after being analyzed will leave no doubts that the real market theory has been actually discovered:
| Po | Price | Ps | St | Cg | v | Cv | Cf | R | P1 | Popt | Pm | P2 | Pl | R(Ps) |
|---|---|---|---|---|---|---|---|---|---|---|---|---|---|---|
| 100 | Ps1 | 112 | 59200 | 52857 | 0.1 | 5920 | 200 | 222.86 | 111.5020 | 115.0109 | 115.0661 | 118.6302 | 119.0476 | 222.86 |
| 100 | Ps2 | 118 | 8800 | 7458 | 0.1 | 880 | 200 | 262.37 | 111.5020 | 115.0109 | 115.0661 | 118.6302 | 119.0476 | 262.37 |
| 100 | P1 | 111.5020 | 63383 | 56845 | 0.1 | 633.83 | 200 | 0 | 111.5020 | 115.0109 | 115.0661 | 118.6302 | 119.0476 | 0 |
| 100 | Popt | 111.0109 | 33908 | 29483 | 0.1 | 339.08 | 200 | 834.79 | 111.5020 | 115.0109 | 115.0661 | 118.6302 | 119.0476 | 834.79 |
| 100 | P2 | 118.6302 | 3506 | 2955 | 0.1 | 350.6 | 200 | 0 | 111.5020 | 115.0109 | 115.0661 | 118.6302 | 119.0476 | 0 |
| 100 | Pl | 119.0476 | 0 | 0 | 0.1 | 0 | 200 | -200 | 111.5020 | 115.0109 | 115.0661 | 118.6302 | 119.0476 | -200 |
| Pol=103.9723 | Popt | 117.2730 | 14907 | 13216 | 0.1 | 149.07 | 200 | 0 | 117.2730 | 117.2730 | 117.2730 | 117.2730 | 119.0476 | 0 |
| 100 | Popt | 120.9134 | -15672 | -12961 | 0.1857 | -2911 | 200 | 0 | 120.9134 | 120.9134 | 120.9134 | 120.9134 | 119.0476 | 0 |
| 100 | Popt | 115.0109 | 33908 | 29483 | 0.1 | 339.08 | 1034.79 | 0 | 115.0109 | 115.0109 | 115.0109 | 115.0109 | 119.0476 | 0 |
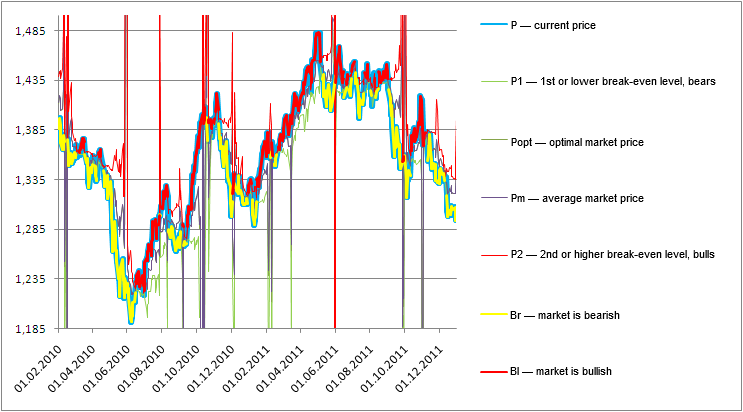
Testing the theory on real Forex market data
Let's look at the market theories that are most well-known among traders who try to use them in order to gain a statistic advantage when organizing profitable trading and creating profitable trading strategies on the Forex market based on them. There are three main theories:
Gann Theory is a product of practical study of the model, price and time ratios and their influence on the market.
Elliott Wave — through practical research Mr. Elliott came to the conclusion that any trend consists of the same repeated basic models (sections) that are divided into two types:
a) impulse section ("Impulse") that consists of 5 segments and acts as a moving section with a trend development;
b) corrective section ("Correction") that consists of 3 segments and compensates for the previous impulse movement.Strategy based on the Ichimoku Indicator — associated with "Ichimoku cloud" which is a product of the author's practical research of 30 years.
They all have a common feature — the absence of a strong theoretic base showing the real connection to the process of real trading with goods and services. These theories are the result of practical investigations and assumptions of their authors. Furthermore, they are connected with a united idea, namely, the understanding that along the price movement there are some levels and powers affecting its pattern, and the authors have devoted their lives to the frantic search for regularities of forming the indicated levels and forces.
Applying indicated theories in the trading practice led to variable success, however, due to the lack of more reliable theories, the researchers aimed only at the positive results, regardless the convention of their application and the actual money loss, explaining this as the "wrong" interpretation on the trader's side or presenting it as the disadvantages of one or the other theory.
I am trying to convey the essence of the new market theory that doesn't have any disadvantages listed above. This theory is based on a strong theoretical foundation, with equal elegance it describes the process of real trading of goods and Forex trading on the basis of price interaction between three virtual price levels, that the brightest men dedicated their lives to find, but, unfortunately, never succeeded.
These are the levels:
Current price level that can become bullish or bearish, depending on the situation. When the market is bullish, the price becomes bearish, and vice versa.
Virtual price level is formed by the market, and, like the current price, may turn bullish and bearish, depending on the circumstances.
Virtual managing level of the optimal market price — lion level.
Virtual managing level of the average market price — leopard level.
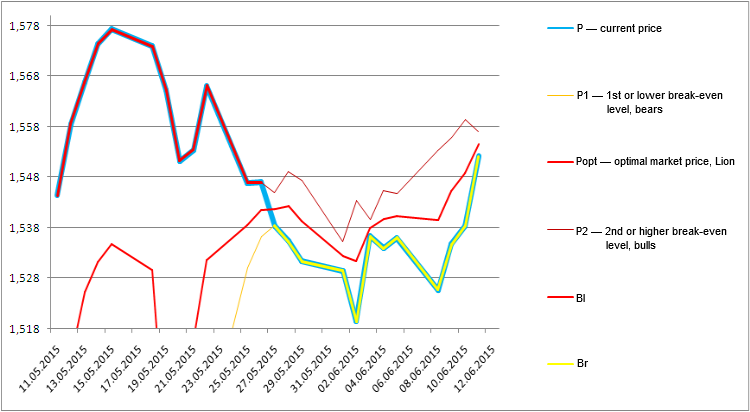
The figure shows real and virtual price levels based on the considered market theory over the years 2010 and 2011:
Indicator concept based on the new market theory and principles of market entry and exit
To create an indicator you need to bear in mind that it must clearly show the market condition at any time, namely the bear market and the bull market, the pattern of market price and line level movement, the change in trend, whether peaceful or showing strife between bulls and bears. The indicator must clearly indicate the moments and levels of the market entry and exit based on the principle:
- bulls manage the market — buy;
- bears manage the market — sell;
- lions manages the market — beyond market.
The future indicator will look according to the charts below.
Market condition on 11.06.2015 00:00 Moscow, EURUSD; recommendation to buy, since bulls are leading the market:
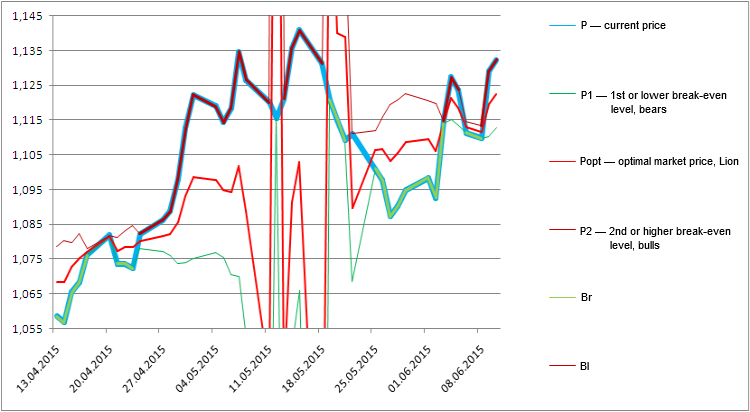
Levels of real and virtual market prices at this moment:
| P = P2 (Bull) | Popt (Lion) | Pm (Leopard) | Pvmp = P1 (Bear) |
|---|---|---|---|
| 1,13229 | 1,12255439 | 1,1225962 | 1,11290249 |
GBPUSD. All levels will be able to gather at the lion level shortly. Until the situation is cleared, it is recommended to buy:
| P (P2, Bull) | Popt (Lion) | Pm (Leopard) | Pvmp (P1, Bear) |
|---|---|---|---|
| 1,557067 | 1,5546163 | 1,5546183 | 1,55217 |
Conclusion
The proposed market theory is based on the pattern analysis for gaining profit, depending on the sales price of goods. It was discovered that by analyzing the market condition, we can estimate the maximum virtual return that indirectly reflects the market demand in these goods, and the elasticity of return towards the sales price which allows to evaluate the maximum level of goods' sales price on the market, named the "market level".
As established, a virtual optimal level of goods' sales price, presented as a geometric value of two break-even levels that allows to obtain the maximum profit when setting the sales price at this estimated level, is formed on the market. Furthermore, it was revealed that the income formation is also influenced by the virtual level of the average market price, which is formed on the market and represents the average value of two break-even levels. This level was called the "leopard level".
Based on the market condition analysis from the perspective of necessity to organize the trading process around the specific price levels on the market, the following was revealed:
The best results on the real market of goods and services are achieved through organizing trading around the optimal level of the goods' sales price, named the "lion level", which guarantees the maximum return. Commercial organizations may use this article as a guideline for optimizing the trading process.
Apart from the real level of actual price, 3 more virtual levels — market, lion and leopard levels — are formed on the Forex market. Price and market levels oppose each other and can take turns to become bullish and bearish.
When trading on the Forex market is organized around the first lower break-even level, the price turns bearish and aims to take this level — the market downtrend occurs, and the market level becomes bullish, and vice versa, when it is convenient to organize trading around the second upper break-even level, the price becomes bullish in the attempt to stay at this level, thus the uptrend is formed, and the market level turns bearish. These metamorphoses are organized and managed by the virtual lion and leopard levels.
Trading on the Forex market can be organized around the third global break-even level — the lion level, only in exceptional cases. This situation is accompanied with a severe flat market.
Normally, there are two ways the trend changes:
a) at any moment and any price level by a sharp intervention of the managing levels of lion and leopard in the process of trading with the consequent transfer of the price management to the opposite side and/or the consequent struggle of the opposing sides: current price formed by sellers and buyers against the unpredictable market;
b) voluntary transfer of the price management from bulls to bears on the lion level.
References
Translated from Russian by MetaQuotes Ltd.
Original article: https://www.mql5.com/ru/articles/1825
 Graphical Interfaces I: Preparation of the Library Structure (Chapter 1)
 MQL5 for beginners: Anti-vandal protection of graphic objects
 Graphical Interfaces I: Form for Controls (Chapter 2)
- Free trading apps
- Over 8,000 signals for copying
- Economic news for exploring financial markets
You agree to website policy and terms of use
Excelent idea.
The approach outlined in the article, as it seems to me, works only on large time intervals and for significant price changes. It will not help us, small traders, to determine price levels on the scales we are interested in.
The situation was somewhat similar in the "from theory to practice" thread - the analysis was based on huge samples of the price series, and the result of trades depended on much smaller samples. It turned out that the price outliers fell out of the analysis, but strongly influenced the results of real trading.
As justification, I will give an excerpt from A.G. Shulgin's manual "Exchange rate and international finance":
As is known, there are two approaches to the consideration of foreign exchange (In principle, both approaches do not contradict each other: the first one studies a rather long-term period of time, the second one deals with short-term dynamics of the exchange rate).
1. Currency as a commodity. If we consider foreign currency as a commodity, then it is necessary to analyse the supply and demand of this commodity by means of elasticities of supply and demand curves. Such consideration of currency was prevalent in the past, when the movement of capital between countries was practically impossible and the main reason for buying/selling foreign currency was export-import operations. We will study the main ideas of this approach in the topic "Purchasing Power Parity".
2. Currency as an asset. If we consider foreign currency as a financial asset, we cannot apply the elasticity approach, because for financial assets the elasticity of supply and demand is very unstable, in other words, it is not applicable for analysis. In order to analyse currency as an asset, we will have to use the tools of return and risk analysis. Modern studies show that in countries with high capital mobility and floating exchange rates (which are practically all developed countries of Europe, America, and in the near future Russia) the volatility of foreign currency exchange rate is close to the volatility of the main financial market instruments (stocks and bonds). The volumes of buying/selling foreign currency to purchase foreign financial assets far exceed the volumes of export-import operations. It is with the consideration of this approach that we will begin our presentation of the exchange rate theory.
Hi all, I am like from the "every man for himself" section, I am fond of reading "open interest" in the "Quickstrike" application from CME, I calculate the optimal favourable price for the dealer, there are contracts of "small speculator" and "large speculator", I noticed that the dealer always looks for the optimal price between put and call contracts from small speculators, apparently to pay less money, but if a contract from a large speculator comes, he pushes it deeply,the dealer is always looking for the optimal price between put and call contracts of small speculators, apparently to pay less money, but if a contract from a large speculator comes, he pushes it deep "into the money", I mean in the area where contracts of small speculators are concentrated,and when calculating their forward price and premiums and when a contract of a large speculator appears, so-called support and resistance levels are formed, support means they will not push a small speculator "into the money", resistance means the contract of a large speculator will not let the price go higher and we will crash under expiry, I notice good volatility on the market just under expiry of weekly and monthly contracts, here I have a question for everyone who is here, naive, naive, am I talking rubbish and nonsense here? Or are you wandering in the wrong woods?