
Learn how to design a trading system by MFI

Introduction
This article continues our series about how to design simple trading systems based on the most popular technical indicators to help us learn MQL5 coding. In this new article, we will have a look at the new technical indicator called the Money Flow Index (MFI). We will learn this indicator in detail and find out how to develop a simple trading system based on the main concept behind it. So we will cover this indicator through the following topics:
If you read other articles from the series, you can find that it has the same arrangement of topics with new information about the indicator and some new codes as per mentioned new strategies to try to learn new concepts about trading and MQL5 coding. We will learn what is the MFI indicator, what it measures and how we can calculate it manually to learn the main concept behind it. Then we will see an example of calculating the MFI indicator. Of course, these are only the basics. We need to learn a more important topic about how to use it in simple strategies considering the basic concept behind it. After that, we will design a step-by-step blueprint for every mentioned strategy to help us design a trading system for them. The most interesting topic is finding out how we can create a trading system for these strategies by means of MQL5 to use them in MetaTrader 5 trading platform.
In order to be able to create your own trading system based on your winning trading strategy, I advise you to do the entire coding by yourself. Do not be satisfied by only reading but apply what you read and code every single code by yourself. It will be better to search for functions and programming concepts to know more about them as this will help you know more and more. Do not forget that one of the most important skills of any successful programmer is knowing how to search effectively in addition to practice as these two things are very important in any learning or development process.
Also, you have to test any strategy before using it, especially if its main purpose is educational. There is no strategy that is suitable for all people. So, what may be useful for me, might not be useful for you.
Through this article, we will use the MetaQuotes Language (MQL5) to write codes of strategies in MetaEditor built into MetaTrader 5. If you want to know how to download it and use MetaEditor, read the Writing MQL5 code in the MetaEditor topic from the previous article.
Disclaimer: All information is provided 'as is' only for educational purposes and is not meant for trading purposes or advice. The information does not guarantee any kind of result. If you choose to use these materials on any of your trading accounts, you will do that at your own risk and you will be the only responsible.
Now let us go through our topics directly to learn a new tool to increase the number of tools in our trading suitcases.
MFI definition
In this section, we will describe the Money Flow Index (MFI) indicator in detail and have a look at the concept behind this indicator which is one of the volume-based indicators. We will learn what it is, plus what it measures, then we will learn how we can calculate it manually by analyzing an example.
As already mentioned in the previous article, volume is a vital factor in trading. Thorough volume analysis gives us an edge in trading since the market has many aspects that can affect it. The more aspects you unerstand, the better decisions you can make since the acquired knowledge increases the weight of evidence that guides you to a specific direction to make a certain decision.
If we have an asset experiencing heavy buying and selling, then that asset is of greater significancve compared to the one with lower amount of transactions. In financial markets, the volume is a number of shares or contracts traded during a period of time. It is good to see a high volume when the price breakes resistance during an uptrend or support during a downtrend as this is one of the important signs of the movement strength. It is better when the volume moves with the trend to rise during up movement and decline during a correction in the uptrend, as well as decline during a down movement and rise during a correction. If we see the volume move with the trend, this is one of the important signs confirming the current trend.
The Money Flow Index (MFI) indicator was created by Gene Quong and Avrum Soudack. It is a volume-based indicator but it uses the price and volume in its calculation to measure the buying and selling pressure. It moves between zero and 100. An increase in the MFI indicator means that there is buying pressure and vice versa, a decrease in the MFI means that there is selling pressure. It may confirm the trend direction or it may give a warning for reversals. If you want to know more about the trend, you can read the trend definition topic from one of the previous articles.
MFI manual calculation consists of multiple steps:
- Calculating the typical price (TP) = (high+low+close)/3
- Calculating the raw money flow = volume * TP
- Determining the movement of TP: up or down. If current TP > previous TP = up, if current TP < previous TP = down.
- Calculating 1+MF = raw MF of up periods
- Calculating 1-MF = raw MF of down periods
- Calculating 14 +MF = sum of 14 (1+MF)
- Calculating 14 -MF = sum of 14 (1-MF)
- Calculating 14 MF ratio = 14+MF / 14-MF
- Calculating MFI = 100-100/(1+MF ratio)
Let's see an example to apply this calculation if we have the following data for an instrument:
| Day | High | Low | Close | Volume |
|---|---|---|---|---|
| 1 | 55 | 53 | 54 | 12000 |
| 2 | 56 | 54 | 55 | 10000 |
| 3 | 61 | 59 | 60 | 15000 |
| 4 | 67 | 64 | 65 | 20000 |
| 5 | 63 | 58 | 60 | 10000 |
| 6 | 58 | 52 | 55 | 5000 |
| 7 | 64 | 58 | 60 | 7000 |
| 8 | 52 | 47 | 50 | 7500 |
| 9 | 52 | 48 | 48 | 8000 |
| 10 | 50 | 48 | 49 | 5000 |
| 11 | 49 | 47 | 48 | 6000 |
| 12 | 48 | 47 | 47 | 7500 |
| 13 | 50 | 46 | 48 | 9000 |
| 14 | 52 | 45 | 47 | 10000 |
| 15 | 55 | 46 | 49 | 7000 |
| 16 | 53 | 45 | 47 | 7500 |
| 17 | 51 | 43 | 46 | 6000 |
| 18 | 50 | 42 | 44 | 5000 |
| 19 | 50 | 43 | 45 | 15000 |
If we need to calculate the MFI indicator from the previous data, we will go through the following steps:
Calculate the typical price (TP) = (high+low+close)/3
And the following is for getting the TP after the calculation:

Calculate the raw money flow = volume * TP

Determine the movement of TP: up or down

Calculate 1+MF = raw MF of up periods
Calculate 1-MF = raw MF of down periods

Calculate 14+MF = sum of 14 (1+MF)
Calculate 14-MF = sum of 14 (1-MF)

Calculate 14 MF ratio = 14+MF/14-MF

Calculate MFI = 100-100/(1+MF ratio)

During the previous steps, we calculated the MFI indicator manually, but these days we do not need to do that. Now that we have learned the concept behind the indicator, we can use the built-in indicator in MetaTrader 5. All you need to do is choose it from the available indicators:
While opening the MetaTrader 5 --> click Insert tab --> Indicators --> Volumes --> Money Flow Index

The indicator parameters will appear after choosing the Money Flow Index:

1. Desired indicator period.
2. Volume type (Tick or Real).
3. MFI line color.
4. Line type.
5. MFI line thickness.
After clicking OK, MFI indicator is attached to the chart:

MFI strategy
In this section, we will learn how we can use the MFI indicator after we identified what it is, what it measures and the main concept behind it. Now, we will learn some simple strategies that can be used.
- Strategy one: MFI - OB and OS:
According to this strategy, we will identify the overbought (OB) and oversold (OS) areas. When the MFI approaches level 20, this will be an OS, and when it approaches the 80 level, this will be an OB. Oversold areas increase the potential of rising and, vice versa, the overbought areas increase the potential of declining.
So, we can say:
MFI <= 20 --> OS
MFI >= 80 --> OB
- Strategy two: MFI - uptrend - buy:
According to this strategy, we will wait to see MFI below or equal level 50 to see the buy signal is triggered. Approaching level 70 will be a take profit signal. The rationale behind this strategy is that most of the time, the MFI moves between 50 and 70 during an uptrend.
So,
MFI <= 50 --> Buy signal
MFI >= 70 --> Take profit signal
- Strategy three: MFI - downtrend - short:
This strategy will be the opposite of the previous one (MFI - uptrend - buy), because we need to see MFI above or equal level 50 to say that the sell signal is triggered and the take profit will be signaled when the MFI became below or equal to level 30. The rationale behind that is that most of the time, MFI moves between 50 and 30 levels during a downtrend.
So,
MFI >=50 --> Sell signal
MFI <= 30 --> Take profit
- Strategy four: MFI - uptrend or divergence:
According to this strategy, we need the indicator to confirm if the current move is strong or not. We can see that by comparing the current and previous MFI values and current and previous highs and see if there is a confirmation that the current move is strong or there is a divergence. So, during an uptrend, if the current MFI is greater than the previous MFI and the current high is greater than the previous high, this means that the current move is strong but if the current MFI is less than the previous one and the current high is greater than the previous high, this means that there is a bearish divergence as the indicator does not confirm the price movement. You can adjust the length of values to compare them which helps in understanding the concept.
So,
Current MFI > previous MFI and current high > previous high --> strong up move
Current MFI < previous MFI and current high > previous high --> bearish divergence
- Strategy five: MFI - downtrend or divergence:
This strategy is the opposite of the previous one (MFI - uptrend or divergence) as we need the indicator also to confirm if the current move is strong or if there is a divergence in its simple form by comparing only two values. So, if the current MFI is less than the previous one and the current low is less than the previous one, this means that the current down move is strong but if the current MFI is greater than the previous one and the current low is less than the previous one, this means that there is a bullish divergence.
Simply,
Current MFI < previous MFI and current low < previous low --> strong down move
Current MFI > previous MFI and current low < previous low --> bullish divergence
MFI strategy blueprint
In this section, we will design a blueprint for each strategy to help us when creating a trading system for each one of them but first we will design a blueprint for a simple trading system to be the base of all mentioned trading strategies. This simple system will display the MFI current value as a comment on the chart only. So, we need the computer to check the MFI value every tick and after that display this value on the chart as a comment. The blueprint to do that is shown below:

Now, we will design a blueprint for each strategy as follows:
- Strategy one: MFI - OB and OS:
Based on this strategy, we need to give instructions to the trading system to check the MFI value at every tick and compare this value to specific levels (20 and 80) and decide or return the result as a comment on the chart according to this comparison. If the MFI is less than or equal to 20, it returns oversold and current MFI value as comments on the chart and each comment in a separate line. If the MFI is greater than or equal to 80, it returns overbought and current MFI as comments on the chart and each one in a separate line. If the MFI is above 20 and below 80, it returns the MFI current value only. The blueprint to do that looks as follows:

- Strategy two: MFI - uptrend - buy:
According to this strategy, we need the trading system to check also the MFI value, 50, and 70 levels at every tick to decide if the MFI is less than or equal to 50, so it has to return the buy signal. If the MFI is greater than or equal to 70, it has to return a take profit signal and the following is the blueprint to do that:

- Strategy three: MFI - downtrend - short:
According to this strategy, we need the trading program to alert us with a generated signal based on a comparison between MFI, 50, and 30 values. If the MFI is greater than or equal to 50, it has to return a sell signal and if the MFI is less than or equal to 30, it has to return a take profit signal. The following is the blueprint for that:

- Strategy four: MFI - uptrend or divergence:
According to this strategy, we need to design a trading system able to check four values (current MFI, previous MFI, current high and previous high) every tick and decide which signal will be generated.
Current MFI > previous MFI and current high > previous high --> strong up signal
Current MFI < previous MFI and current high > previous high --> bearish divergence
The following is the blueprint to do that:

- Strategy five: MFI - downtrend or divergence:
This strategy is the opposite of the previous one. According to it, we need to design a trading system able to check four values (current MFI, previous MFI, current Low and previous Low) every tick and decide which signal will be generated.
Current MFI < previous MFI and current low < previous low --> strong down signal
Current MFI > previous MFI and current low < previous low --> bullish divergence
The following is the blueprint to do that:

MFI trading system
In this interesting section, we will design a trading system for each mentioned strategy by writing our codes in MQL5 to execute them in MetaTrader 5. We will start with the simple MFI that generates a comment on the chart with the MFI current value.
- Create an array for MFI by using the 'double' function to represent values with fractions.
double MFIArray[]; - Sort the MFI array from the current data by using the ArraySetAsSeries function to return a boolean result (true or false) and its parameters are (array[] and flag).
ArraySetAsSeries(MFIArray,true);
- Define MFI by using the iMFI function after creating an integer variable for MFIDef. The iMFI function returns the handle of the MFI indicator and its parameters are (symbol, period, ma period and applied volume).
int MFIDef=iMFI(_Symbol,_Period,24,VOLUME_TICK);
- Fill the array by using the CopyBuffer function to get data from the MFI indicator.
CopyBuffer(MFIDef,0,0,3,MFIArray);
- Calculate the current MFI value by using NormalizeDouble to return a double type value after creating a double variable MFI value.
double MFIValue=NormalizeDouble(MFIArray[0],5);
- Create a comment on the chart by using the Comment function.
Comment("MFI Value is: ",MFIValue);
So the full code will be the same as the following:
//+------------------------------------------------------------------+
//|                                                   Simple MFI.mq5 |
//|                                  Copyright 2022, MetaQuotes Ltd. |
//|                                             https://www.mql5.com |
//+------------------------------------------------------------------+
#property copyright "Copyright 2022, MetaQuotes Ltd."
#property link      "https://www.mql5.com"
#property version   "1.00"
//+------------------------------------------------------------------+
void OnTick()
  {
//Create an array for MFI
   double MFIArray[];

//sorting the array from the current data
   ArraySetAsSeries(MFIArray,true);

//defining MFI
   int MFIDef=iMFI(_Symbol,_Period,24,VOLUME_TICK);

//filling the array
   CopyBuffer(MFIDef,0,0,3,MFIArray);

//calculating current MFI value
   double MFIValue=NormalizeDouble(MFIArray[0],5);

//creating a comment with MFI value
   Comment("MFI Value is: ",MFIValue);
  }
//+------------------------------------------------------------------+
After compiling, we can find the Expert Advisor in the Navigator window:

By double-clicking, the following window will appear:

After clicking OK, the EA is attached to the chart:

The following is an example of generated signal from testing:

If we want to make sure that the generated MFI value is the same as the MFI value of the built-in indicator:

- Strategy one: MFI - OB and OS:
The following is the full code for creating a trading system for this strategy:
//+------------------------------------------------------------------+
//|                                                  MFI - OB&OS.mq5 |
//|                                  Copyright 2022, MetaQuotes Ltd. |
//|                                             https://www.mql5.com |
//+------------------------------------------------------------------+
#property copyright "Copyright 2022, MetaQuotes Ltd."
#property link      "https://www.mql5.com"
#property version   "1.00"
//+------------------------------------------------------------------+
void OnTick()
  {
   //Create an array for MFI
   double MFIArray[];

   //sorting the array from the current data
   ArraySetAsSeries(MFIArray,true);

   //defining MFI
   int MFIDef=iMFI(_Symbol,_Period,24,VOLUME_TICK);

   //filling the array
   CopyBuffer(MFIDef,0,0,3,MFIArray);

   //calculating current MFI value
   double MFIValue=NormalizeDouble(MFIArray[0],5);


   //Conditions of OS&OS
   //OS
   if(MFIValue<=20)
   {
   Comment("Oversold","\n","MFI value is : ",MFIValue);
   }

   //OB
   if(MFIValue>=80)
   {
   Comment("Overbought","\n","MFI value is : ",MFIValue);
   }

   //no signal
   if(MFIValue>20 && MFIValue<80 )
   {
   Comment("MFI value is : ",MFIValue);
   }
  }
//+------------------------------------------------------------------+
The difference at this code is:
Conditions of oversold and overbought://Conditions of OS&OS //OS if(MFIValue<=20) { Comment("Oversold","\n","MFI value is : ",MFIValue); } //OB if(MFIValue>=80) { Comment("Overbought","\n","MFI value is : ",MFIValue); } //no signal if(MFIValue>20 && MFIValue<80 ) { Comment("MFI value is : ",MFIValue); }
After compiling this code, we will find the EA in the Navigator window:

Drag and drop it on the chart to open its window:

After clicking OK, it is attached to the chart:

The following is an example of generated signals according to this trading system.
Oversold signal:

Overbought signal:

No signal:

- Strategy two: MFI - uptrend - buy:
The following is for how to write the code of this strategy:
//+------------------------------------------------------------------+
//|                                          MFI - Uptrend - Buy.mq5 |
//|                                  Copyright 2022, MetaQuotes Ltd. |
//|                                             https://www.mql5.com |
//+------------------------------------------------------------------+
#property copyright "Copyright 2022, MetaQuotes Ltd."
#property link      "https://www.mql5.com"
#property version   "1.00"
//+------------------------------------------------------------------+
void OnTick()
  {
   //Create an array for MFI
   double MFIArray[];

   //sorting the array from the current data
   ArraySetAsSeries(MFIArray,true);

   //defining MFI
   int MFIDef=iMFI(_Symbol,_Period,24,VOLUME_TICK);

   //filling the array
   CopyBuffer(MFIDef,0,0,3,MFIArray);

   //calculating current MFI value
   double MFIValue=NormalizeDouble(MFIArray[0],5);


   //Buy signal
   if(MFIValue<=50)
   {
   Comment("Buy signal");
   }

   //TP
   if(MFIValue>=70)
   {
   Comment("Take profit");
   }
  }
//+------------------------------------------------------------------+
The difference with this code:
Conditions of signals:
Buy signal:
//Buy signal
   if(MFIValue<=50)
   {
   Comment("Buy signal");
   }
Take profit signal:
//TP
   if(MFIValue>=70)
     {
      Comment("Take profit");
     }
After compiling, the EA will appear in the Navigator window:

The EA window will be the same as the following:

After clicking OK, it is attached to the chart:

The following is an example of generated signals from testing:
Buy signal:

Take profit signal:

- Strategy three: MFI - downtrend - short:
The following is the full code to create a trading system for this strategy:
//+------------------------------------------------------------------+
//|                                      MFI - Downtrend - Short.mq5 |
//|                                  Copyright 2022, MetaQuotes Ltd. |
//|                                             https://www.mql5.com |
//+------------------------------------------------------------------+
#property copyright "Copyright 2022, MetaQuotes Ltd."
#property link      "https://www.mql5.com"
#property version   "1.00"
//+------------------------------------------------------------------+
void OnTick()
  {
//Create an array for MFI
   double MFIArray[];

//sorting the array from the current data
   ArraySetAsSeries(MFIArray,true);

//defining MFI
   int MFIDef=iMFI(_Symbol,_Period,24,VOLUME_TICK);

//filling the array
   CopyBuffer(MFIDef,0,0,3,MFIArray);

//calculating current MFI value
   double MFIValue=NormalizeDouble(MFIArray[0],5);


//Sell signal
   if(MFIValue>=50)
     {
      Comment("Sell signal");
     }

//TP
   if(MFIValue<=30)
     {
      Comment("Take profit");
     }
  }
//+------------------------------------------------------------------+
The difference at this code is:
Conditions of signals:
Sell signal:
//Sell signal
   if(MFIValue>=50)
     {
      Comment("Sell signal");
     }
Take profit signal:
//TP
   if(MFIValue<=30)
     {
      Comment("Take profit");
     }
After compiling, we can execute it by double-clicking from the Navigator:
After double-clicking, its window will be the same as the following:

After clicking OK, it is attached to the chart:

The following is an example of generated signals based on the MFI - downtrend - short strategy from testing:
Sell signal:

Take profit signal:

- Strategy four: MFI - uptrend or divergence:
The following is the full code of the MFI - uptrend or divergence strategy from testing:
//+------------------------------------------------------------------+
//|                                  MFI - Uptrend or divergence.mq5 |
//|                                  Copyright 2022, MetaQuotes Ltd. |
//|                                             https://www.mql5.com |
//+------------------------------------------------------------------+
#property copyright "Copyright 2022, MetaQuotes Ltd."
#property link      "https://www.mql5.com"
#property version   "1.00"
//+------------------------------------------------------------------+
void OnTick()
  {
//Create arrays for MFI and price
   double MFIArray[];
   MqlRates PriceArray[];

//sorting arrays from the current data
   ArraySetAsSeries(MFIArray,true);
   int Data=CopyRates(_Symbol,_Period,0,3,PriceArray);

//defining MFI
   int MFIDef=iMFI(_Symbol,_Period,24,VOLUME_TICK);

//filling the MFI array
   CopyBuffer(MFIDef,0,0,3,MFIArray);

//calculating current and previous MFI values
   double MFICurrentValue=NormalizeDouble(MFIArray[0],5);
   double MFIPrevValue=NormalizeDouble(MFIArray[1],5);

//calculating current and previous highs
   double CurrentHighValue=NormalizeDouble(PriceArray[2].high,5);
   double PrevHighValue=NormalizeDouble(PriceArray[1].high,5);

//conditions of strong move or divergence
//strong up
   if(MFICurrentValue>MFIPrevValue&&CurrentHighValue>PrevHighValue)
     {
      Comment("Strong up move");
     }

//bearish divergence
   if(MFICurrentValue<MFIPrevValue&&CurrentHighValue>PrevHighValue)
     {
      Comment("Bearish divergence");
     }
  }
//+------------------------------------------------------------------+
The differences in this code are:
Creating arrays for MFI and prices by using the MqlRates function that stores price, volumes and spread information:
   double MFIArray[];
   MqlRates PriceArray[];
Sorting arrays:
For MFI, using the ArraySetAs Series function is the same as mentioned before.
For prices, using the CopyRates function to get historical data of MqlRates and its parameters are (symbol name, timeframe, start time, stop time and rates array).
   ArraySetAsSeries(MFIArray,true);
   int Data=CopyRates(_Symbol,_Period,0,3,PriceArray);
Calculating current and previous MFI values:
   double MFICurrentValue=NormalizeDouble(MFIArray[0],5);
   double MFIPrevValue=NormalizeDouble(MFIArray[1],5);
Calculating current and previous highs:
   double CurrentHighValue=NormalizeDouble(PriceArray[2].high,5);
   double PrevHighValue=NormalizeDouble(PriceArray[1].high,5);
Conditions of the MFI - uptrend or divergence strategy:
Strong up:
   if(MFICurrentValue>MFIPrevValue&&CurrentHighValue>PrevHighValue)
     {
      Comment("Strong up move");
     }
Divergence:
   if(MFICurrentValue<MFIPrevValue&&CurrentHighValue>PrevHighValue)
     {
      Comment("Bearish divergence");
     }
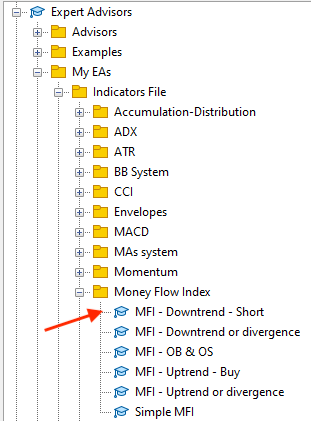
After compiling this code, we will find it also in the Expert Advisors in the Navigator:

The same applies to executing it. Drag and drop or double-click on it to open its window:

Then click OK to attach it to the chart:

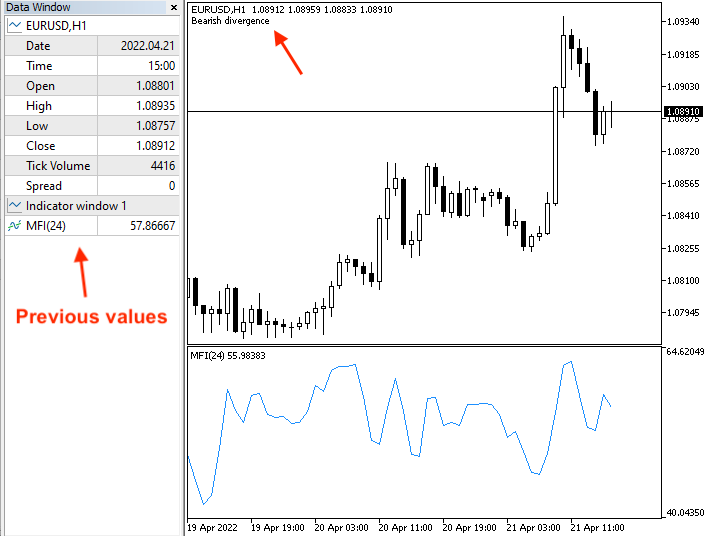
The following is an example of generated signals with the data window based on this strategy:
Strong up signal with current data window:

Strong up signal with previous data window:

Divergence signal with current data window:

Divergence signal with previous data window:
- Strategy five: MFI - downtrend or divergence:
The following is the full code of this strategy:
//+------------------------------------------------------------------+
//|                                MFI - Downtrend or divergence.mq5 |
//|                                  Copyright 2022, MetaQuotes Ltd. |
//|                                             https://www.mql5.com |
//+------------------------------------------------------------------+
#property copyright "Copyright 2022, MetaQuotes Ltd."
#property link      "https://www.mql5.com"
#property version   "1.00"
//+------------------------------------------------------------------+
void OnTick()
  {
//Create arrays for MFI and price
   double MFIArray[];
   MqlRates PriceArray[];

//sorting arrays from the current data
   ArraySetAsSeries(MFIArray,true);
   int Data=CopyRates(_Symbol,_Period,0,3,PriceArray);

//defining MFI
   int MFIDef=iMFI(_Symbol,_Period,24,VOLUME_TICK);

//filling the array
   CopyBuffer(MFIDef,0,0,3,MFIArray);

//calculating current and previous MFI values
   double MFICurrentValue=NormalizeDouble(MFIArray[0],5);
   double MFIPrevValue=NormalizeDouble(MFIArray[1],5);

//calculating current and previous highs
   double CurrentLowValue=NormalizeDouble(PriceArray[2].low,5);
   double PrevLowValue=NormalizeDouble(PriceArray[1].low,5);

//conditions of strong move or divergence
//strong down
   if(MFICurrentValue<MFIPrevValue&&CurrentLowValue<PrevLowValue)
     {
      Comment("Strong down move");
     }

//bullish divergence
   if(MFICurrentValue>MFIPrevValue&&CurrentLowValue<PrevLowValue)
     {
      Comment("Bullish divergence");
     }
  }
//+------------------------------------------------------------------+
The difference at this code:
Conditions of generated signals based on this strategy:
Strong down move signal:
   if(MFICurrentValue<MFIPrevValue&&CurrentLowValue<PrevLowValue)
     {
      Comment("Strong down move");
     }
Bullish divergence:
   if(MFICurrentValue>MFIPrevValue&&CurrentLowValue<PrevLowValue)
     {
      Comment("Bullish divergence");
     }
After compiling, the Navigator window looks as follows:

Upon execution, its window looks as follows:

After clicking OK, it is attached to the chart:

The following is an example of generated signals with the data window to display generated signals based on values from testing:
Strong down move with current data window:

Strong down move with previous data window:

Bullish divergence with current data window:

Bullish divergence with previous data window:

Conclusion
I have covered the topic of the Money Flow Index (MFI) indicator by giving new information that can enhance your trading since now we know what the volume is, why it is very important in trading, what the MFI indicator is, what it measures, in addition to learning how we can calculate it manually and insert the built-in MFI indicator to MetaTrader 5. After learning the basics of the MFI indicator and grasping the basic concept behind it, we learned some simple strategies: these are the overbought and oversold strategies which can reveal the overbought and oversold areas for an instrument, the MFI - uptrend strategy which can be used to detect buying and take profit signals during the uptrend based on the MFI indicator, the MFI - downtrend strategy which can be used to generate selling and take profit signals during the downtrend based on the MFI indicator, the MFI - uptrend or divergence strategy which can be used to confirm the strength of up movements during the uptrend or warn us of a bearish divergence, and the MFI - downtrend or divergence which can be used to confirm if the current down movements are strong or warn of a bullish divergence.
In addition to that, we have developed a blueprint for each strategy to help us create a trading system to generate signals automatically in the MetaTrader 5 by designing a step-by-step blueprint. After that, we created a trading system for each strategy by means of MQL5 to be executed in MetaTrader 5 trading platform to work automatically and accurately without human interference to ease our trading and save our time plus getting things done efficiently.
I hope that you tried to apply and practice what you learned through this article. I also hope that this article gave you useful insights about trading, be it insights related to the current topic or to any related topics. As I have already said, be sure to test any strategy before using it on a real account because the main objective of this article is to contribute to providing information for beginners to learn how to code simple trading strategies by themselves. So, you may find out that these strategies need optimization or adjustment or you may find that it will be better if you combine them with another technical tool. This is a useful approach to combining essential technical tools to reveal many perspectives to be able to take a suitable decision. After combining these tools, you can also create a trading system for them as we can find all types of trading systems, from simple to complicated ones, and this will let us do exactly what we need while overcoming the subjectivity issue which can be an obstacle to reach your trading goals. Programming is an amazing tool that helps us do what need easily, accurately and smoothly. It saves us from doing the same tasks every time in addition to many other good features.
If you find this article useful and you need to read more similar articles, you can read my other articles in this series about learning how you can design a trading system based on the most popular technical indicators. I hope, they will help you enhance your trading results.
Warning: All rights to these materials are reserved by MetaQuotes Ltd. Copying or reprinting of these materials in whole or in part is prohibited.
This article was written by a user of the site and reflects their personal views. MetaQuotes Ltd is not responsible for the accuracy of the information presented, nor for any consequences resulting from the use of the solutions, strategies or recommendations described.

 Data Science and Machine Learning (Part 04): Predicting Current Stock Market Crash
 Learn how to design a trading system by Volumes
 Learn how to design a trading system by Accumulation/Distribution (AD)
- Free trading apps
- Over 8,000 signals for copying
- Economic news for exploring financial markets
You agree to website policy and terms of use