Konstantin Chechnev / Profil
- Information
|
7+ Jahre
Erfahrung
|
18
Produkte
|
47
Demoversionen
|
|
0
Jobs
|
0
Signale
|
0
Abonnenten
|
────────────────────────
Ich entwickle Lösungen jeder Komplexität – von Indikatoren, Trading-Panels und Utilities bis hin zu mehrstufigen Analysesystemen, Expert Advisors, Optimierern und spezialisierten Werkzeugen für die Marktforschung.
Wenn sich eine Handels- oder Analyseidee formalisieren lässt, kann ich sie in ein vollständiges MetaTrader-Werkzeug umsetzen.
⚙️ 02 / WAS ICH ENTWICKELN KANN
────────────────────────
• Automatisierung von Handelsalgorithmen und Strategien;
• Indikatoren und Systeme zur Analyse von Marktdaten;
• Verarbeitung von Tickdaten, Kursströmen und Statistiken;
• Optimierung und Validierung von Handelsparametern;
• komplexe Benutzeroberflächen, Bedienfelder und Datenvisualisierung;
• individuelle Handels- und Analyselogik für konkrete Aufgaben.
🧩 03 / VON DER IDEE ZUM FERTIGEN PRODUKT
────────────────────────
Ich betreue das gesamte Projekt – von der Idee und mathematischen Logik über Architektur, Programmierung und Benutzeroberfläche bis hin zu Performance-Optimierung, Tests und einem einsatzbereiten Produkt.
Ein gutes Werkzeug ist mehr als nur funktionierender Code. Es muss schnell, verständlich, stabil und benutzerfreundlich sein und genau die Aufgabe lösen, für die es entwickelt wurde.
🧭 04 / ERFAHRUNG — MEHR ALS 7 JAHRE
────────────────────────
Seit mehr als 7 Jahren entwickle ich Software für MetaTrader und die Finanzmärkte.
In dieser Zeit hat sich meine Arbeit von kleinen Handelsalgorithmen zu komplexen Forschungs- und Analysesystemen entwickelt.
💬 05 / HABEN SIE EINE IDEE ODER EIN PROJEKT?
────────────────────────
Sie müssen Ihre Idee nicht vorab in eine umfangreiche technische Spezifikation umwandeln.
Schreiben Sie mir eine private Nachricht über MQL5 und beschreiben Sie die Aufgabe mit Ihren eigenen Worten. Ich prüfe die Umsetzbarkeit, schlage eine optimale Lösung ohne unnötige Funktionen vor und nenne Ihnen vorab den Arbeitsumfang, den Zeitrahmen und das Budget.
Kleinere Aufgaben versuche ich möglichst schnell umzusetzen. Komplexe Projekte teile ich in klare Etappen auf und betreue sie persönlich – vom ersten Gespräch bis zum fertigen Ergebnis.
Bei jedem Schritt sprechen Sie direkt mit dem Entwickler. Dadurch gehen wichtige Details zwischen der Besprechung und der technischen Umsetzung nicht verloren.
PulseScope Signal uses three independent contours with different sensitivities. Each contour analyzes impulse behavior at its own scale and follows its formation, development and weakening.
The three streams are not simply averaged. They are combined through proprietary multi-stage agreement, confirmation and adaptive-threshold logic.
PulseScope Studio therefore optimizes the parameters of the complete analytical architecture—not one coefficient from a standard indicator.
Different scales. Independent processing. One coordinated decision framework.
👉 PulseScope Studio:
https://www.mql5.com/ru/market/product/185833
Terminals are restarted. Workstations need maintenance. Some searches simply take longer on weaker hardware.
With Resume enabled, PulseScope Studio can continue an optimization after the terminal is restarted. The option is designed for long runs where preserving continuity matters more than pretending interruptions never happen.
🔒 Keep the workflow recoverable.
▶️ Return to the run.
🧭 Continue the search instead of rebuilding it from zero.
Serious analytical tools should be designed for real operating conditions—not perfect laboratory uptime.
👉 PulseScope Studio:
https://www.mql5.com/ru/market/product/185833
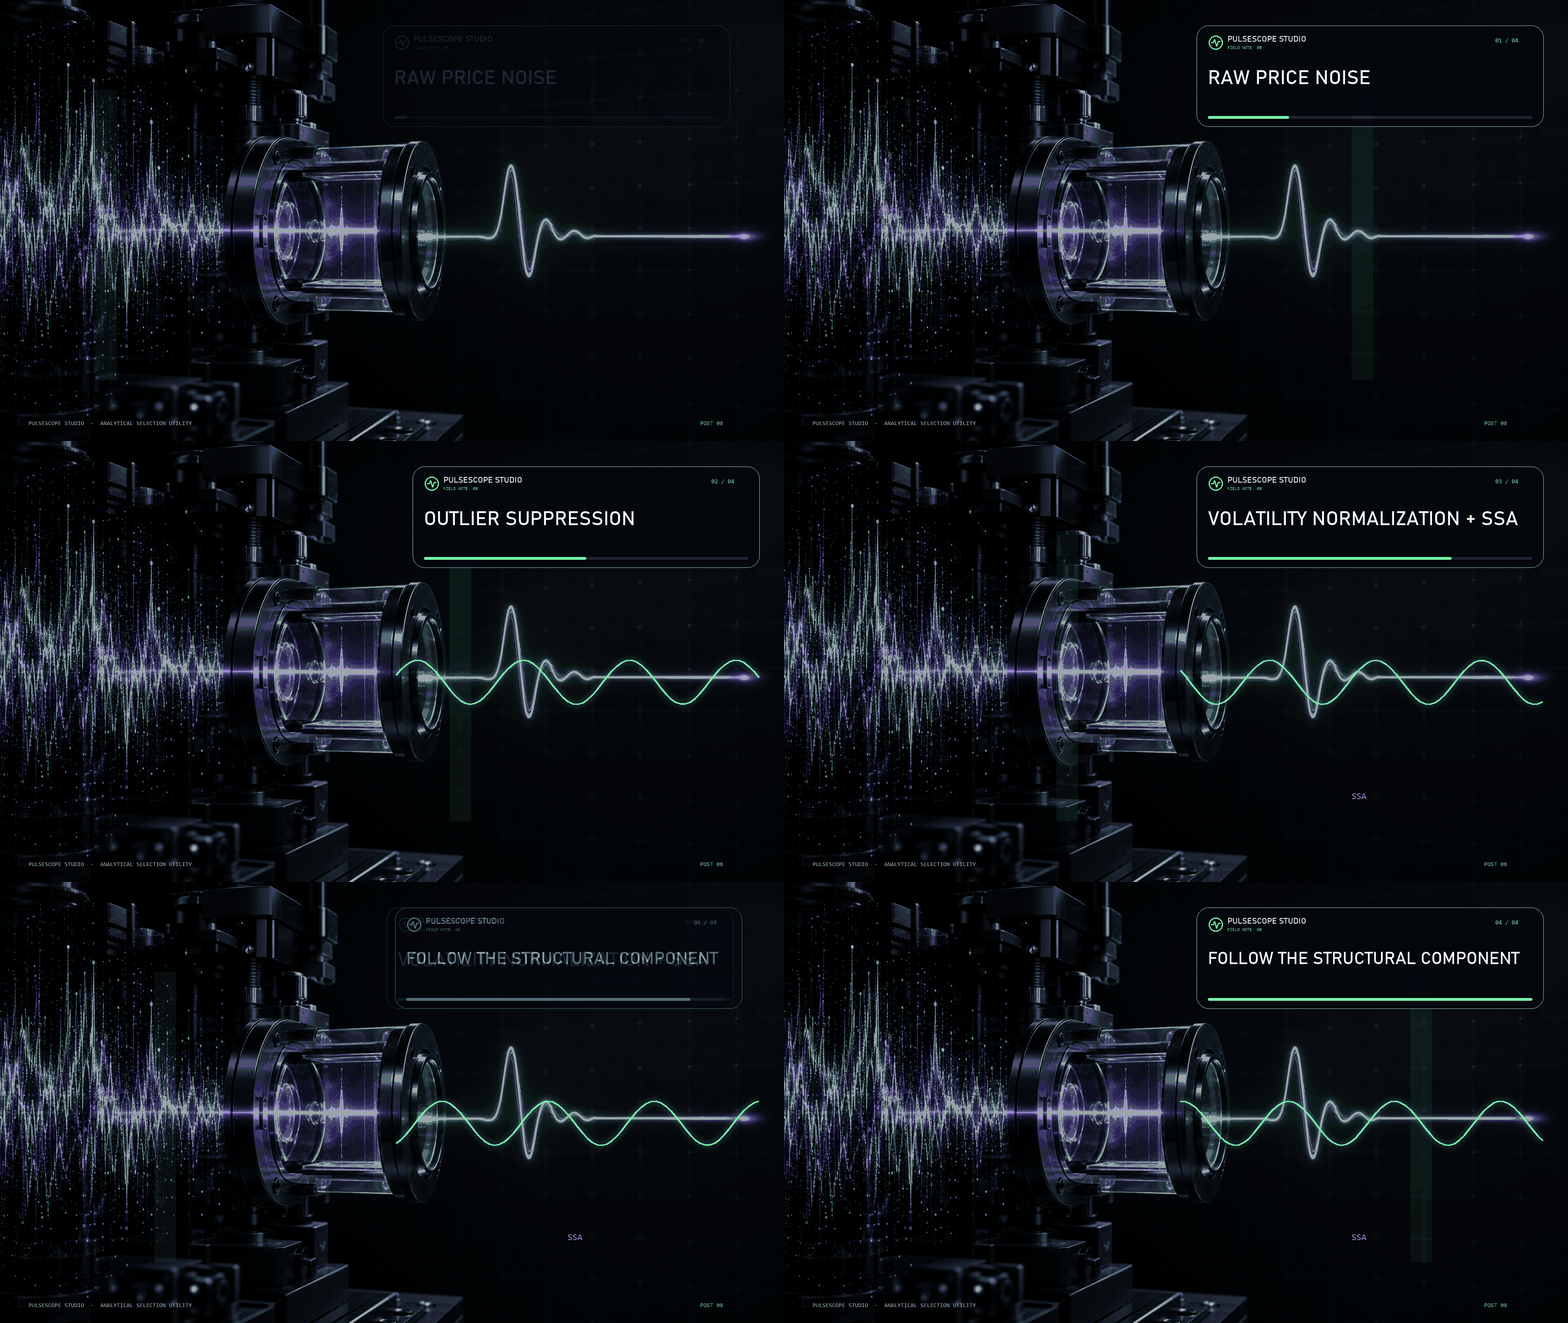
Inside each PulseScope Signal contour, the price series passes through a dedicated processing chain that includes:
🧹 outlier suppression;
🧭 an estimate of fractal market structure;
⚖️ impulse normalization relative to current volatility;
🔬 SSA analysis and reconstruction of the price increments.
The objective is to separate a structural component of movement from random fluctuations before the multi-stage signal logic evaluates it.
PulseScope Studio optimizes this analytical architecture as a system—not as a cosmetic line on a chart.
👉 PulseScope Studio:
https://www.mql5.com/ru/market/product/185833
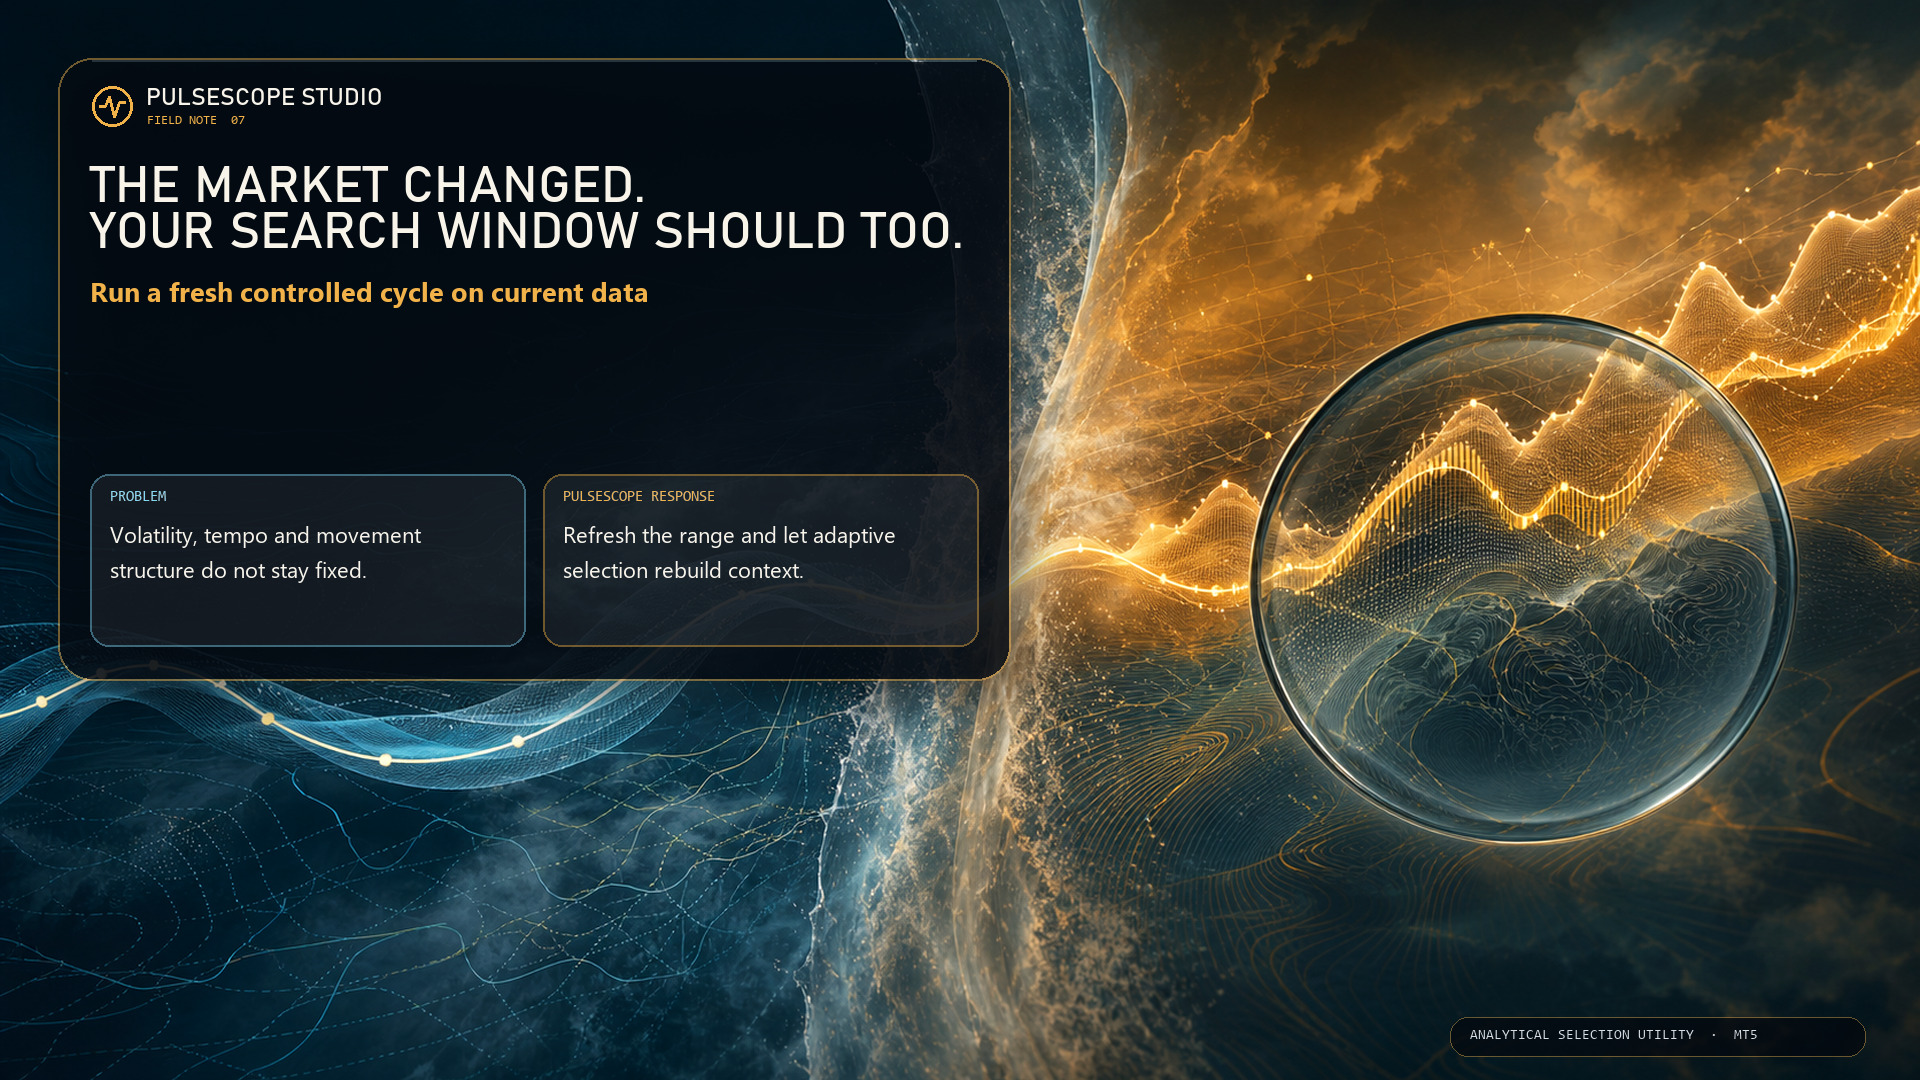
A configuration found on an older segment does not automatically remain suitable for a newer one. PulseScope Studio makes recalibration a controlled workflow:
📅 refresh the evaluation range;
🧬 launch a new adaptive search cycle;
🛰️ let parallel agents assess candidates;
🚫 filter weak and repeated directions as results accumulate.
The output is a newly selected set for the current symbol, timeframe and data context—not a promise about the future, but a disciplined way to respond when the market changes.
👉 PulseScope Studio:
https://www.mql5.com/ru/market/product/185833
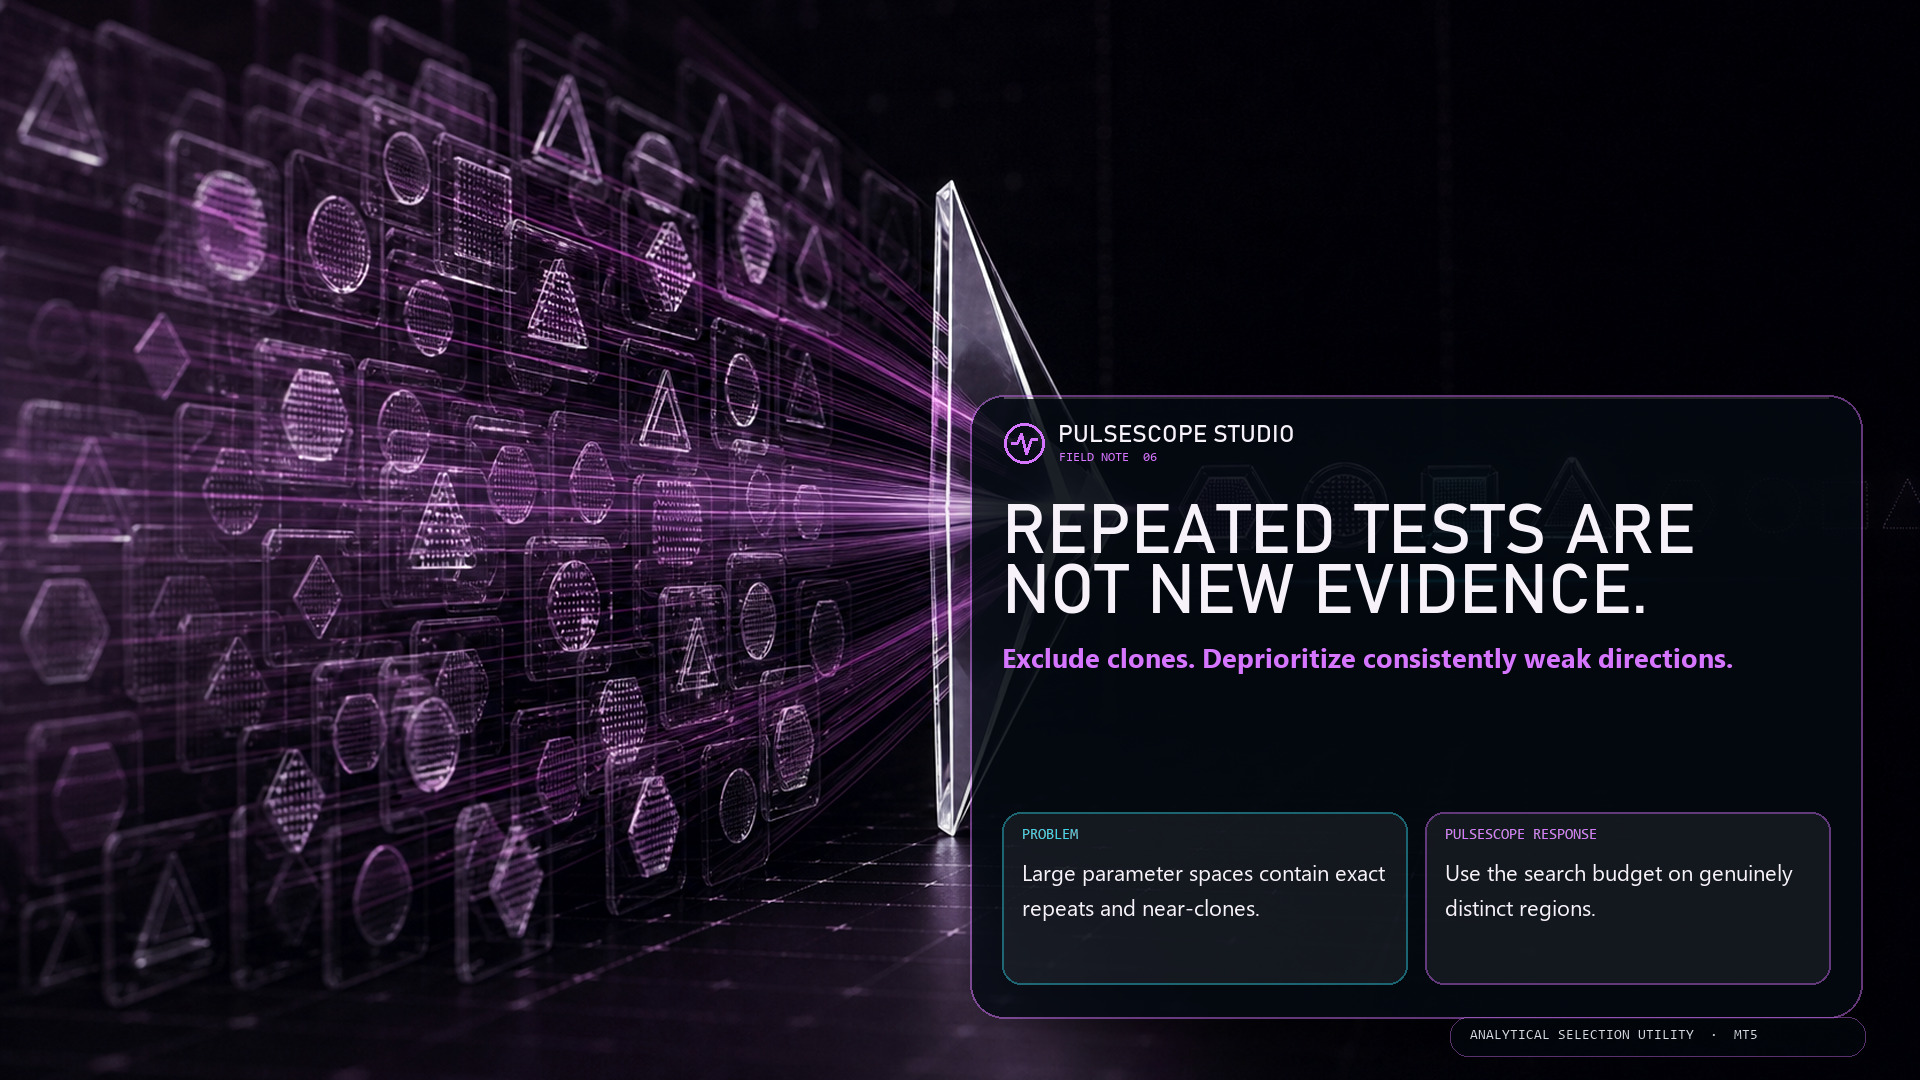
Parameter space can be crowded with exact repeats and nearly identical configurations. Testing the same neighborhood again may consume time without adding meaningful evidence.
PulseScope Studio keeps track of what has already been evaluated:
🚫 exact and near-duplicate variants are excluded;
📉 values that repeatedly lead to weak results lose priority;
🧭 exploration is redirected toward more distinct regions.
The objective is not to inflate the pass counter. It is to make each new evaluation contribute something new to the selection process.
👉 PulseScope Studio:
https://www.mql5.com/ru/market/product/185833
PulseScope Studio can distribute evaluations across parallel agents running on separate charts. While candidates are being checked, the main dashboard coordinates status, progress and results in one workflow.
⚡ More evaluations can move at the same time.
🧭 The search logic remains centralized.
📊 Progress stays visible.
Parallelism is not magic—actual speed depends on the terminal, processor and selected workload. But it removes the one-chart-at-a-time limitation from the design.
👉 PulseScope Studio:
https://www.mql5.com/ru/market/product/185833
PulseScope Studio uses adaptive genetic search instead of exhaustive sequential scanning:
🧬 stronger configurations survive into the next generation;
🔀 their parameters are recombined;
🧭 dynamic mutation redirects exploration into new areas;
🎯 directions that repeatedly remain weak lose priority.
The search does not restart blindly with every combination. It changes its focus as evidence accumulates.
👉 PulseScope Studio:
https://www.mql5.com/ru/market/product/185833
If performance disappears after a small parameter change—or on data that never participated in selection—you may have found a spike, not a stable regime.
PulseScope Studio adds two reality checks:
🧭 it explores neighboring configurations to look for a broader stable region;
🛡️ it recalculates promising candidates from scratch on an independent control period.
This does not predict the future. It helps stop one convenient historical fragment from earning more trust than it deserves.
👉 PulseScope Studio:
https://www.mql5.com/ru/market/product/185833
Finding an impressive historical result is easy.
Understanding whether it deserves your trust is much harder.
PulseScope Studio is not built to chase one “perfect” number. It is designed for a complete configuration selection workflow:
🧬 Adaptive genetic search
⚡ Parallel calculation agents
🛡 Separate validation on a control period
🚫 Filtering of weak and duplicate directions
📊 Results history and favorite configurations
📈 Direct launch of the built-in PulseScope Signal on a chart
Two operating modes are supported:
🔹 Classic Trading
🔹 Binary Options
The Studio also includes 13 interface languages and built-in parameter explanations, so every important setting is explained directly inside the application.
From parameter search to a validated and reproducible configuration.
👉 PulseScope Studio:
https://www.mql5.com/ru/market/product/185833
PulseScope Studio ist ein automatischer Optimierer für Handelsindikatoren in MetaTrader 5. Er sucht nach robusten Parametern, filtert zufällige Spitzenwerte in historischen Ergebnissen heraus, prüft die Kandidaten in einem separaten Kontrollzeitraum und ermöglicht es, die ausgewählte Konfiguration sofort auf dem Chart zu starten. Gerade dort, wo ein Ergebnis besonders überzeugend wirkt, täuscht der Markt am häufigsten. Eine echte Gesetzmäßigkeit von einem zufälligen Treffer zu trennen – darin
Manchmal möchte man einfach kurz durchatmen: Während der Chart „atmet“, kannst du dich für einen Moment ablenken und den Fokus lockern – ohne das Terminal zu verlassen. ARKAVELLE wird direkt im Chart gezeichnet: eine kleine Arcade für eine ruhige Pause zwischen Ideen und Trades. Die Regeln sind einfach • Ziel: Den Ball mit dem Paddle zurückspielen und die Blöcke zerstören. • Steuerung: Pfeiltasten ← / → oder Maus (Bewegung innerhalb des Panels). Fange die fallenden Power-ups – sie verändern das
https://www.mql5.com/ru/market/product/134522
🚀 **TickFlow update — version 1.4**
Now it does more, with greater accuracy and convenience — so you can spot quickly where the market is “hot” and where it’s in a comfort zone.
🔥 **What TickFlow can do now:
* clearly shows the **buyer/seller balance** and the **delta** in a readable format — the direction and strength of activity are visible instantly;
* adds a compact **info panel** right on the chart with key statistics and tick history for recent bars — everything you need within reach;
* smart **cluster grouping** and improved tick processing — makes it easier to find volume concentration zones and likely areas of interest;
* improved detection and visualization of **support/resistance levels** — levels are now more precise and informative;
* built-in **alerts/notifications** for important levels — so you won’t miss critical moments;
* more useful settings and neatly organized parameters — you can flexibly adapt the tool to your strategy;
* optimized calculations and cleaner presentation of numbers (delta formatting, percentages, etc.) — reading the data is simpler and more pleasant.
💡 **Why the indicator is useful:
* fewer guesses, more facts: you can see who dominates ticks, where volume is concentrated, and where the market feels uneasy;
* faster decision-making — essential information is now compact and easy to read;
* the tool fits both fast scalping and position trading — everything on a single chart;
* tidy visual cues cut analysis time and reduce trading stress.
✨ **Who will like it: traders using volume/tick analysis, those looking for extra confirmation for entries/exits, and anyone who likes a compact panel with quick stats.
📌 **Update now** — if you’re already using TickFlow, version 1.4 delivers a richer, more convenient market view.
https://www.mql5.com/ru/market/product/134522
https://www.mql5.com/en/market/product/156185
The indicator’s auto-tuning has been brought back, but in an updated form — with improved logic, more stable behavior, and expanded control options. The mechanism for automatically adapting internal coefficients has also been refined and improved.
After “version 2”, where sensitivity parameters were adjusted manually, the model has been switched back to automatic adaptation. The redesigned algorithm now:
analyzes the length of winning/losing signal series more effectively;
increases the “strictness” of filters in proportion to the number of losing trades and the depth of the drawdown (including for traders using grid strategies outside of binary options);
speeds up or slows down its reaction depending on statistics;
includes protection against excessive parameter swings so that the model does not “overreact”;
uses a separate Base Speed parameter, which defines the initial character of the indicator (fast/reactive or smoother/more filtered) even before auto-adaptation kicks in, with a normalized range so that values stay within reasonable limits on any timeframe.
This produces a clear, controllable effect — the model actually feels more “alive” and responsive to the market, rather than mechanical.
Additionally, the extremum-filter algorithms have been improved.
Manual tuning proved useful in tests, but on real data it required constant user attention: adjusting to volatility, market “noisiness”, trend phase, and impulse strength. Auto-adaptation and the Base Speed parameter remove this burden and allow the model to react on its own to changes in market structure, instead of working with fixed coefficients.
https://www.mql5.com/en/market/product/156185
📊 The main changes are under the hood: the trend/flat, impulse, and extreme filters have been updated, which makes the behavior of the arrows more stable in different market regimes. Entries now pass through a stricter combination of filters.
✅ Improved signal engine and filtering system. Many small adjustments that overall have a positive impact on signal quality.
✅ Sensitivity is now controlled by three linked parameters, Sens 1–3.
✅ The statistics panel has been redesigned: we now display information only for the current trading instrument, which reduces the load on the terminal.
✅ Removed drawing of arrows on past history. Signals are now generated only in real time, taking into account impulses and price behavior. This makes the signals more honest and realistic.
👇 Try it now:
https://www.mql5.com/en/market/product/156185
Signalindikator für Binäroptionen, der auch auf dem Forex-Markt und anderen Märkten effektiv eingesetzt wird. Er eignet sich für kurzfristiges Grid-Trading auf M1–M5 und enthält Signale zum schrittweisen Positionsaufbau. Der Indikator verwendet eine zweistufige Anpassung: ein grundlegendes Geschwindigkeitsprofil (Einstellung „schnell/gleichmäßig“ von Beginn an) und eine Auto-Adaptation basierend auf den Handelsergebnissen, die die Filter an den aktuellen Markt anpasst und dabei Serien von
There’s another quiet problem that eats money and time:
during the day you’re away from the screen — a good trend is missed
you open the terminal in the evening — half of the move is already gone
you scroll through symbols: one is just noise, on another the “train has left”, on the third it’s unclear whether it’s worth touching at all
And every time it’s the same: lots of charts, very few clear decisions.
🧩 Solution: don’t try to see everything — filter the best
Things get much easier when you have a tool that:
collects statistics of its own signals across different symbols
shows where the model actually performs well, and where the market just doesn’t fit it
helps you see on which symbols trends are “alive” right now, and where it’s nothing but chop
In my own toolkit, this role is covered by Adaptive NeuroMatrix Trend (MT5):
it doesn’t just draw phases (trend / flat / impulse), it also keeps a numeric history — by instruments and by time. In essence, it helps quickly answer:
“On which pairs/instruments does this approach make sense today, and which ones are better to skip?”
💡 Benefit for the trader
This approach gives several tangible advantages:
fewer pointless trades on “favorite but dead” instruments
focus only on the symbols where your logic actually works
a clear reason why you picked these specific 3–5 instruments out of the whole list
stats not in a notebook and not “from memory”, but right inside the indicator
If you want to see how such filtering looks in practice, you can run Adaptive NeuroMatrix Trend (MT5) in the tester on your own instrument list:
Adaptive NeuroMatrix Trend (MT5)
https://www.mql5.com/ru/market/product/155563
Have you ever seen a “perfect” indicator in the tester and a totally different story on a live chart?
Most of the time it’s because of repainting – signals look great on history, but in real time they change after the fact 😤
Adaptive NeuroMatrix Trend was built specifically to avoid that. It’s a price-action based trend indicator that works **only on bar close**, so what you see in real time is exactly what will stay on the chart 💹
What it helps you see:
🔵 when buyers dominate (bullish phase)
🔴 when sellers dominate (bearish phase)
⚪ when the market is basically flat and better to stay out or take profit
🟡🟠 impulse zones that may lead to a reversal or at least to a pause in the current move
Inside, it combines smoothing, volatility and statistics to cut out random noise and leave a clean, readable structure of trend / flat / impulse ✅
You can tune its behavior to match your style:
⏱ adjust reaction speed vs. smoothness
🎯 make entries more conservative or more aggressive
🚫 suppress random spikes and noisy bars
🧠 enable a predictive layer that helps to catch trend phase shifts a bit earlier
Possible uses in a trading plan:
🧭 trend filter for your existing strategies and EAs
🔎 quick scan of symbols to see where a real move is happening right now
📌 spotting exit and re-entry areas after strong impulses
If you’re tired of indicators that “know the future” only on history and want a clearer view of who’s in control – buyers, sellers or nobody – take a look at Adaptive NeuroMatrix Trend, run it in the Strategy Tester on your own symbols and timeframes, and see how it behaves in your approach 📉📊
Page of the indicator:
https://www.mql5.com/ru/market/product/155563