Konstantin Chechnev
Konstantin Chechnev
4.7 (4)
  • Informazioni
7+ anni
esperienza
12
prodotti
65
versioni demo
0
lavori
0
segnali
0
iscritti
Konstantin Chechnev
Konstantin Chechnev
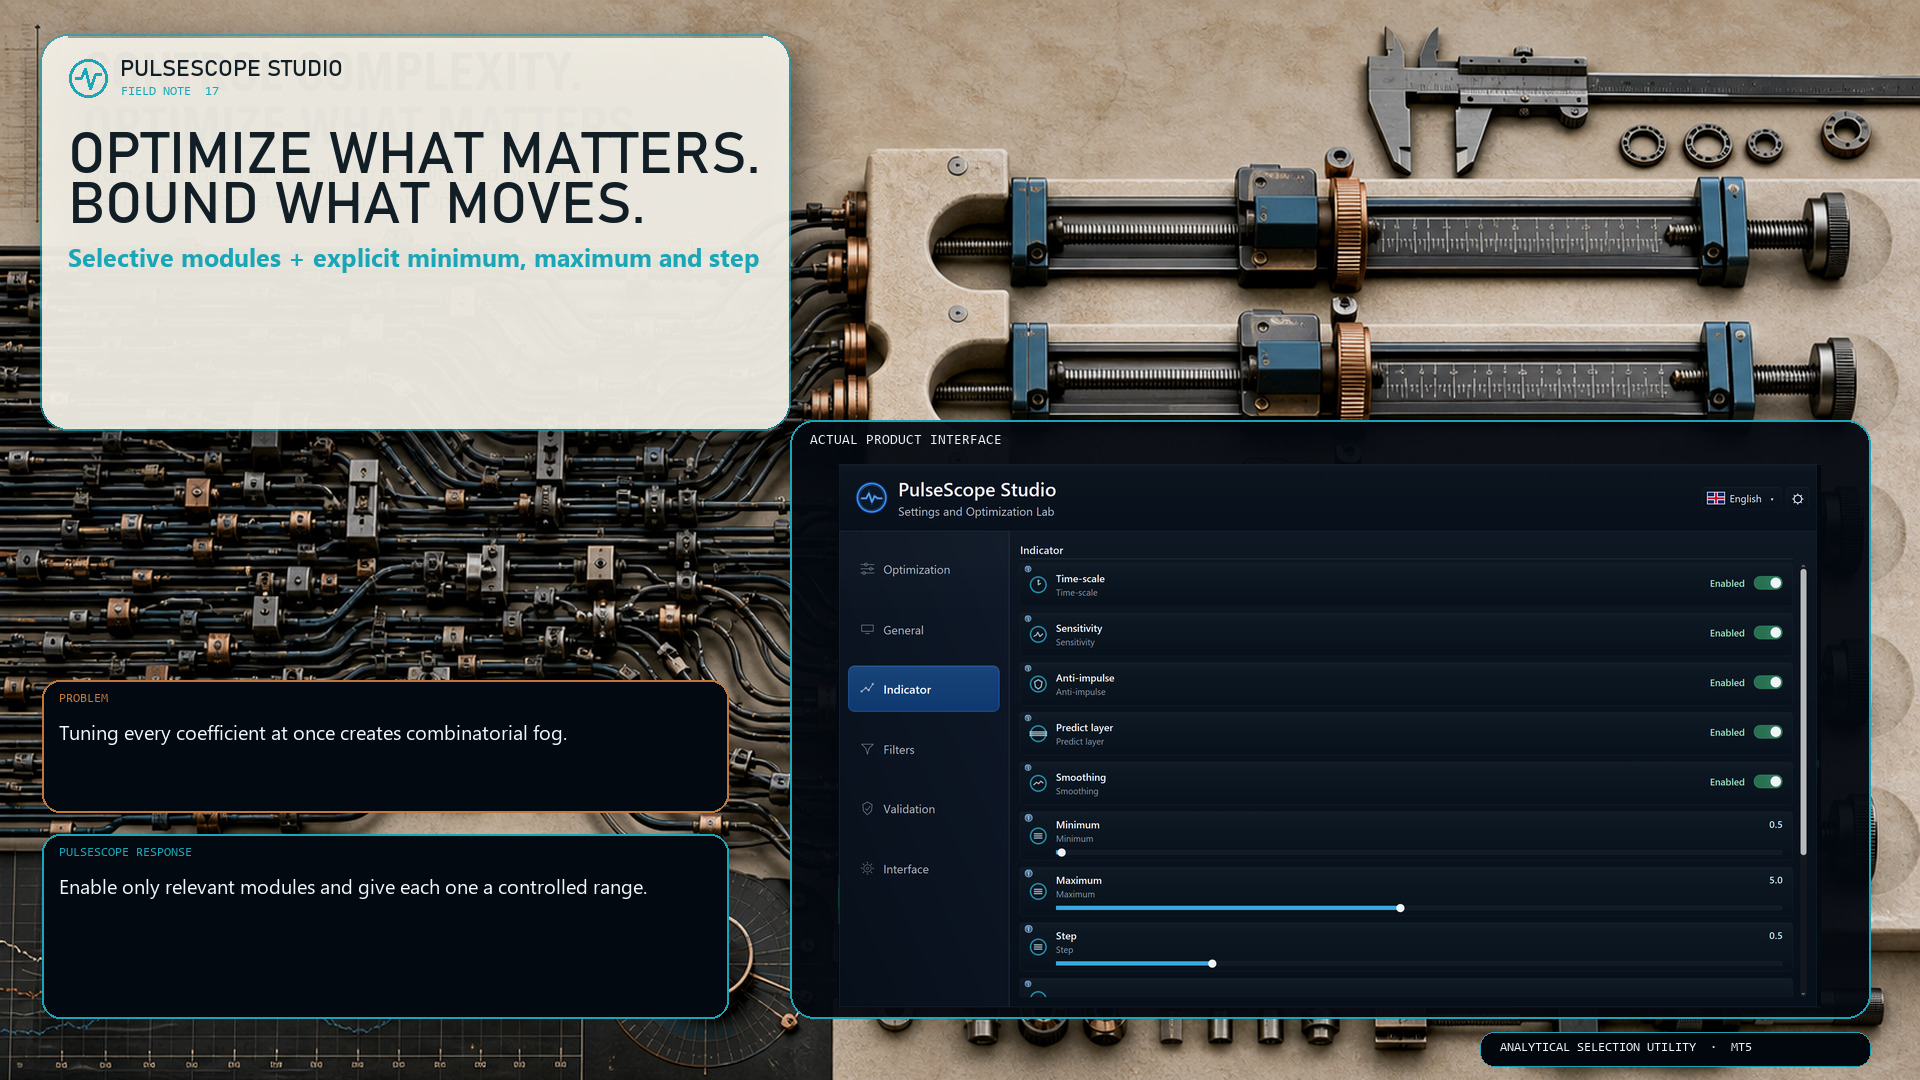
⚙️ Brute force treats every coordinate as equally interesting. The market rarely rewards that assumption.

PulseScope Studio uses adaptive genetic search instead of exhaustive sequential scanning:
🧬 stronger configurations survive into the next generation;
🔀 their parameters are recombined;
🧭 dynamic mutation redirects exploration into new areas;
🎯 directions that repeatedly remain weak lose priority.

The search does not restart blindly with every combination. It changes its focus as evidence accumulates.

👉 PulseScope Studio:

https://www.mql5.com/ru/market/product/185833
Konstantin Chechnev
Konstantin Chechnev
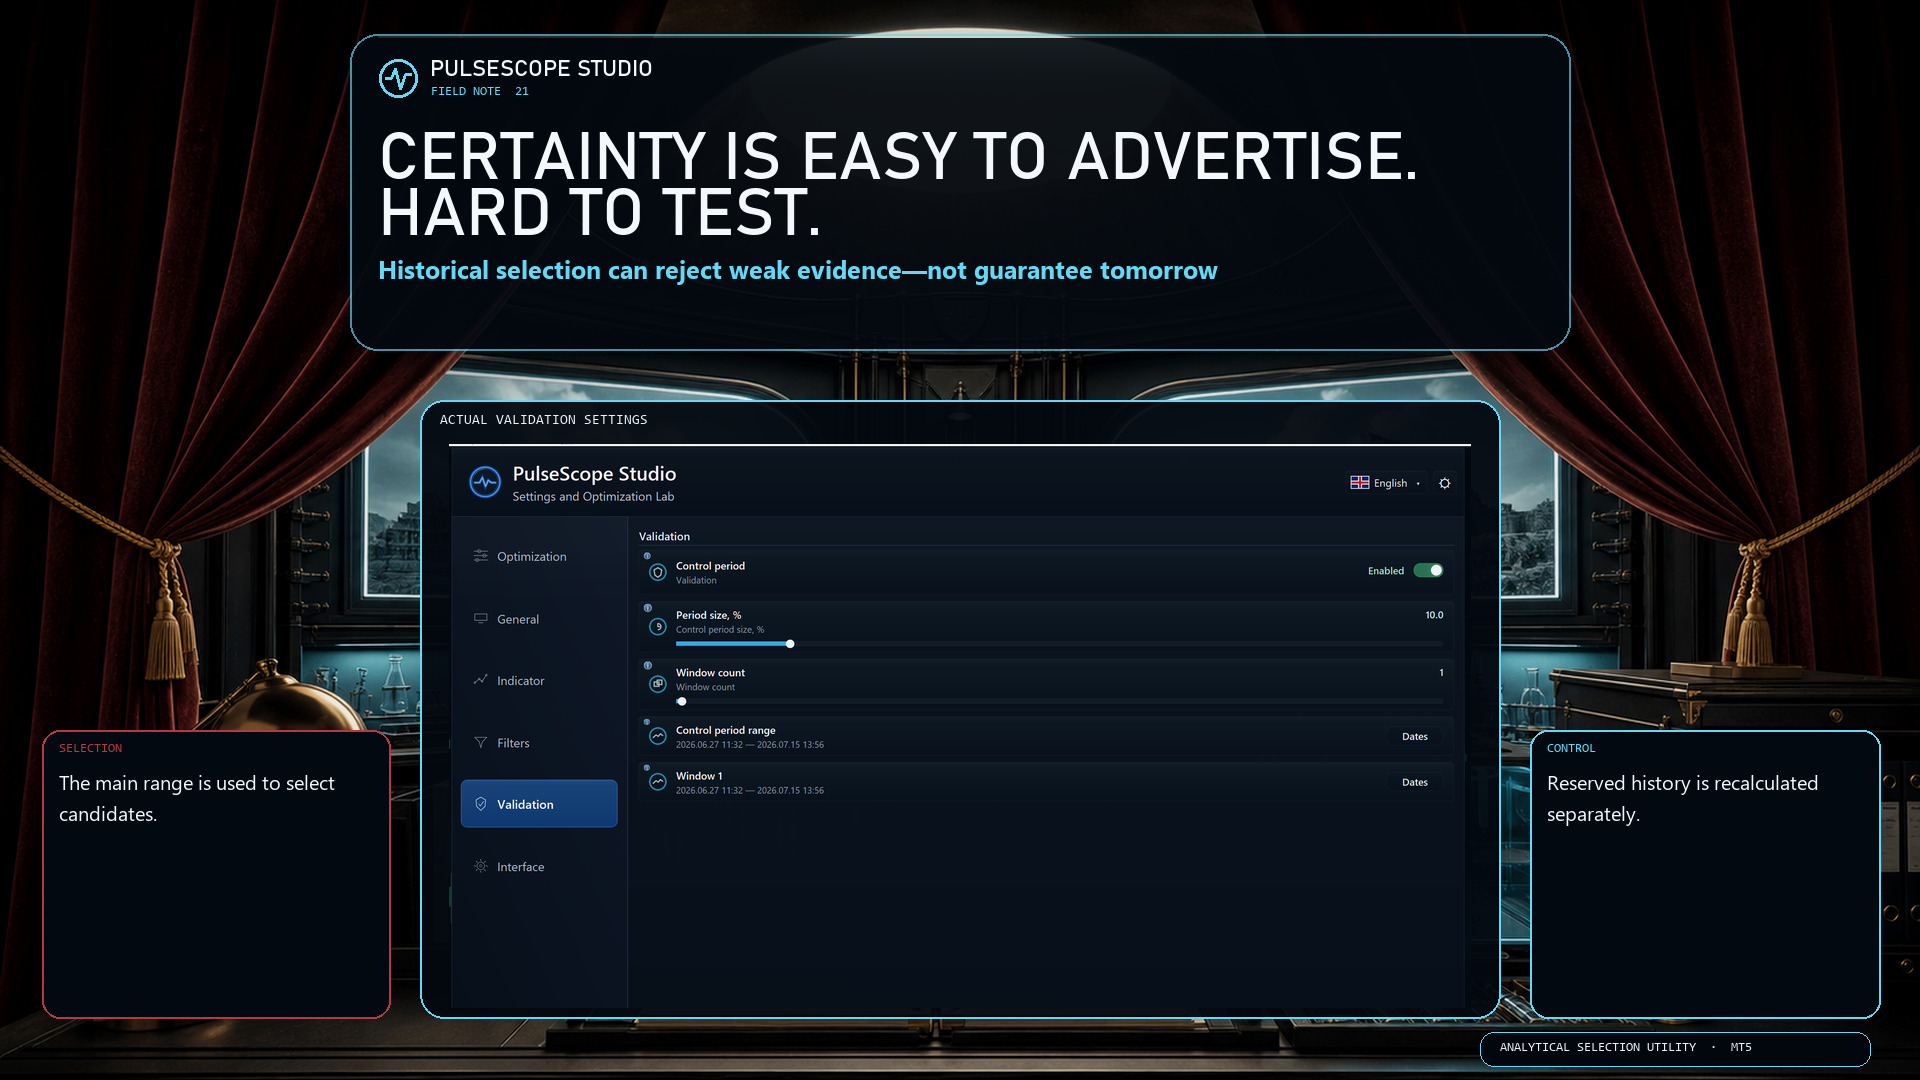
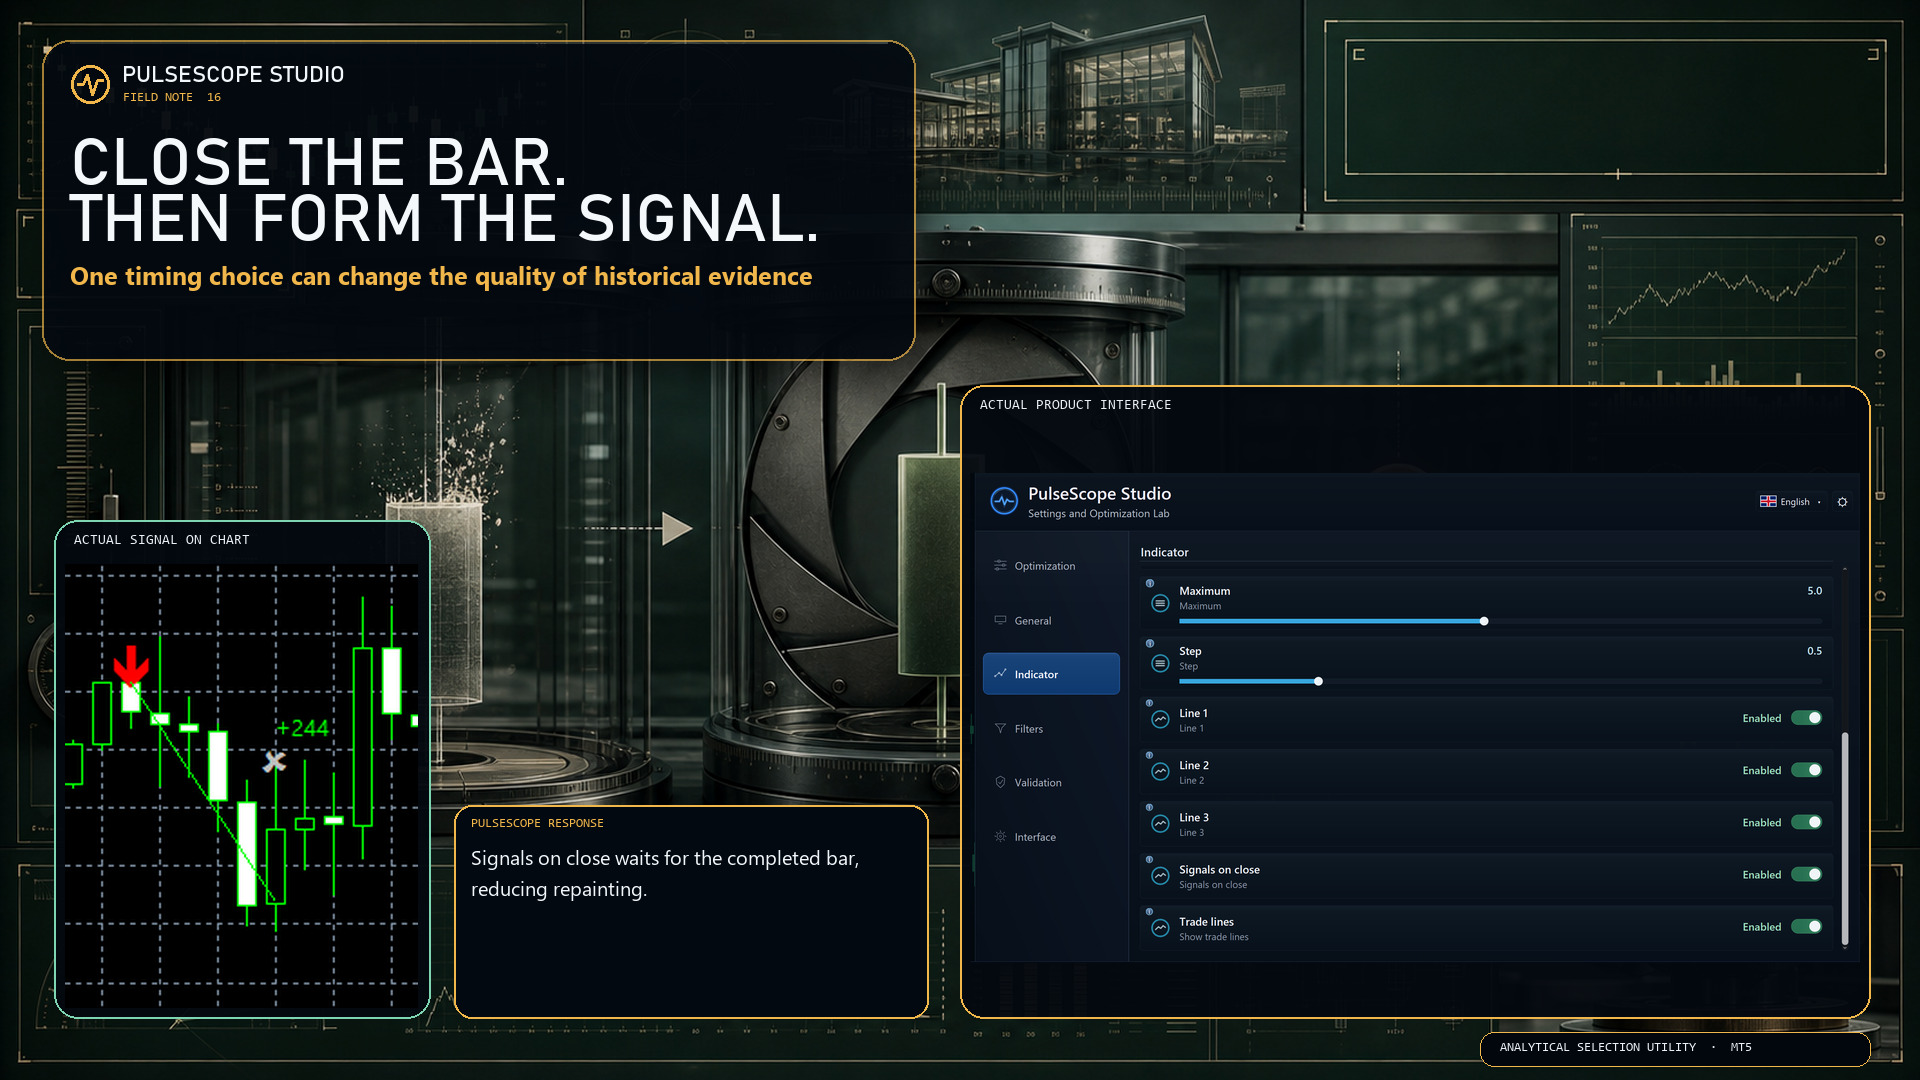
📉 A perfect backtest can be one lucky coordinate.

If performance disappears after a small parameter change—or on data that never participated in selection—you may have found a spike, not a stable regime.

PulseScope Studio adds two reality checks:
🧭 it explores neighboring configurations to look for a broader stable region;
🛡️ it recalculates promising candidates from scratch on an independent control period.

This does not predict the future. It helps stop one convenient historical fragment from earning more trust than it deserves.

👉 PulseScope Studio:

https://www.mql5.com/ru/market/product/185833
Konstantin Chechnev
Konstantin Chechnev
🚀 PulseScope Studio is now available on MQL5 Market

Finding an impressive historical result is easy.
Understanding whether it deserves your trust is much harder.

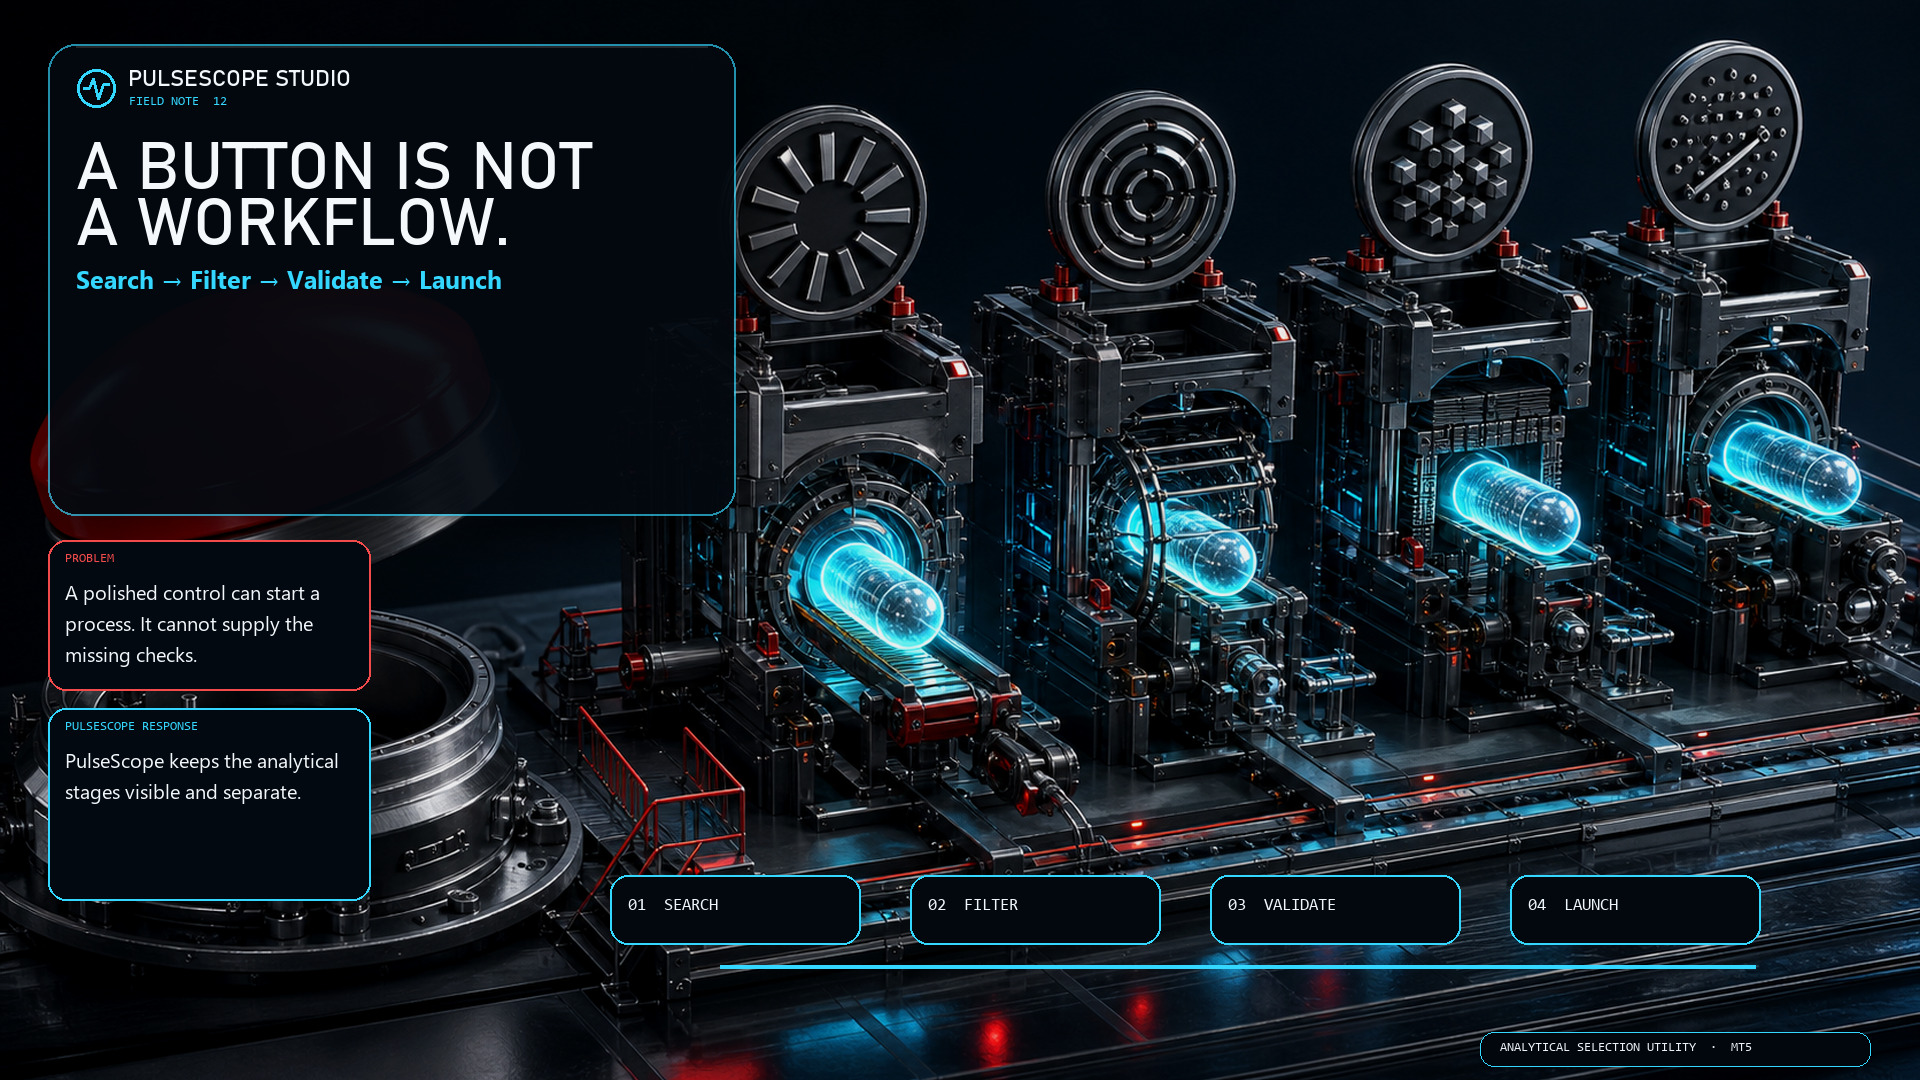
PulseScope Studio is not built to chase one “perfect” number. It is designed for a complete configuration selection workflow:

🧬 Adaptive genetic search
⚡ Parallel calculation agents
🛡 Separate validation on a control period
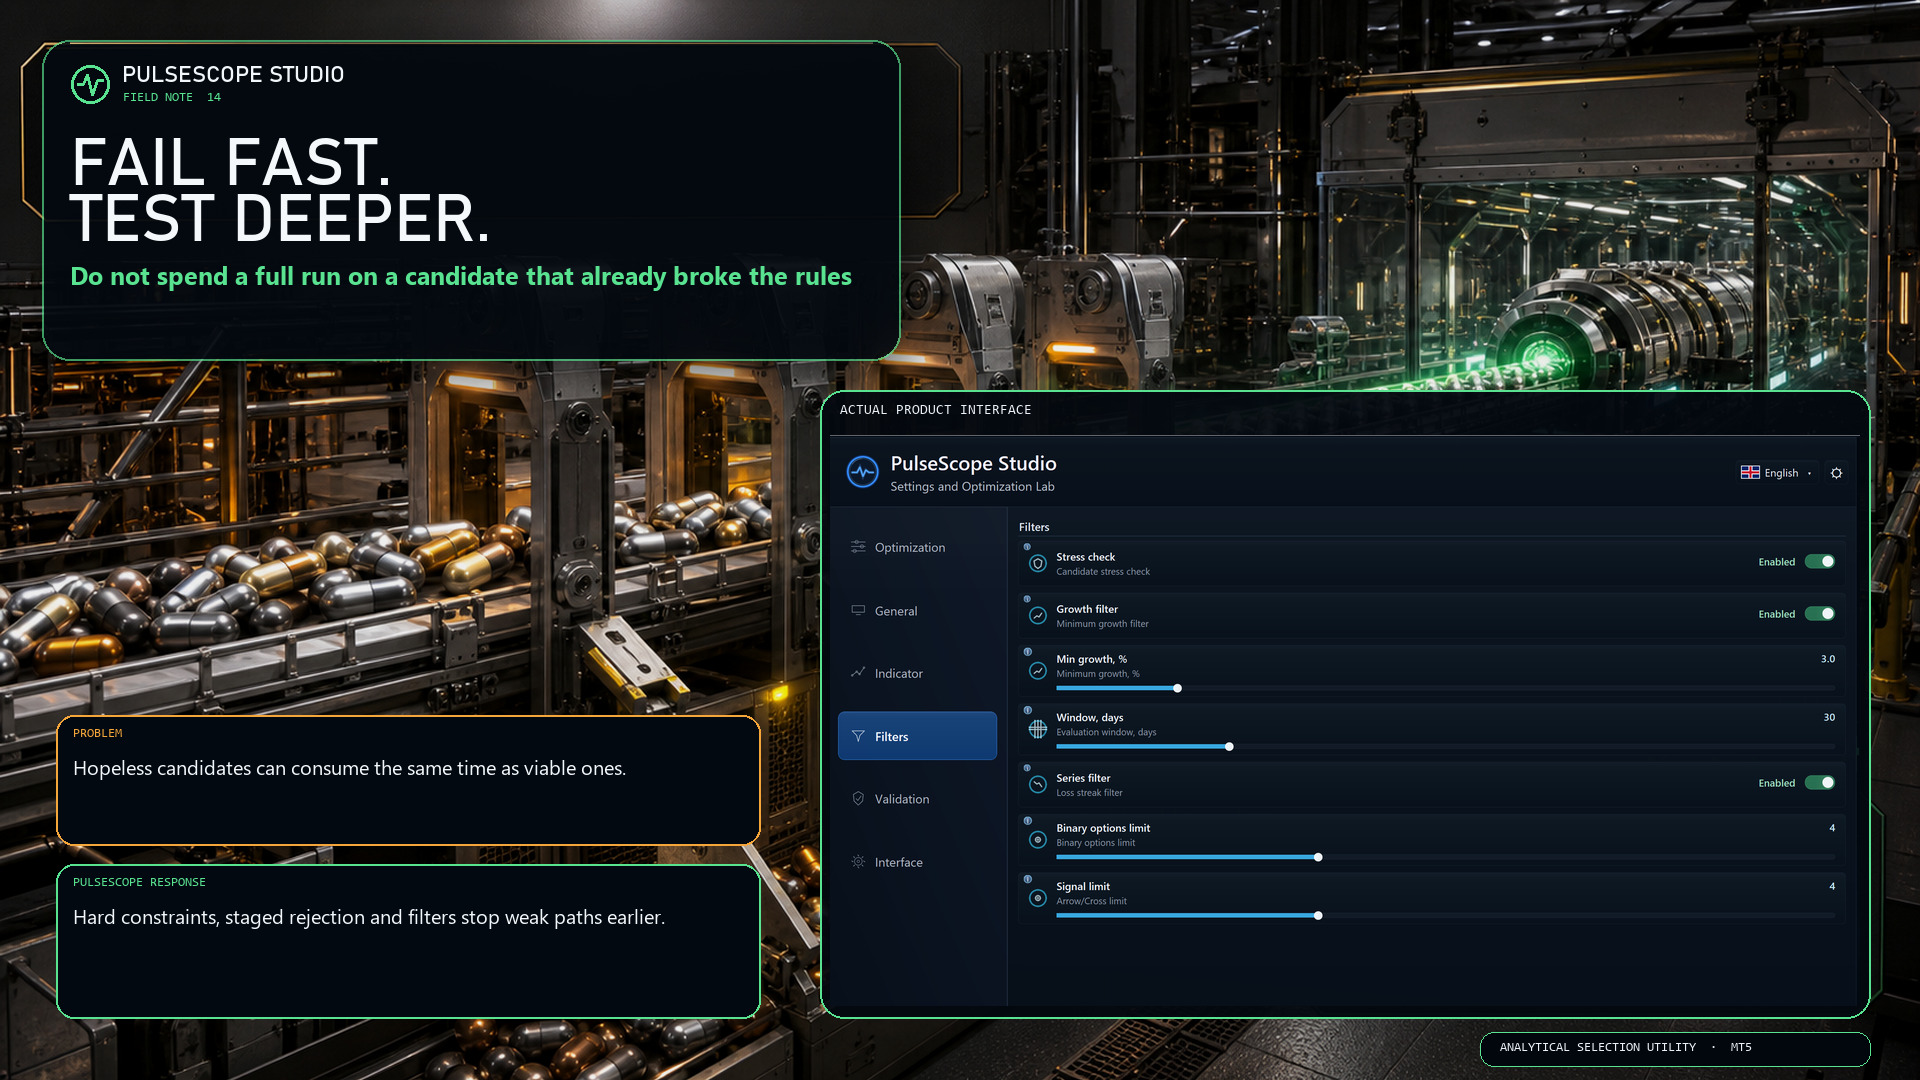
🚫 Filtering of weak and duplicate directions
📊 Results history and favorite configurations
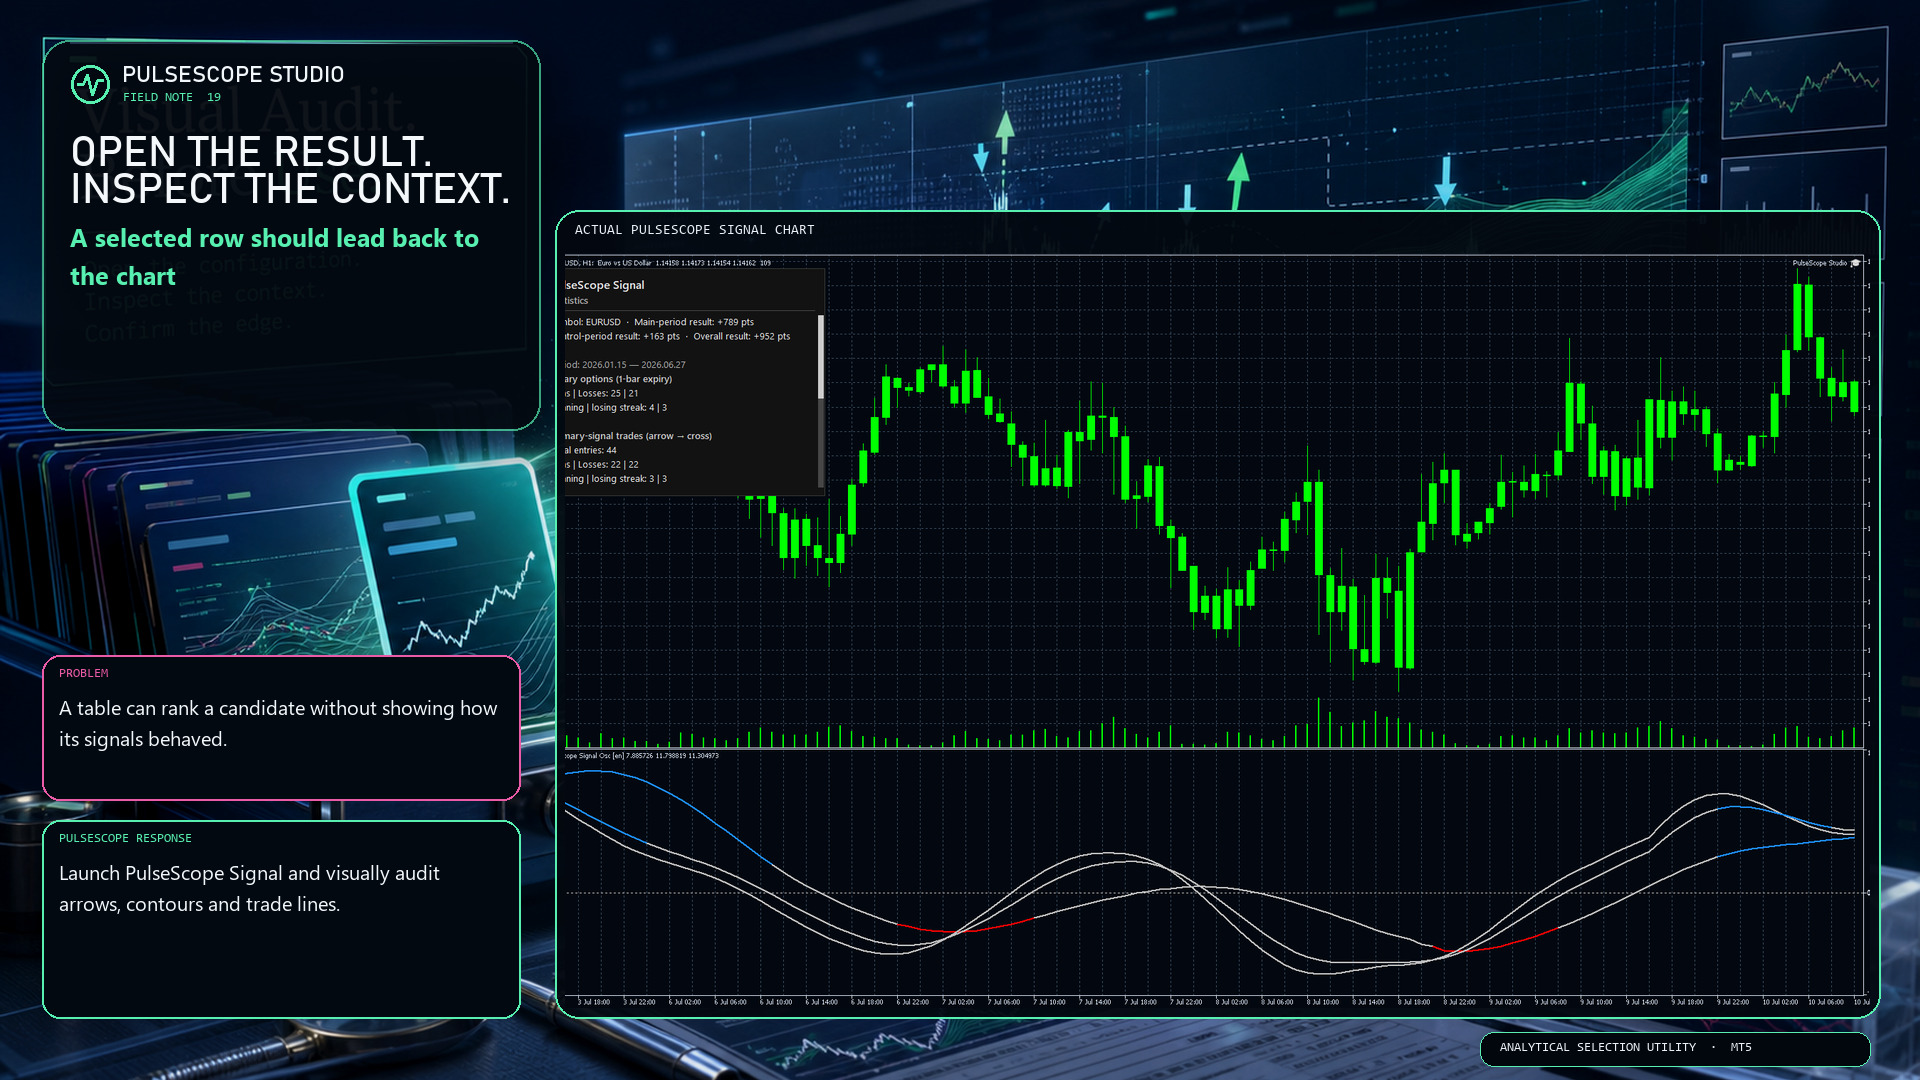
📈 Direct launch of the built-in PulseScope Signal on a chart

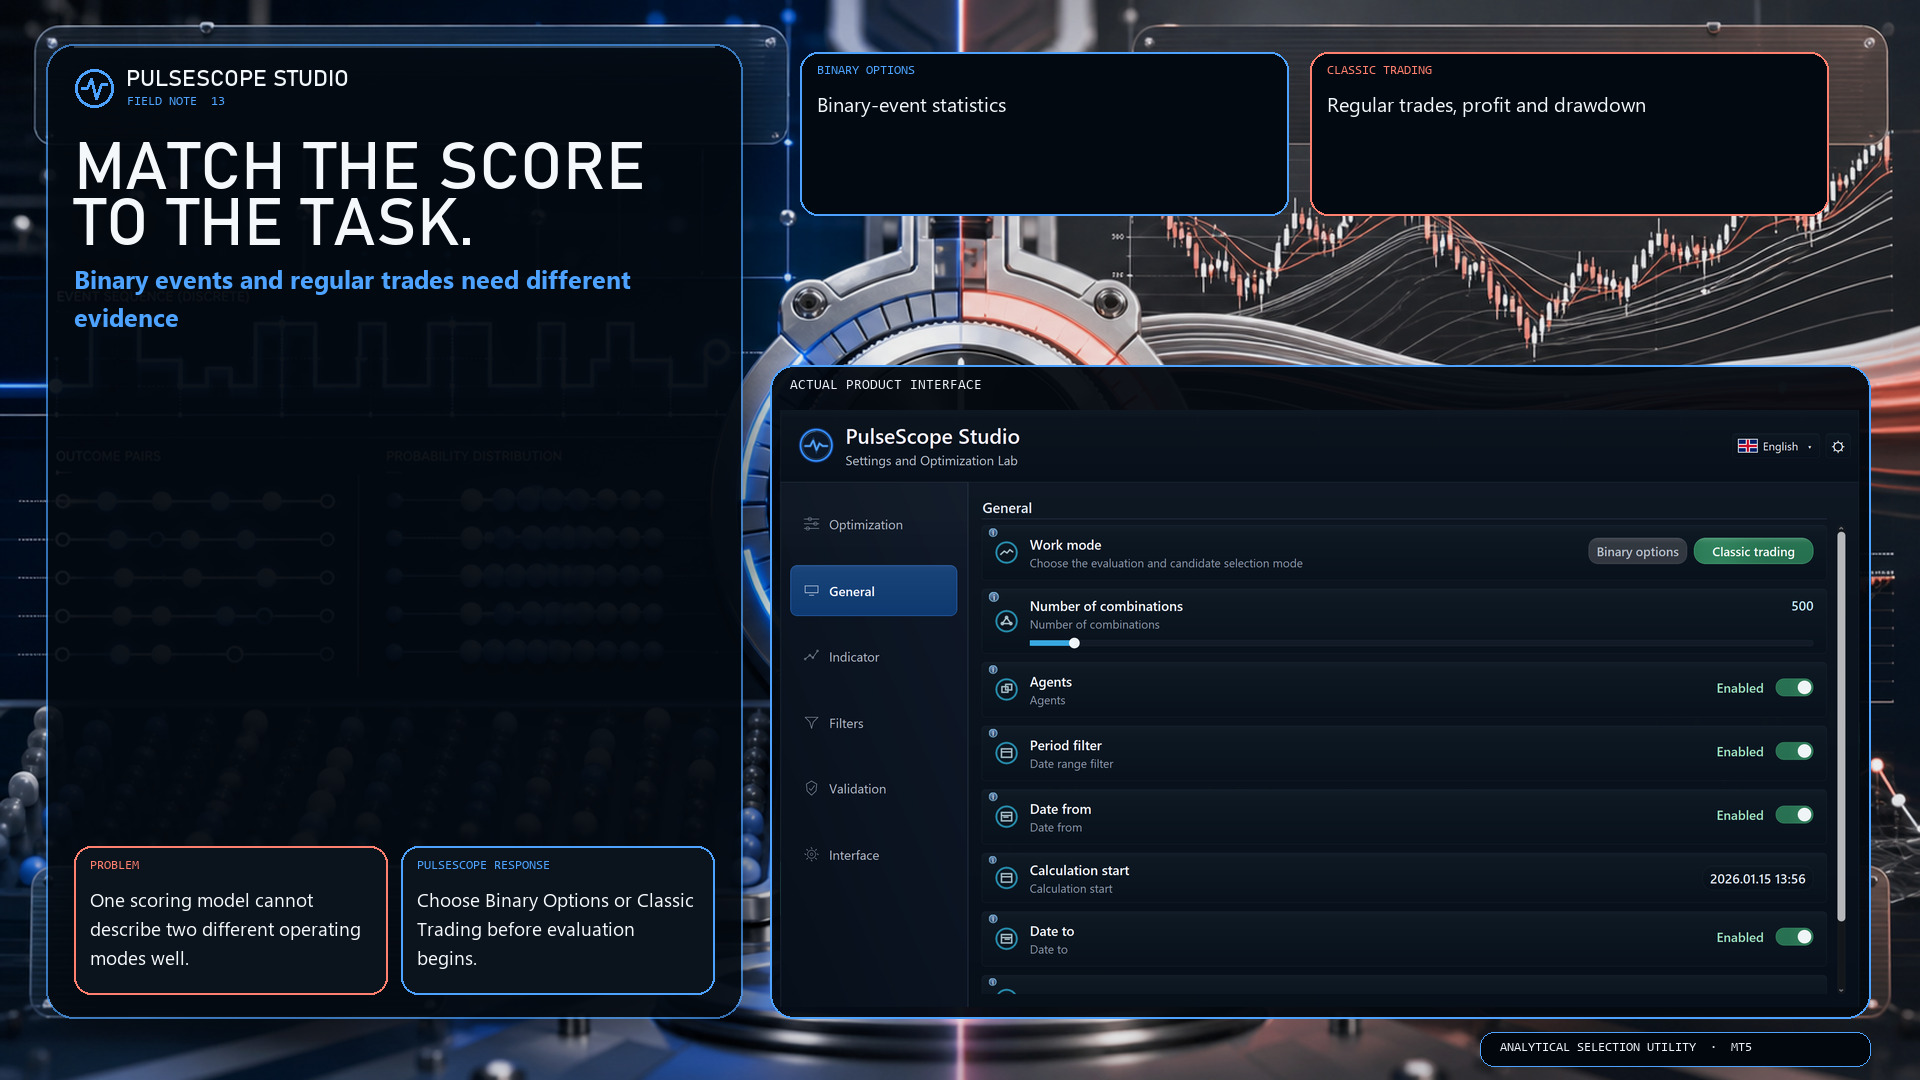
Two operating modes are supported:

🔹 Classic Trading
🔹 Binary Options

The Studio also includes 13 interface languages and built-in parameter explanations, so every important setting is explained directly inside the application.

From parameter search to a validated and reproducible configuration.

👉 PulseScope Studio:

https://www.mql5.com/ru/market/product/185833
Konstantin Chechnev Prodotto pubblicato

Trovare un risultato convincente sui dati storici è facile. Capire se merita davvero fiducia è molto più difficile. Il mercato inganna più spesso proprio quando il risultato appare particolarmente convincente. Separare una vera regolarità da una coincidenza casuale è la sfida reale.   PulseScope Studio è un ambiente completo di ottimizzazione per l’indicatore di trading integrato PulseScope Signal . Il suo obiettivo non è trovare il miglior risultato sui dati storici, ma individuare

Konstantin Chechnev Prodotto pubblicato

39.99 USD

FiboSens è un Expert Advisor per MetaTrader 5 progettato non sulla base di un semplice tracciamento formale di Fibonacci, ma su un’analisi approfondita della struttura di mercato. Identifica automaticamente i punti di ancoraggio più rilevanti, seleziona la configurazione più affidabile per costruire la griglia di Fibonacci e lavora solo negli scenari in cui la logica del movimento del prezzo rimane coerente. Laddove l’analisi manuale porta spesso a esitazione, incoerenza e decisioni imprecise

Konstantin Chechnev Prodotto pubblicato

A volte viene voglia di prendere fiato per un minuto: mentre il grafico “respira”, puoi staccare un attimo e rilassare l’attenzione — senza uscire dal terminale. ARKAVELLE viene disegnato прямо sul chart: un piccolo arcade per una pausa tranquilla tra idee e operazioni. Le regole sono semplici • Obiettivo: rimbalzare la palla con la piattaforma e rompere i mattoni. • Comandi: frecce ← / → oppure mouse (movimento all’interno del pannello). Raccogli i bonus che cadono: cambiano il ritmo e rendono

Konstantin Chechnev
Konstantin Chechnev


https://www.mql5.com/ru/market/product/134522

🚀 **TickFlow update — version 1.4**
Now it does more, with greater accuracy and convenience — so you can spot quickly where the market is “hot” and where it’s in a comfort zone.

🔥 **What TickFlow can do now:

* clearly shows the **buyer/seller balance** and the **delta** in a readable format — the direction and strength of activity are visible instantly;
* adds a compact **info panel** right on the chart with key statistics and tick history for recent bars — everything you need within reach;
* smart **cluster grouping** and improved tick processing — makes it easier to find volume concentration zones and likely areas of interest;
* improved detection and visualization of **support/resistance levels** — levels are now more precise and informative;
* built-in **alerts/notifications** for important levels — so you won’t miss critical moments;
* more useful settings and neatly organized parameters — you can flexibly adapt the tool to your strategy;
* optimized calculations and cleaner presentation of numbers (delta formatting, percentages, etc.) — reading the data is simpler and more pleasant.

💡 **Why the indicator is useful:

* fewer guesses, more facts: you can see who dominates ticks, where volume is concentrated, and where the market feels uneasy;
* faster decision-making — essential information is now compact and easy to read;
* the tool fits both fast scalping and position trading — everything on a single chart;
* tidy visual cues cut analysis time and reduce trading stress.

✨ **Who will like it: traders using volume/tick analysis, those looking for extra confirmation for entries/exits, and anyone who likes a compact panel with quick stats.

📌 **Update now** — if you’re already using TickFlow, version 1.4 delivers a richer, more convenient market view.

https://www.mql5.com/ru/market/product/134522
Konstantin Chechnev Prodotto pubblicato

Indicateur de signaux pour les options binaires, également utilisé de manière efficace sur le Forex et d’autres marchés. Il convient au trading en grille (grid) de court terme sur M1–M5 et inclut des signaux pour renforcer les positions étape par étape. La version gratuite fonctionne uniquement sur la paire XAUUSD. La version complète pour MetaTrader 5 est disponible ici : https://www.mql5.com/en/market/product/156185 L’indicateur utilise une adaptation à deux niveaux : un profil de vitesse de

Konstantin Chechnev
Konstantin Chechnev
Version 3.0

https://www.mql5.com/en/market/product/156185

The indicator’s auto-tuning has been brought back, but in an updated form — with improved logic, more stable behavior, and expanded control options. The mechanism for automatically adapting internal coefficients has also been refined and improved.

After “version 2”, where sensitivity parameters were adjusted manually, the model has been switched back to automatic adaptation. The redesigned algorithm now:

analyzes the length of winning/losing signal series more effectively;

increases the “strictness” of filters in proportion to the number of losing trades and the depth of the drawdown (including for traders using grid strategies outside of binary options);

speeds up or slows down its reaction depending on statistics;

includes protection against excessive parameter swings so that the model does not “overreact”;

uses a separate Base Speed parameter, which defines the initial character of the indicator (fast/reactive or smoother/more filtered) even before auto-adaptation kicks in, with a normalized range so that values stay within reasonable limits on any timeframe.

This produces a clear, controllable effect — the model actually feels more “alive” and responsive to the market, rather than mechanical.

Additionally, the extremum-filter algorithms have been improved.

Manual tuning proved useful in tests, but on real data it required constant user attention: adjusting to volatility, market “noisiness”, trend phase, and impulse strength. Auto-adaptation and the Base Speed parameter remove this burden and allow the model to react on its own to changes in market structure, instead of working with fixed coefficients.
Konstantin Chechnev
Konstantin Chechnev
🔵 Migration to version 2.0.

https://www.mql5.com/en/market/product/156185

📊 The main changes are under the hood: the trend/flat, impulse, and extreme filters have been updated, which makes the behavior of the arrows more stable in different market regimes. Entries now pass through a stricter combination of filters.

✅ Improved signal engine and filtering system. Many small adjustments that overall have a positive impact on signal quality.
✅ Sensitivity is now controlled by three linked parameters, Sens 1–3.
✅ The statistics panel has been redesigned: we now display information only for the current trading instrument, which reduces the load on the terminal.
✅ Removed drawing of arrows on past history. Signals are now generated only in real time, taking into account impulses and price behavior. This makes the signals more honest and realistic.

👇 Try it now:

https://www.mql5.com/en/market/product/156185
Konstantin Chechnev Prodotto pubblicato

Indicatore di segnali per opzioni binarie, che può essere applicato in modo efficace anche sul Forex e su altri mercati. È adatto al trading a griglia di breve periodo su M1–M5 e include segnali per l’aumento graduale delle posizioni. L’indicatore utilizza un’adattività a due livelli: un profilo di velocità di base (impostazione “veloce/morbido” fin dall’inizio) e un’auto-adattamento basato sui risultati delle operazioni, che regola i filtri in base al mercato corrente tenendo conto delle serie

Konstantin Chechnev
Konstantin Chechnev
In the previous post I talked about market phases — trend, flat, impulse.
There’s another quiet problem that eats money and time:

during the day you’re away from the screen — a good trend is missed

you open the terminal in the evening — half of the move is already gone

you scroll through symbols: one is just noise, on another the “train has left”, on the third it’s unclear whether it’s worth touching at all

And every time it’s the same: lots of charts, very few clear decisions.

🧩 Solution: don’t try to see everything — filter the best

Things get much easier when you have a tool that:

collects statistics of its own signals across different symbols

shows where the model actually performs well, and where the market just doesn’t fit it

helps you see on which symbols trends are “alive” right now, and where it’s nothing but chop

In my own toolkit, this role is covered by Adaptive NeuroMatrix Trend (MT5):
it doesn’t just draw phases (trend / flat / impulse), it also keeps a numeric history — by instruments and by time. In essence, it helps quickly answer:

“On which pairs/instruments does this approach make sense today, and which ones are better to skip?”

💡 Benefit for the trader

This approach gives several tangible advantages:

fewer pointless trades on “favorite but dead” instruments

focus only on the symbols where your logic actually works

a clear reason why you picked these specific 3–5 instruments out of the whole list

stats not in a notebook and not “from memory”, but right inside the indicator

If you want to see how such filtering looks in practice, you can run Adaptive NeuroMatrix Trend (MT5) in the tester on your own instrument list:

Adaptive NeuroMatrix Trend (MT5)
https://www.mql5.com/ru/market/product/155563
Konstantin Chechnev
Konstantin Chechnev
Indicator: Adaptive NeuroMatrix Trend (MT5)
https://www.mql5.com/ru/market/product/155563
Have you ever seen a “perfect” indicator in the tester and a totally different story on a live chart?
Most of the time it’s because of repainting – signals look great on history, but in real time they change after the fact 😤

Adaptive NeuroMatrix Trend was built specifically to avoid that. It’s a price-action based trend indicator that works **only on bar close**, so what you see in real time is exactly what will stay on the chart 💹

What it helps you see:
🔵 when buyers dominate (bullish phase)
🔴 when sellers dominate (bearish phase)
⚪ when the market is basically flat and better to stay out or take profit
🟡🟠 impulse zones that may lead to a reversal or at least to a pause in the current move

Inside, it combines smoothing, volatility and statistics to cut out random noise and leave a clean, readable structure of trend / flat / impulse ✅

You can tune its behavior to match your style:
⏱ adjust reaction speed vs. smoothness
🎯 make entries more conservative or more aggressive
🚫 suppress random spikes and noisy bars
🧠 enable a predictive layer that helps to catch trend phase shifts a bit earlier

Possible uses in a trading plan:
🧭 trend filter for your existing strategies and EAs
🔎 quick scan of symbols to see where a real move is happening right now
📌 spotting exit and re-entry areas after strong impulses

If you’re tired of indicators that “know the future” only on history and want a clearer view of who’s in control – buyers, sellers or nobody – take a look at Adaptive NeuroMatrix Trend, run it in the Strategy Tester on your own symbols and timeframes, and see how it behaves in your approach 📉📊

Page of the indicator:
https://www.mql5.com/ru/market/product/155563
Konstantin Chechnev
Konstantin Chechnev
👉 Adaptive NeuroMatrix Trend on MQL5:
[https://www.mql5.com/ru/market/product/155563](https://www.mql5.com/ru/market/product/155563)

🚀 Adaptive NeuroMatrix Trend — price-action indicator with NO repainting 💹

Traders constantly face the same problems: lagging signals from classic MA/RSI/MACD, noisy breakouts, and indicators that repaint on history 😤
Adaptive NeuroMatrix Trend solves this with its own price-action model of price movement (not based on standard MT5 indicators) and works strictly on bar close, so there is NO repainting ✅

📈 What the indicator shows in a separate window:
🔵 Buy phase — bullish trend dominant
⚪ Flat / Exit — better to stay out or lock in profit
🔴 Sell phase — bearish trend dominant
🟡🟠 Gold/orange segments — impulse spikes and early warnings of potential reversals

✨ Key features:
✅ No repainting — signals are formed only at bar close; the picture does not change afterwards.
⚙️ Flexible tuning to your trading style via parameters:
⏱ Time-scale — reaction speed vs. smoothing
🎯 Entry sensitivity — how aggressively to enter
🚫 Anti-impulse strength — filters out noisy spikes
🧠 Predict layer strength — predictive smoothing of trend turns

🧩 Trend / flat / impulse separation — the internal algorithm combines smoothing filters, volatility and statistics to cut market “chop” and leave a clear trend structure.

📊 Built-in performance statistics:
📌 Cumulative result for the current symbol
🧾 Efficiency over the last 8 instruments
⏳ Tracking over a selected window in days — you immediately see where the model works best.

💡 How traders can use it:
🧭 As a trend filter for existing strategies and EAs
🔍 For pre-session instrument selection — finding “clean” trending symbols
📌 For spotting exit and re-entry zones after strong impulses

👇 Try it now:

Go to Adaptive NeuroMatrix Trend on MQL5, download the indicator and run it in the Strategy Tester on your favorite symbols and timeframes 🧪📉📊
If the results match your style — confidently add it to your trading setup as your main trend filter and statistics assistant 💼💰

➡️ Download Adaptive NeuroMatrix Trend:
[https://www.mql5.com/ru/market/product/155563](https://www.mql5.com/ru/market/product/155563)
Konstantin Chechnev Prodotto pubblicato

Correlation Monitor è un indicatore per individuare rapidamente le relazioni tra strumenti: aiuta a trovare coppie con forte correlazione positiva/negativa, a individuare divergenze e a prendere decisioni più informate per copertura, pair trading e trading a paniere. Meta traider 5. Caratteristiche principali • Matrice di correlazione e elenco compatto: mostra istantaneamente l’intensità del legame tra i simboli selezionati; la codifica a colori ne facilita la lettura. • Mini‑grafico dello

Konstantin Chechnev Prodotto pubblicato

Correlation Monitor è un indicatore per individuare rapidamente le relazioni tra strumenti: aiuta a trovare coppie con forte correlazione positiva/negativa, a individuare divergenze e a prendere decisioni più informate per copertura, pair trading e trading a paniere. Meta traider 4. Caratteristiche principali • Matrice di correlazione e elenco compatto: mostra istantaneamente l’intensità del legame tra i simboli selezionati; la codifica a colori ne facilita la lettura. • Mini‑grafico dello

123