Young Ho Seo / Profil
- Information
|
11+ Jahre
Erfahrung
|
62
Produkte
|
1205
Demoversionen
|
|
4
Jobs
|
0
Signale
|
0
Abonnenten
|
Harmonic Pattern Indicator - Repainting + Japanese Candlestick Pattern Scanner + Automatic Channel + Many more
https://www.mql5.com/en/market/product/4488
https://www.mql5.com/en/market/product/4475
https://algotrading-investment.com/portfolio-item/harmonic-pattern-plus/
Non Repainting and Non Lagging Harmonic Pattern Indicator – Customizable Harmonic + Japanese Candlestic Pattern Scanner + Advanced Channel + Many more
https://www.mql5.com/en/market/product/41993
https://www.mql5.com/en/market/product/41992
https://algotrading-investment.com/portfolio-item/profitable-pattern-scanner/
Supply Demand Indicator – Multiple Timeframe Scanning Added + Non Repainting + Professional Indicator
https://www.mql5.com/en/market/product/40076
https://www.mql5.com/en/market/product/40075
https://algotrading-investment.com/portfolio-item/ace-supply-demand-zone/
Momentum Indicator – Path to Volume Spread Analysis
https://www.mql5.com/en/market/product/30641
https://www.mql5.com/en/market/product/30621
https://algotrading-investment.com/portfolio-item/excessive-momentum-indicator/
Elliott Wave Indicator for the Power User
https://www.mql5.com/en/market/product/16479
https://www.mql5.com/en/market/product/16472
https://algotrading-investment.com/portfolio-item/elliott-wave-trend/
Forex Prediction - Turn Support and Resistance to the Advanced Strategy
https://www.mql5.com/en/market/product/49170
https://www.mql5.com/en/market/product/49169
https://algotrading-investment.com/portfolio-item/fractal-pattern-scanner/
MetaTrader 4 and MetaTrader 5 Product Page: https://www.mql5.com/en/users/financeengineer/seller#products
Free Forex Prediction with Fibonacci Analysis: https://algotrading-investment.com/2020/10/23/forex-prediction-with-fibonacci-analysis/
Free Harmonic Pattern Signal: https://algotrading-investment.com/2020/12/17/harmonic-pattern-signal-for-forex-market/
============================================================================================================================
Here are the trading education books. We recommend reading these books if you are a trader or investor in Forex and Stock market. In the list below, we put the easy to read book on top. Try to read the easy to read book first and try to read the harder book later to improve your trading and investment.
First Link = amazon.com, Second Link = Google Play Books, Third Link = algotrading-investment.com, Fourth Link = Google Books
Technical Analysis in Forex and Stock Market (Supply Demand Analysis and Support Resistance)
https://www.amazon.com/dp/B09L55ZK4Z
https://play.google.com/store/books/details?id=pHlMEAAAQBAJ
https://algotrading-investment.com/portfolio-item/technical-analysis-in-forex-and-stock-market/
https://books.google.co.kr/books/about?id=pHlMEAAAQBAJ
Science Of Support, Resistance, Fibonacci Analysis, Harmonic Pattern, Elliott Wave and X3 Chart Pattern (In Forex and Stock Market Trading)
https://www.amazon.com/dp/B0993WZGZD
https://play.google.com/store/books/details?id=MME3EAAAQBAJ
https://algotrading-investment.com/portfolio-item/science-of-support-resistance-fibonacci-analysis-harmonic-pattern/
https://books.google.co.kr/books/about?id=MME3EAAAQBAJ
Profitable Chart Patterns in Forex and Stock Market (Fibonacci Analysis, Harmonic Pattern, Elliott Wave, and X3 Chart Pattern)
https://www.amazon.com/dp/B0B2KZH87K
https://play.google.com/store/books/details?id=7KrQDwAAQBAJ
https://algotrading-investment.com/portfolio-item/profitable-chart-patterns-in-forex-and-stock-market/
https://books.google.com/books/about?id=7KrQDwAAQBAJ
Guide to Precision Harmonic Pattern Trading (Mastering Turning Point Strategy for Financial Trading)
https://www.amazon.com/dp/B01MRI5LY6
https://play.google.com/store/books/details?id=8SbMDwAAQBAJ
http://algotrading-investment.com/portfolio-item/guide-precision-harmonic-pattern-trading/
https://books.google.com/books/about?id=8SbMDwAAQBAJ
Scientific Guide to Price Action and Pattern Trading (Wisdom of Trend, Cycle, and Fractal Wave)
https://www.amazon.com/dp/B073T3ZMBR
https://play.google.com/store/books/details?id=5prUDwAAQBAJ
https://algotrading-investment.com/portfolio-item/scientific-guide-to-price-action-and-pattern-trading/
https://books.google.com/books/about?id=5prUDwAAQBAJ
Predicting Forex and Stock Market with Fractal Pattern: Science of Price and Time
https://www.amazon.com/dp/B086YKM8BW
https://play.google.com/store/books/details?id=VJjiDwAAQBAJ
https://algotrading-investment.com/portfolio-item/predicting-forex-and-stock-market-with-fractal-pattern/
https://books.google.com/books/about?id=VJjiDwAAQBAJ
Trading Education Book 1 in Korean (Apple, Google Play Book, Google Book, Scribd, Kobo)
https://books.apple.com/us/book/id1565534211
https://play.google.com/store/books/details?id=HTgqEAAAQBAJ
https://books.google.co.kr/books/about?id=HTgqEAAAQBAJ
https://www.scribd.com/book/505583892
https://www.kobo.com/ww/en/ebook/8J-Eg58EDzKwlpUmADdp2g
Trading Education Book 2 in Korean (Apple, Google Play Book, Google Book, Scribd, Kobo)
https://books.apple.com/us/book/id1597112108
https://play.google.com/store/books/details?id=shRQEAAAQBAJ
https://books.google.co.kr/books/about?id=shRQEAAAQBAJ
https://www.scribd.com/book/542068528
https://www.kobo.com/ww/en/ebook/X8SmJdYCtDasOfQ1LQpCtg
About Young Ho Seo
Young Ho Seo is an Engineer, Financial Trader, and Quantitative Developer, working on Trading Science and Investment Engineering since 2011. He is the creator of many technical indicators, price patterns and trading strategies used in the financial market. He is also teaching the trading practice on how to use the Supply Demand Analysis, Support, Resistance, Trend line, Fibonacci Analysis, Harmonic Pattern, Elliott Wave Theory, Chart Patterns, and Probability for Forex and Stock Market. His works include developing scientific trading principle and mathematical algorithm in the work of Benjamin Graham, Everette S. Gardner, Benoit Mandelbrot, Ralph Nelson Elliott, Harold M. Gartley, Richard Shabacker, William Delbert Gann, Richard Wyckoff and Richard Dennis. You can find his dedicated works on www.algotrading-investment.com . His life mission is to connect financial traders and scientific community for better understanding of this world and crowd behaviour in the financial market. He wrote many books and articles, which are helpful for understanding the technology and application behind technical analysis, statistics, time series forecasting, fractal science, econometrics, and artificial intelligence in the financial market.
If you are interested in our software and training, just visit our main website: www.algotrading-investment.com
Young Ho Seo
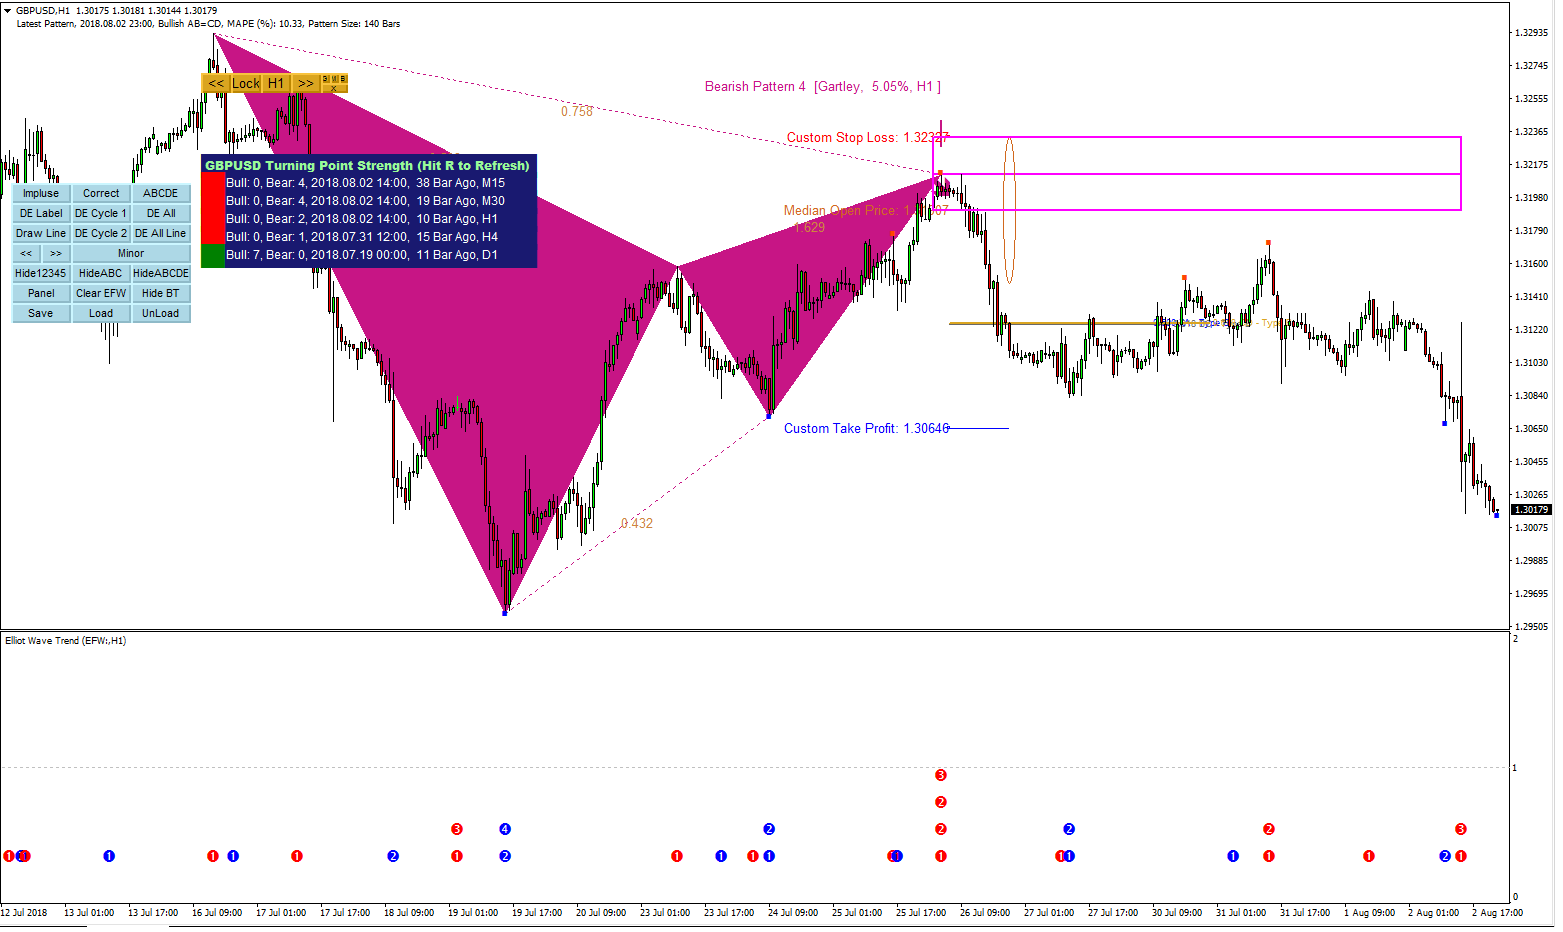
GBPUSD Market Outlook- 2 Aug 2018
GBPUSD is still strongly influenced by bearish move. The bearish Gartley pattern runs around 200 pips down last few days.
http://algotrading-investment.com/
https://www.mql5.com/en/users/financeengineer/seller#products
GBPUSD is still strongly influenced by bearish move. The bearish Gartley pattern runs around 200 pips down last few days.
http://algotrading-investment.com/
https://www.mql5.com/en/users/financeengineer/seller#products

Young Ho Seo
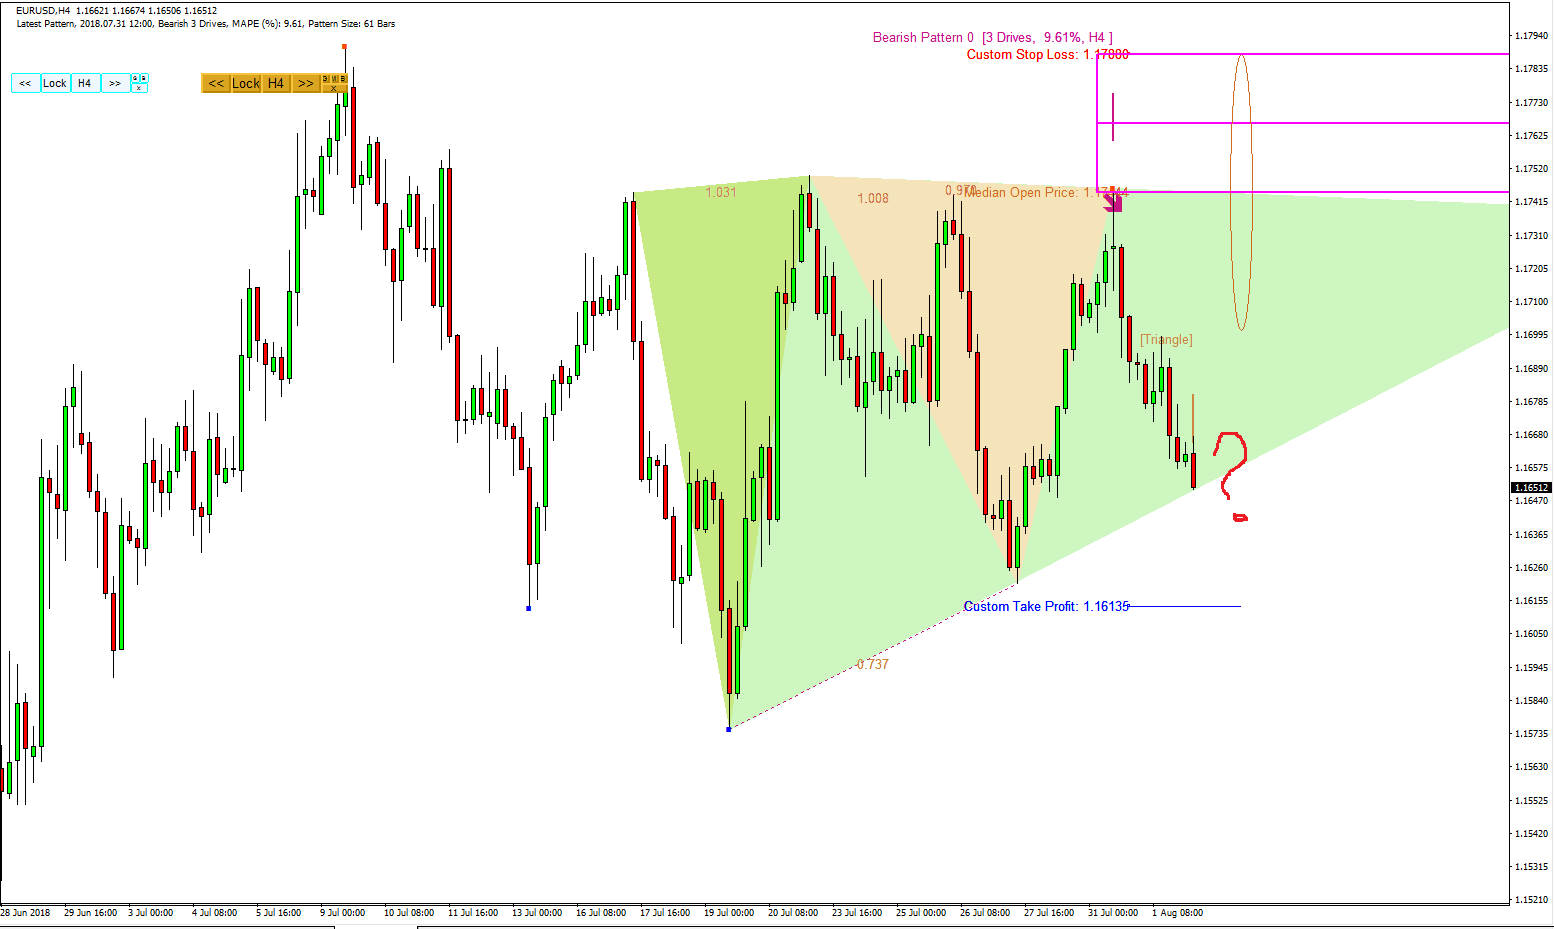
EURUSD Market Outlook - 2 Aug 2018
EURUSD drop nearly 100 pips after the formation of 3 Drives patterns. The bearish action driven to form the triangle pattern at the moment. Watch out the price action around the bottom of the triangle (detected by Price Breakout pattern Scanner). Make sure that you are locking the pattern before using them.
http://algotrading-investment.com/
https://www.mql5.com/en/users/financeengineer/seller#products

Young Ho Seo
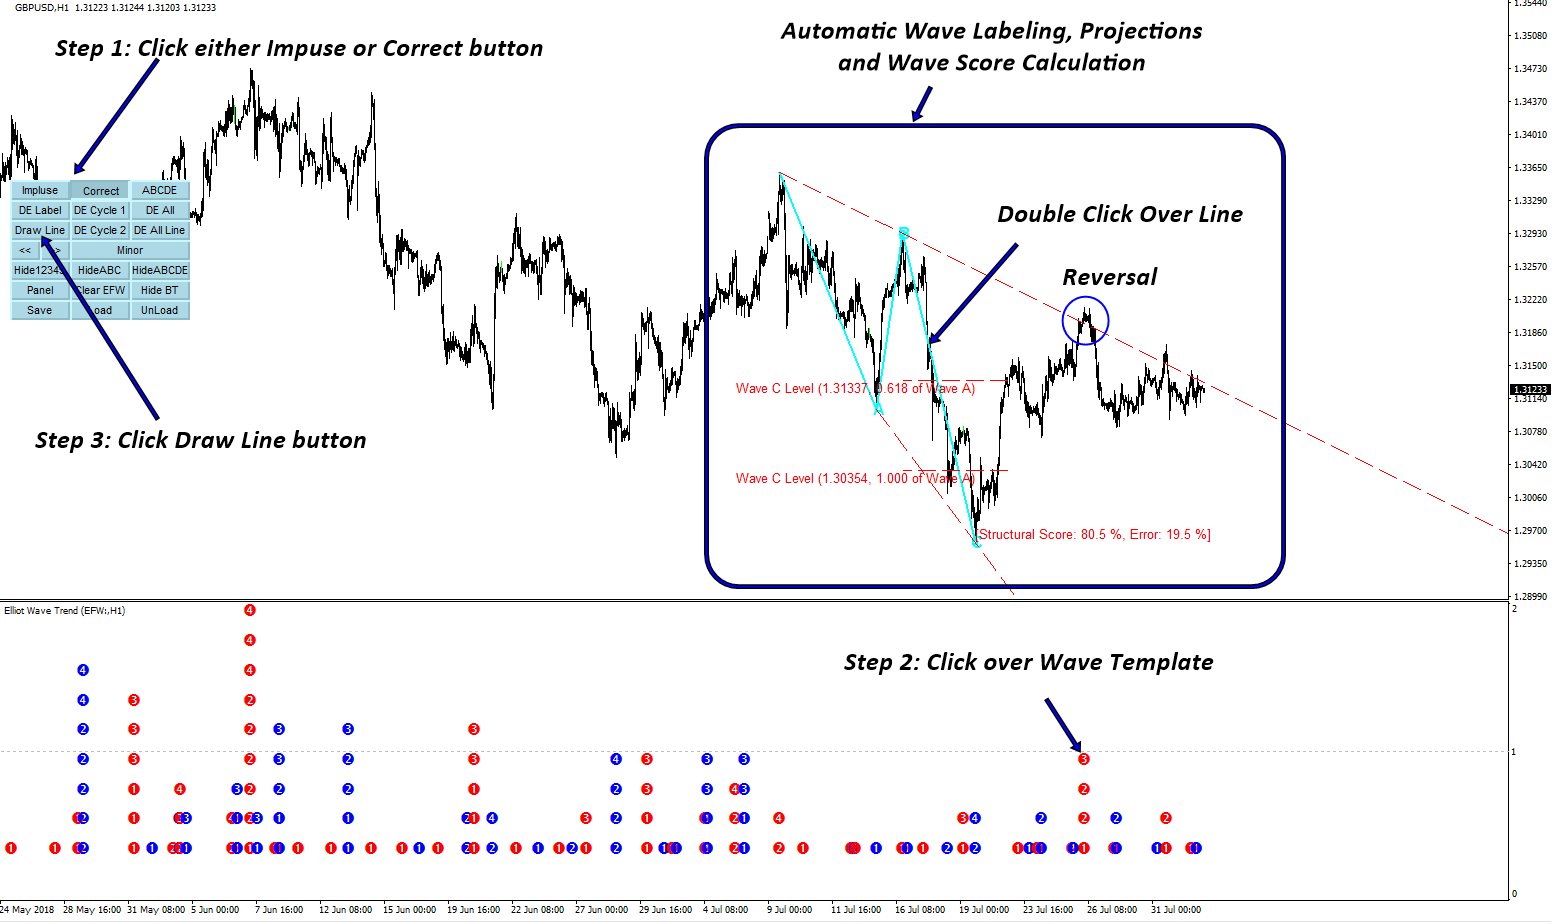
Elliott Wave Trend-Basic Tutorial 1
Elliott Wave Trend provide you a lot of features for your trading. Of course many automatic analysis too. Elliott Wave Trend consists of the following features:
Turning point strength
Turning Point strength Indicator for multiple time frame scanning
Automatic Wave Analysis with Template and Pattern Approach
Manual Wave Analysis with Template and Pattern Approach
Wave Analysis saving and sharing System
This tutorial is not necessarily covering everything. But this tutorial will try to give some intuition over the automatic Wave Analysis. Automatic Wave Analysis is based on the template and pattern approach described in the book: Financial Trading with Five Regularities of Nature (Scientific Guide to Price Action and Pattern Trading).
Steps to perform the automatic wave analysis.
For Automatic Wave Analysis, you can only perform with Impulse and Corrective Waves.
Click either Impulse or Correct button
Click any wave template in the sub window (i.e. small blue and red circles).
Click Draw Line button.
Use either position rule or Wave Score to accept and to reject your analysis.
Your trading will be based on the levels and turning point projected from your analysis.
When you want to set any trading alert after you analysis, use our free Auto Chart Alert.
http://algotrading-investment.com/portfolio-item/auto-chart-alert/
Here are the links for Elliott Wave Trend.
http://algotrading-investment.com/portfolio-item/elliott-wave-trend/
https://www.mql5.com/en/market/product/16479
https://www.mql5.com/en/market/product/16472
If you need more complete tutorial on this, visit this link:
http://tradeinvestsmart.com/2018/03/how-elliott-wave-can-improve-your-trading-performance/

Young Ho Seo
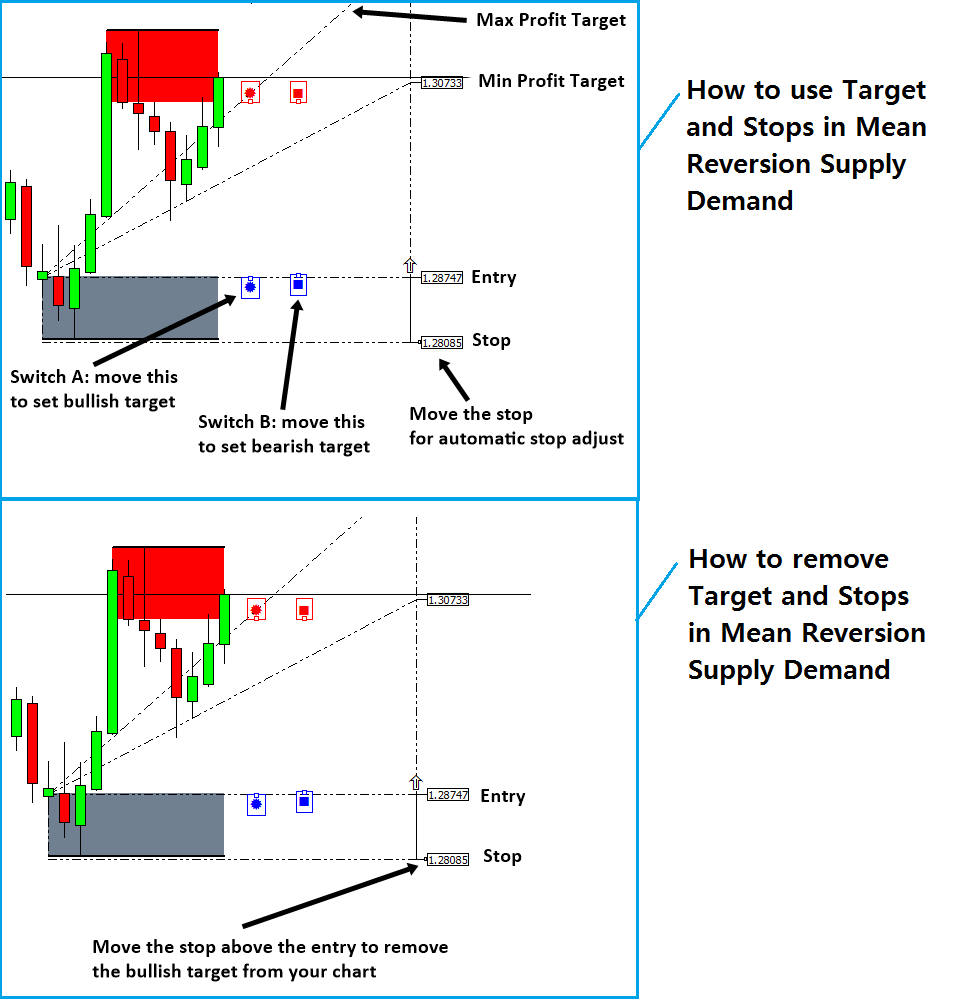
Mean Reversion Supply Demand – How to Remove Targets
One of the greatest advantage of Mean Reversion Supply Demand is that it provide a flexible Profit and stop target for your trading. After you have learnt how to use this profit targets, now you want to learn how to remove them. Of course, there is a way to remove them. The trick is simply moving the stop text above the Entry text (for the case of buy). You will do the opposite for the case of sell. In the screenshot, the bottom image describe how to remove the targets from your chart.
http://algotrading-investment.com/
https://www.mql5.com/en/users/financeengineer/seller#products

Young Ho Seo
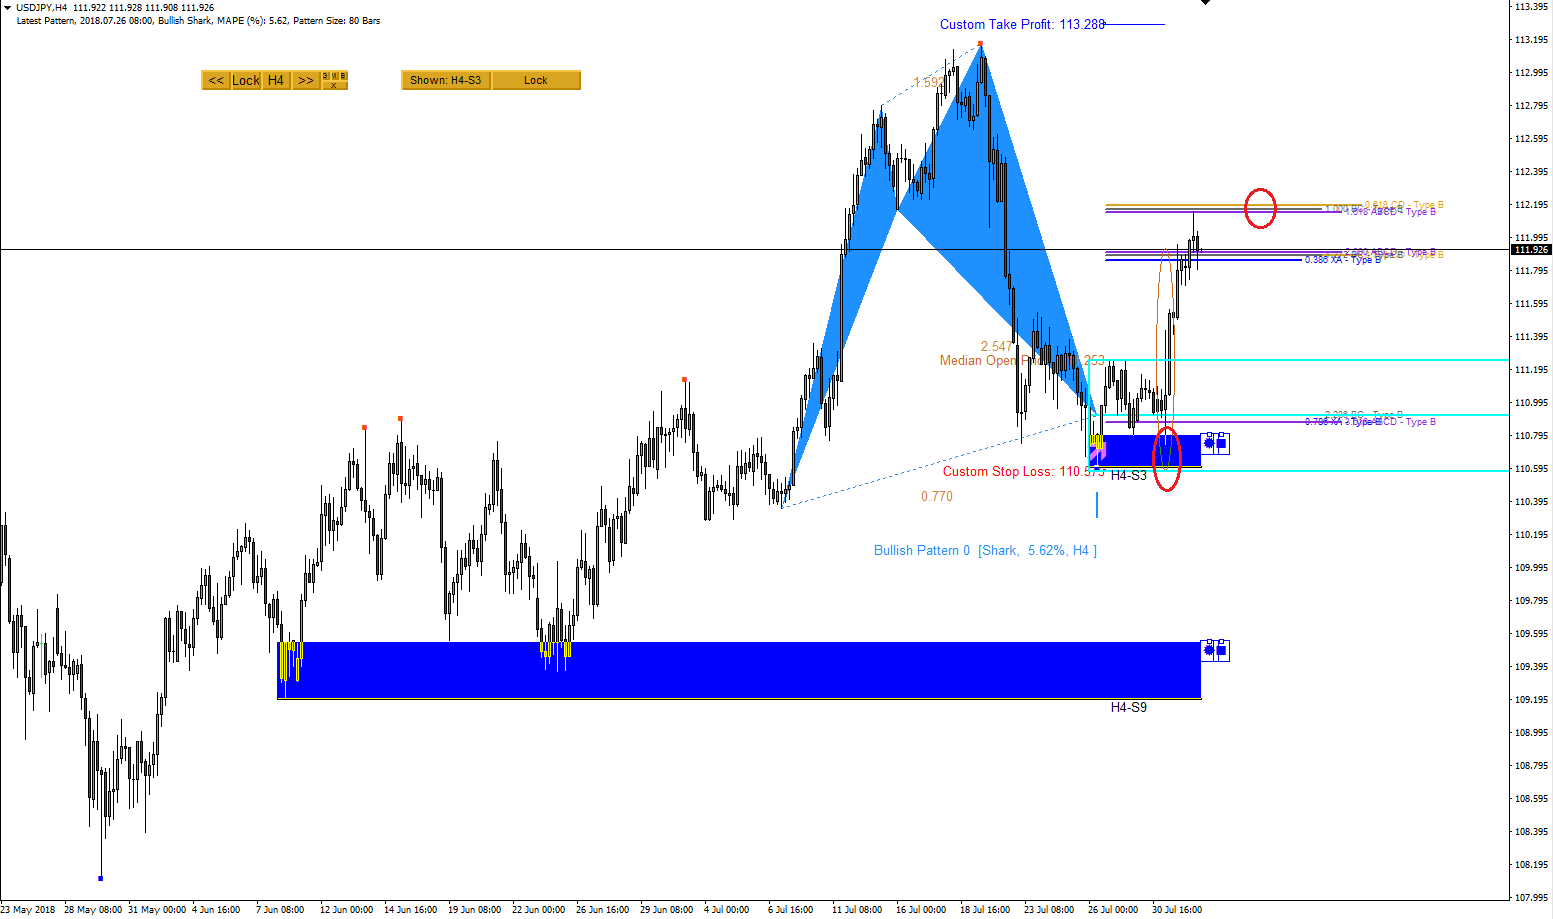
USDJPY Market Outlook – 1 Aug 2018
USDJPY is slow at the moment. USDJPY tested the second PRZ Type B levels. USDJPY retraced as soon as it touched the second PRZ Type B level.
http://algotrading-investment.com/
https://www.mql5.com/en/users/financeengineer/seller#products
USDJPY is slow at the moment. USDJPY tested the second PRZ Type B levels. USDJPY retraced as soon as it touched the second PRZ Type B level.
http://algotrading-investment.com/
https://www.mql5.com/en/users/financeengineer/seller#products

Young Ho Seo
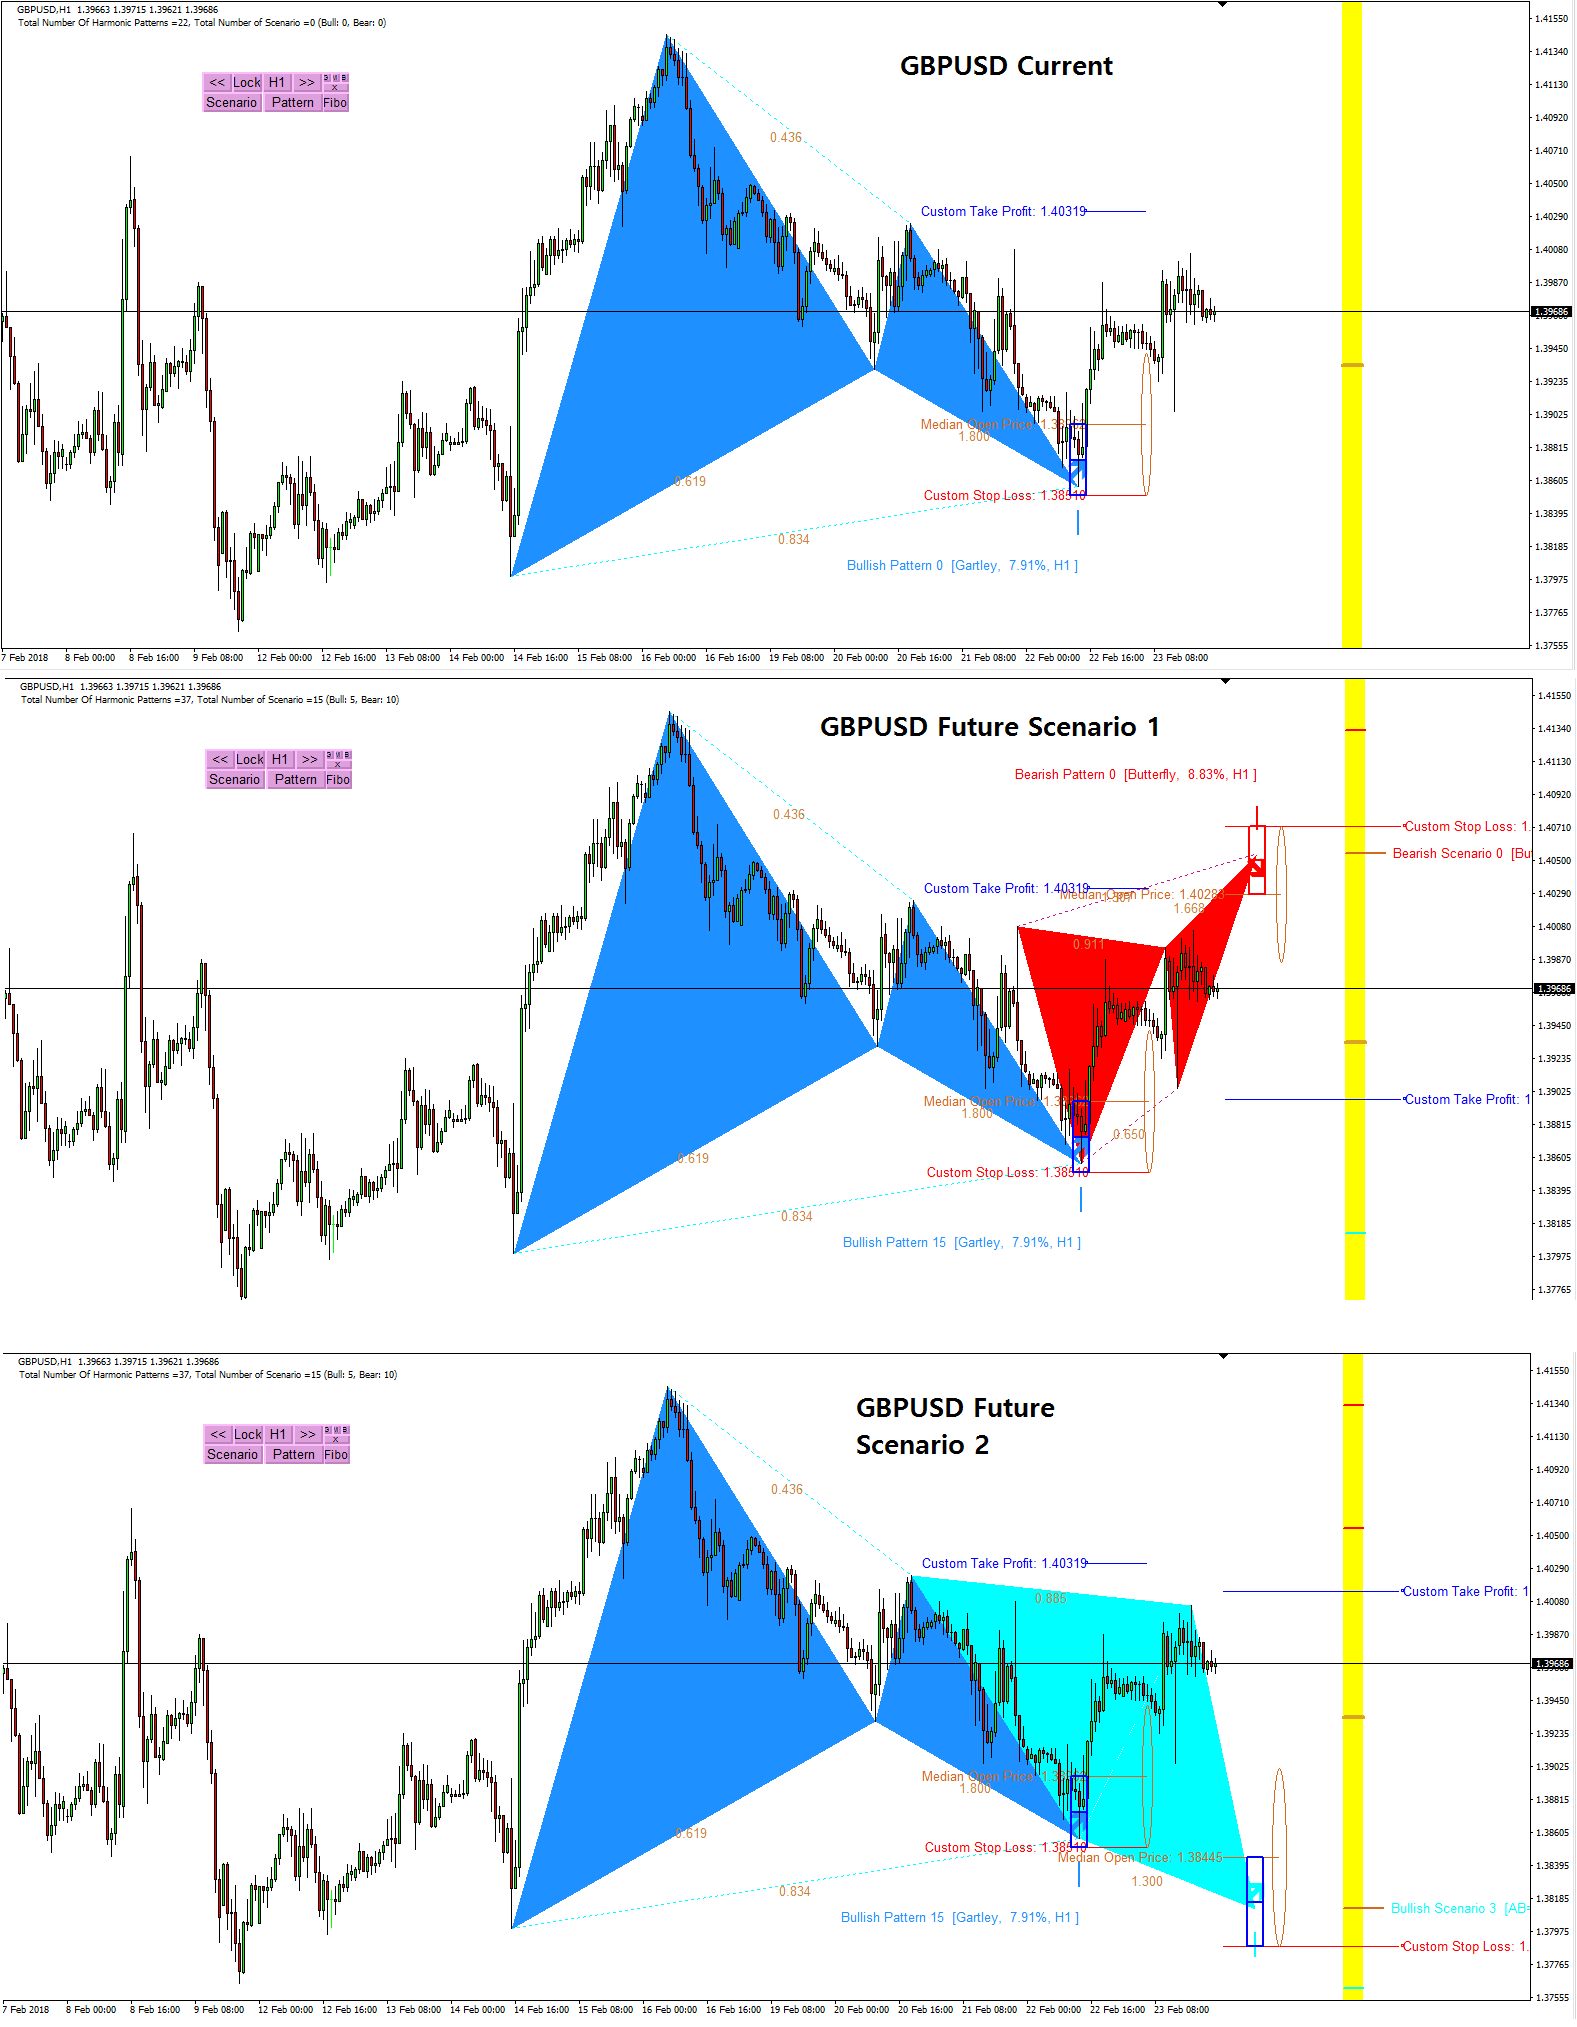
Scan and search future harmonic patterns with Harmonic Pattern Scenario Planner
Harmonic Pattern Scenario Planner is a tool you can scan and search future harmonic patterns in just one button click. It would detect any potential future harmonic patterns in your search range. You can even get the potential take profit and stop loss of the future patterns even before they form. What is even more, you can use all the features and functionality of harmonic pattern plus from your harmonic pattern scenario planner too. Harmonic Pattern Scenario Planner is also compatible with our Harmonic Pattern Order EA.
Have watched this interesting movie called “Next” ? Check out the guy can see the few minutes into the futures. How powerful the 2 minutes vision for future is. Predicting future is very tactical game but it is hard because future keep changing based on the presents. However, it is definitely an interesting game. As a trader, you can gain a lot of advantage over other traders by predicting futures.
http://www.imdb.com/title/tt0435705/
We are only one selling the future predictive harmonic pattern scanner.
http://algotrading-investment.com/portfolio-item/harmonic-pattern-scenario-planner/
https://www.mql5.com/en/market/product/6101
https://www.mql5.com/en/market/product/6240

Young Ho Seo
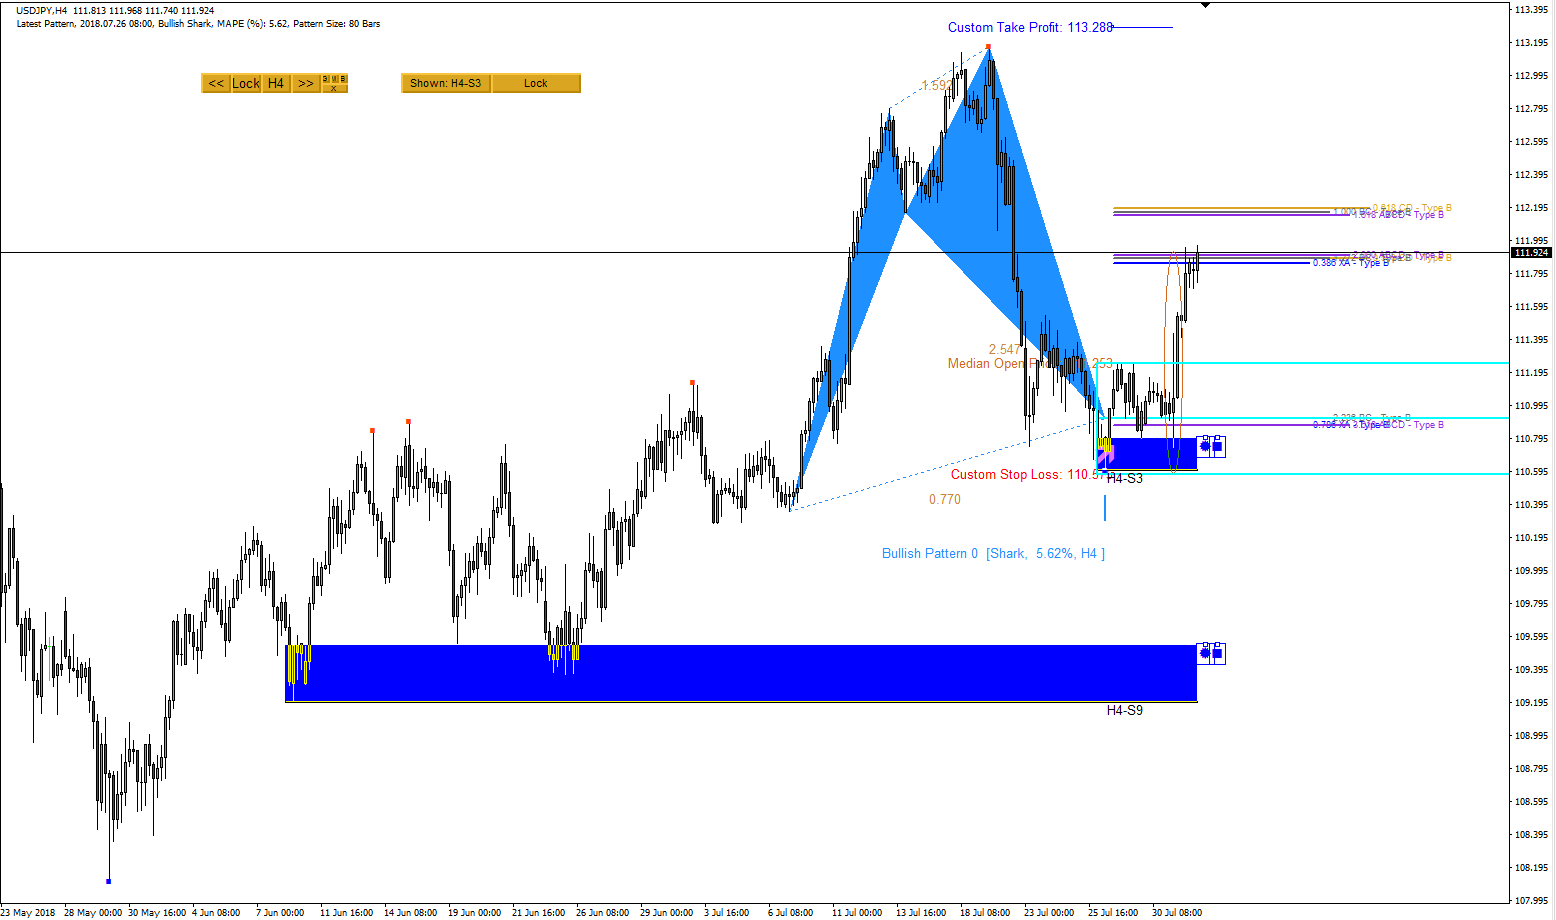
USDJPY Market Outlook-1 Aug 2018
USDJPY enjoy its bullish movement after the formation of Shark pattern. Point D of shark pattern coincided with demand zone. The retracement to the Zone served as the good entry for the second time. Currently, USDJPY is testing the first PRZ Type B level.
http://algotrading-investment.com/
https://www.mql5.com/en/users/financeengineer/seller#products

Young Ho Seo
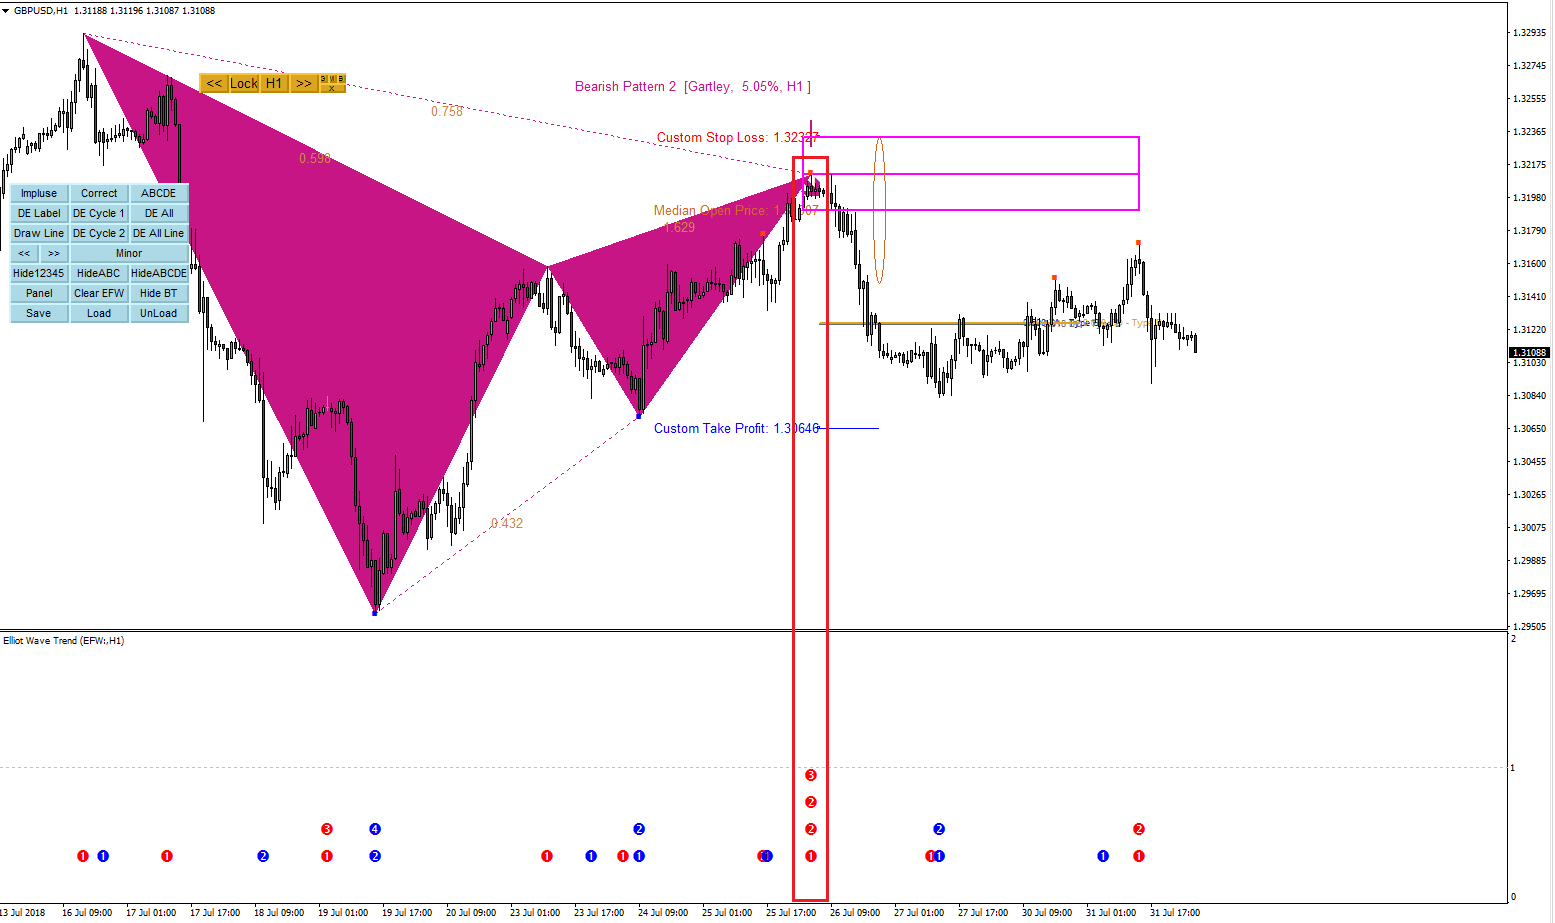
Harmonic Pattern Plus 10.5, Scenario Planner 10.5, Elliott Wave Trend 10.6 Done
Now Update have been completed. So You will find
Harmonic Pattern Plus Version 10.5
Harmonic Pattern Scenario Planner Version 10.5
Elliott Wave Trend Version 10.6
are available from mql5.com and from algotrading-investment.com
Make sure to download the latest version for the best performance.
Enjoy these powerful trading system.
http://algotrading-investment.com/
https://www.mql5.com/en/users/financeengineer/seller#products

Young Ho Seo
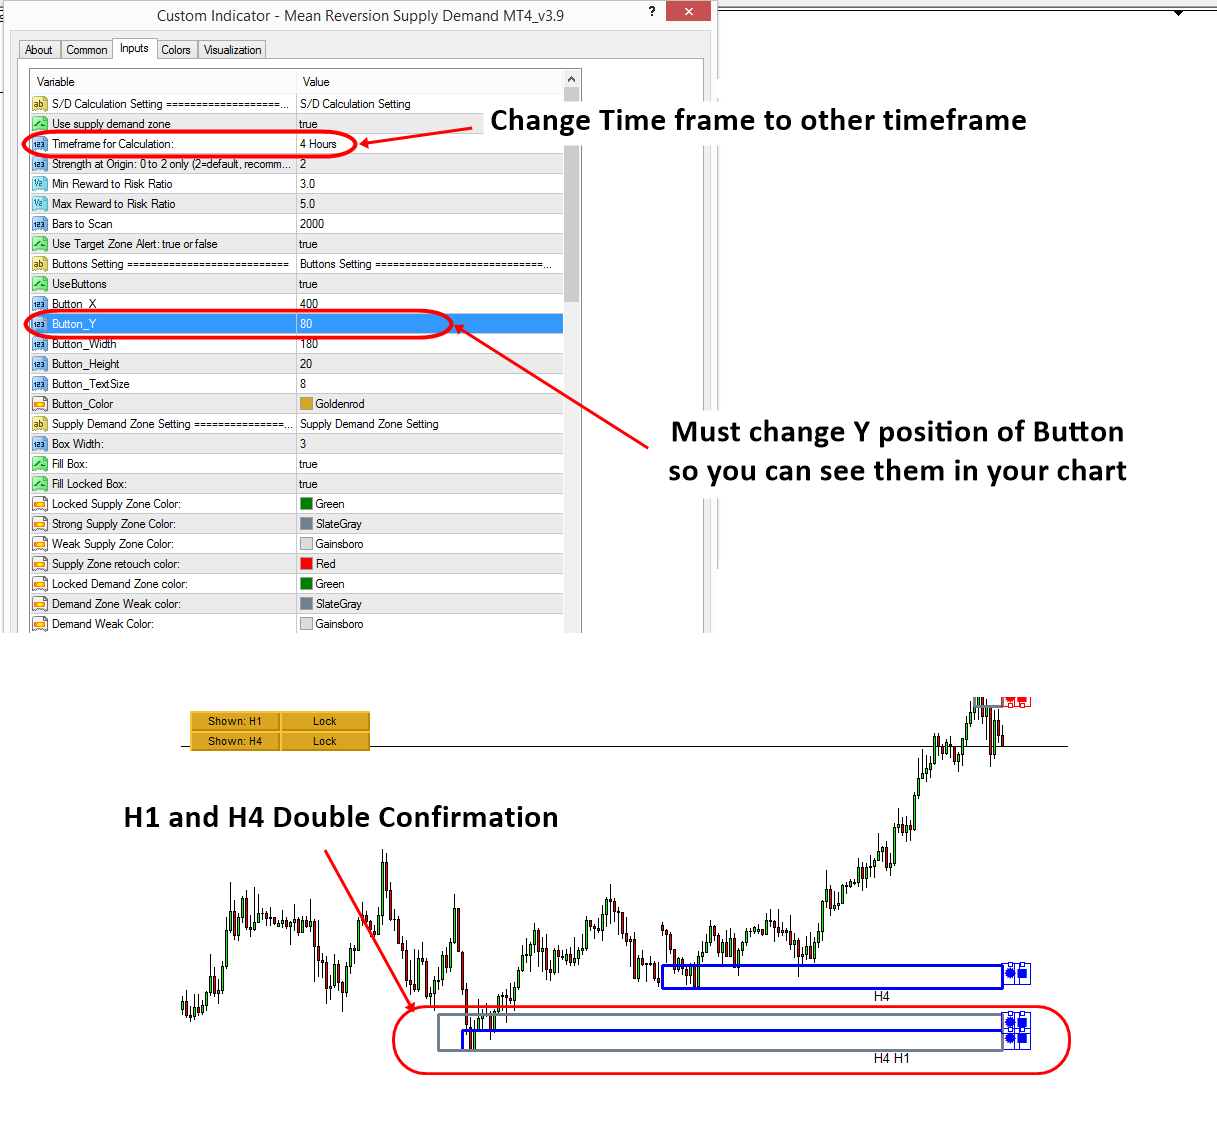
Mean Reversion Supply Demand Multiple TimeFrame analysis
Mean Reversion Supply Demand have a powerful multiple timeframe analysis features in it. It means that you can layout the demand and supply zones from several different timeframe in one single chart. This is very powerful because you can see the confirmation of your trading zones over several timeframe. For example, you can see the demand zone double confirmed from H1 and H4 timeframe in the screenshots.
http://algotrading-investment.com/portfolio-item/mean-reversion-supply-demand/
https://www.mql5.com/en/market/product/16851
https://www.mql5.com/en/market/product/16823

Young Ho Seo
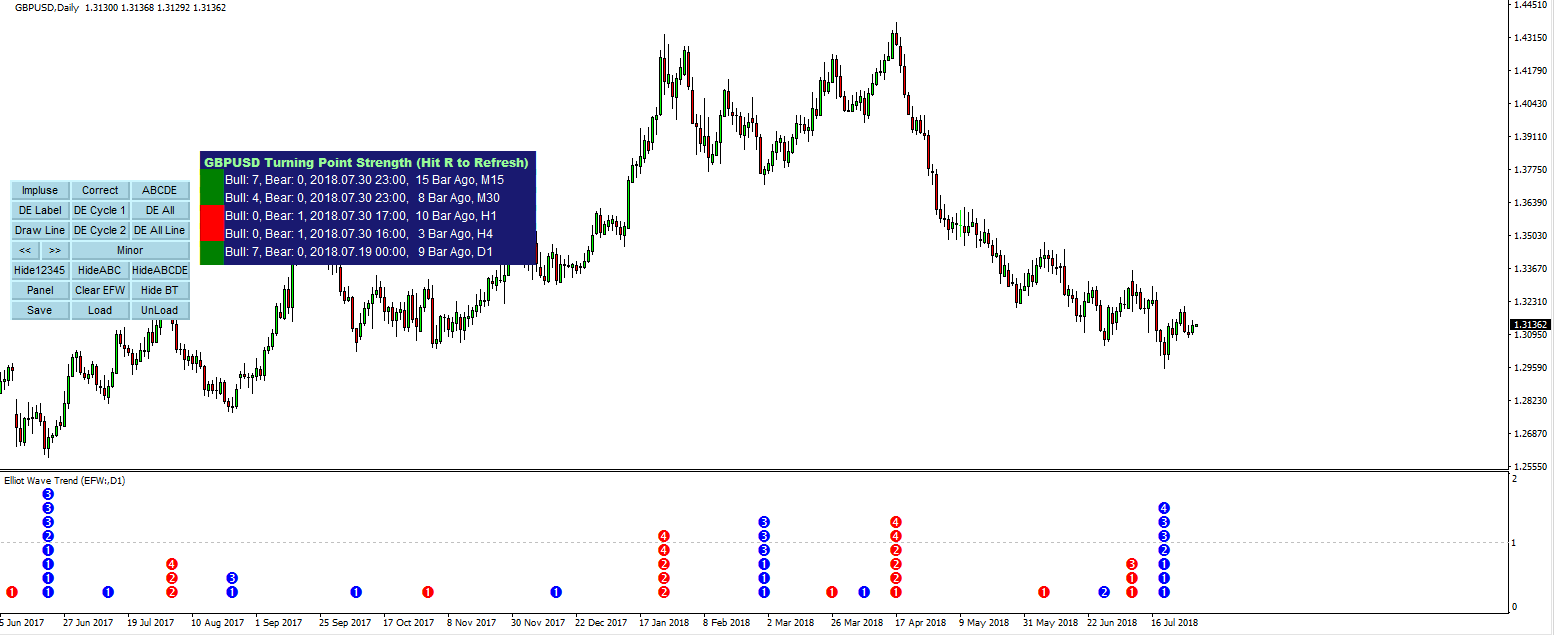
Elliott Wave Trend Version 10.6 updated
We have updated version 10.6 of Elliott Wave Trend. As we have mentioned, we have added Multiple Timeframe pattern detection features to our new Elliott Wave Trend. Update is ready from www.algotrading-investment.com
Elliott Wave is not a fantasy any more. but you can use it with the objective wave counting like Template and Pattern Approach.
Use the automatic installer for fast update. Here is the link to automatic installer:
http://algotrading-investment.com/download/79991/
You can also download new update version 10.6 from your account page too from our website.
http://algotrading-investment.com/portfolio-item/elliott-wave-trend/
On mql5.com, it will take some days to process. So watch out these links.
https://www.mql5.com/en/market/product/16472
https://www.mql5.com/en/market/product/16479

Young Ho Seo
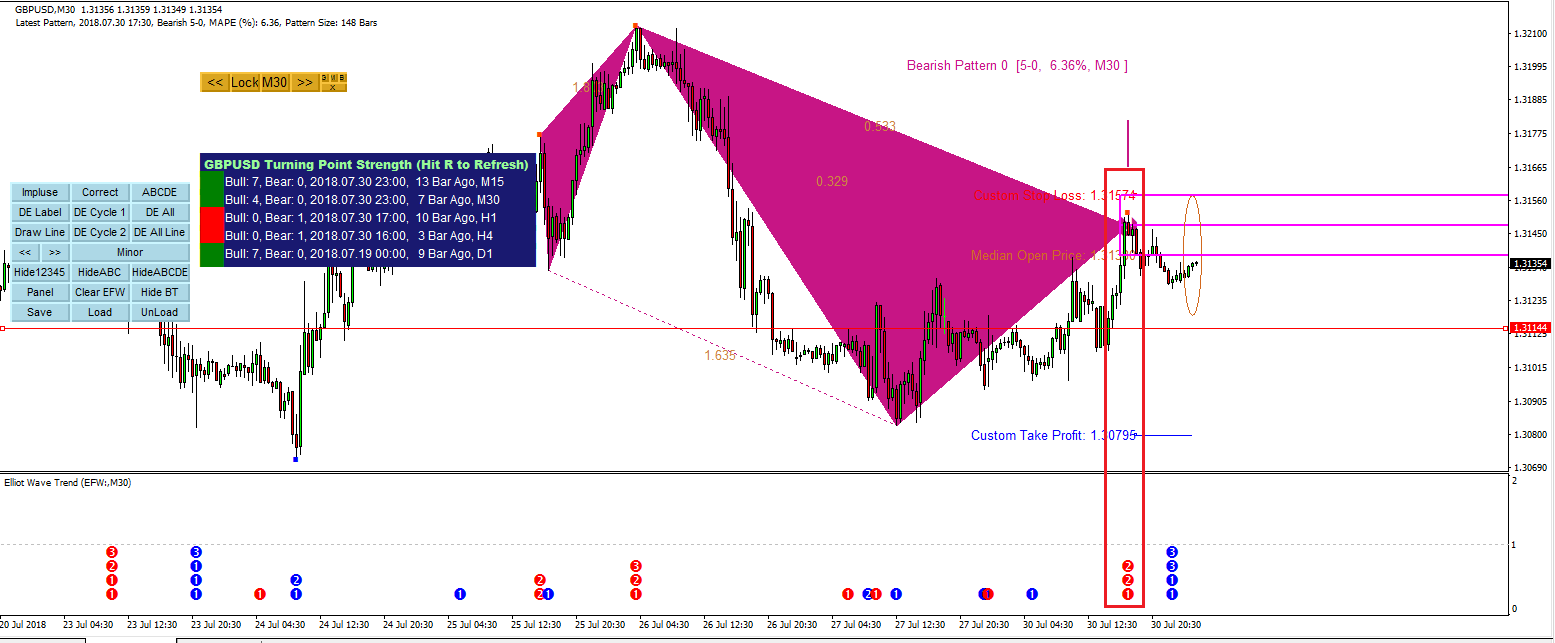
GBPUSD Market Outlook -30 July 2018
Yesterday, GBPUSD made the light bullish movement ( around 23 pips). It is not much so light. This is possibly short term view. GBPUSD made a bearish 5-0 pattern in M15 and M30 timeframe. The pattern coincided with three turning point strength from Elliott Wave Trend. It reacted mildly for around 20 pips so far. If GBPUSD come down near to 1.3144, watch out the price action around this level.
http://algotrading-investment.com/
https://www.mql5.com/en/users/financeengineer/seller#products

Young Ho Seo
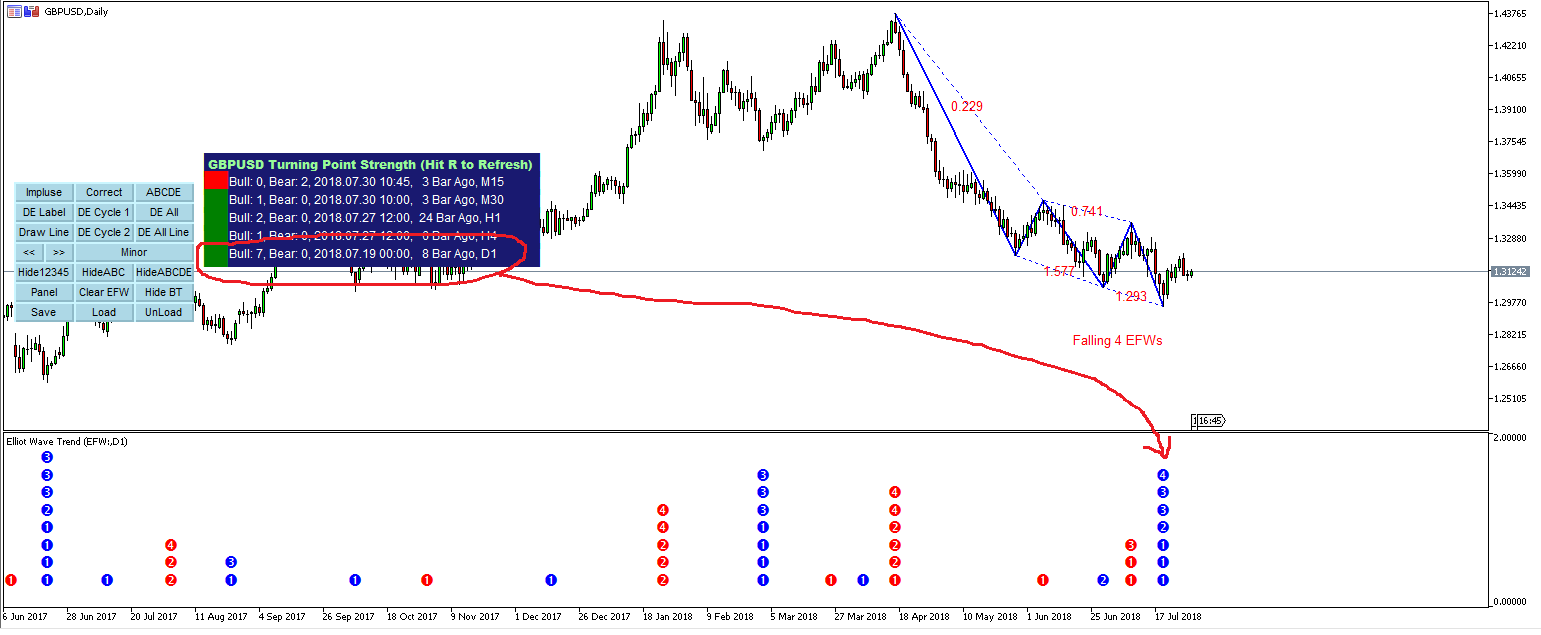
Elliott Wave Trend new version is coming soon
As we have mentioned, we are currently working on our Elliott Wave Trend new version In the new version, Elliott Wave Trend have the feature to scan the turning point strength for all time frame. This will answer you the question when do you we need to analyze the turning point of the market. Enjoy this powerful update.
http://algotrading-investment.com/
https://www.mql5.com/en/users/financeengineer/seller#products

Young Ho Seo
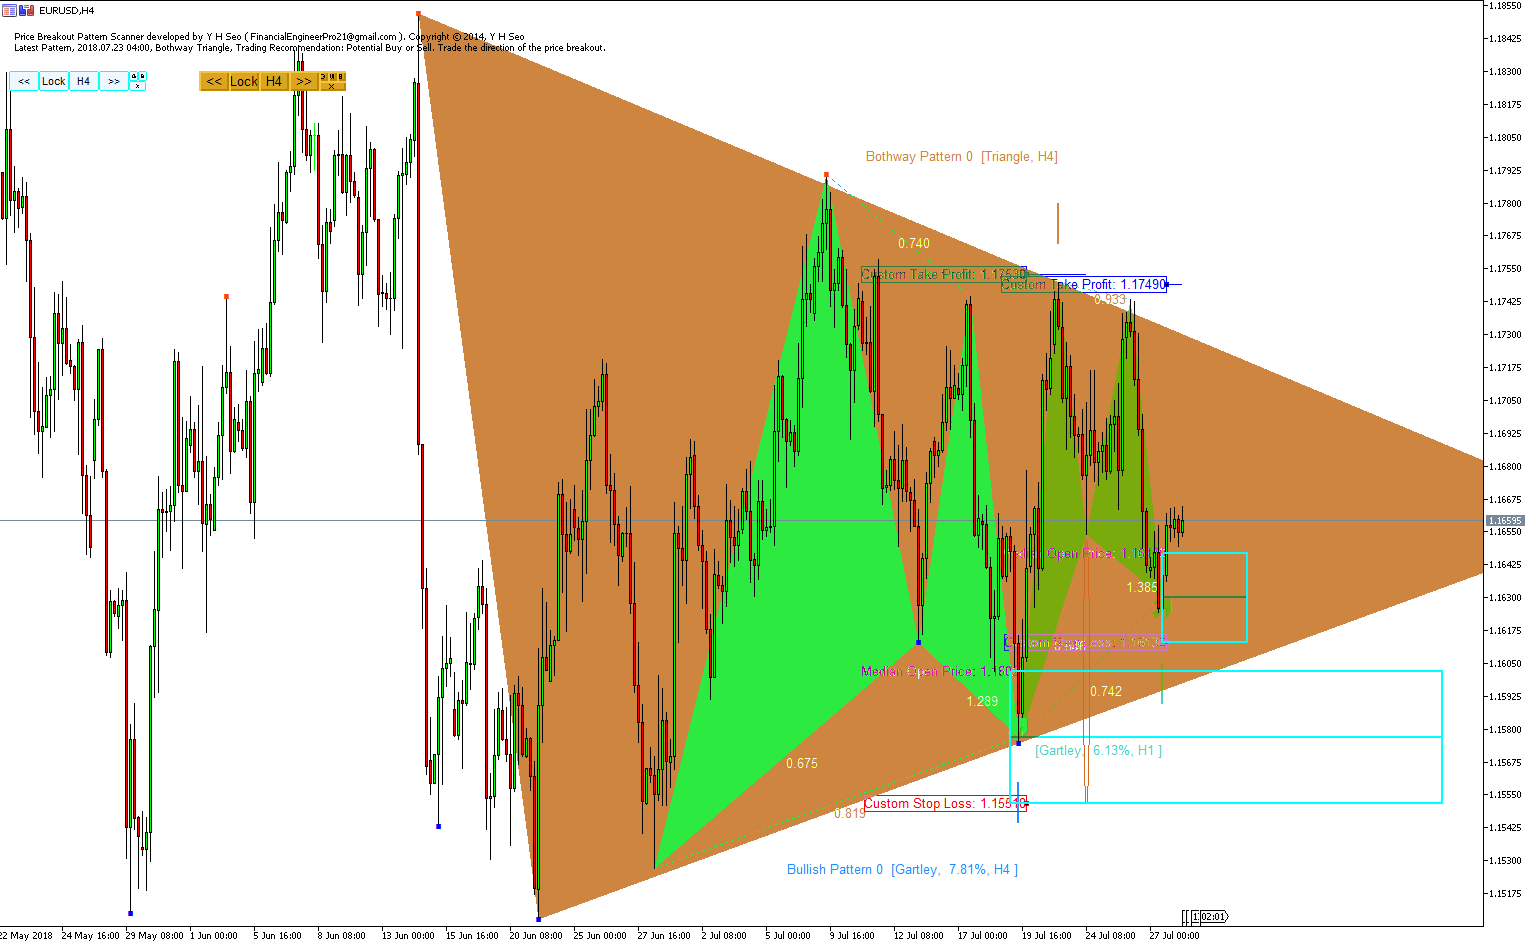
EURUSD Market Outlook- 30 July 2018
Here is the medium term market outlook for EURUSD. As you can see, that two Gartley patterns are fitted inside triangle pattern (detected by Price Breakout Pattern Scanner). Small Gartley patterns are just formed and it is a fresh pattern. EURUSD made around 30 pips with it.
Visit our website for excellent trading and investment tools for your financial freedom.
https://www.mql5.com/en/users/financeengineer/seller#products
http://algotrading-investment.com/

Young Ho Seo
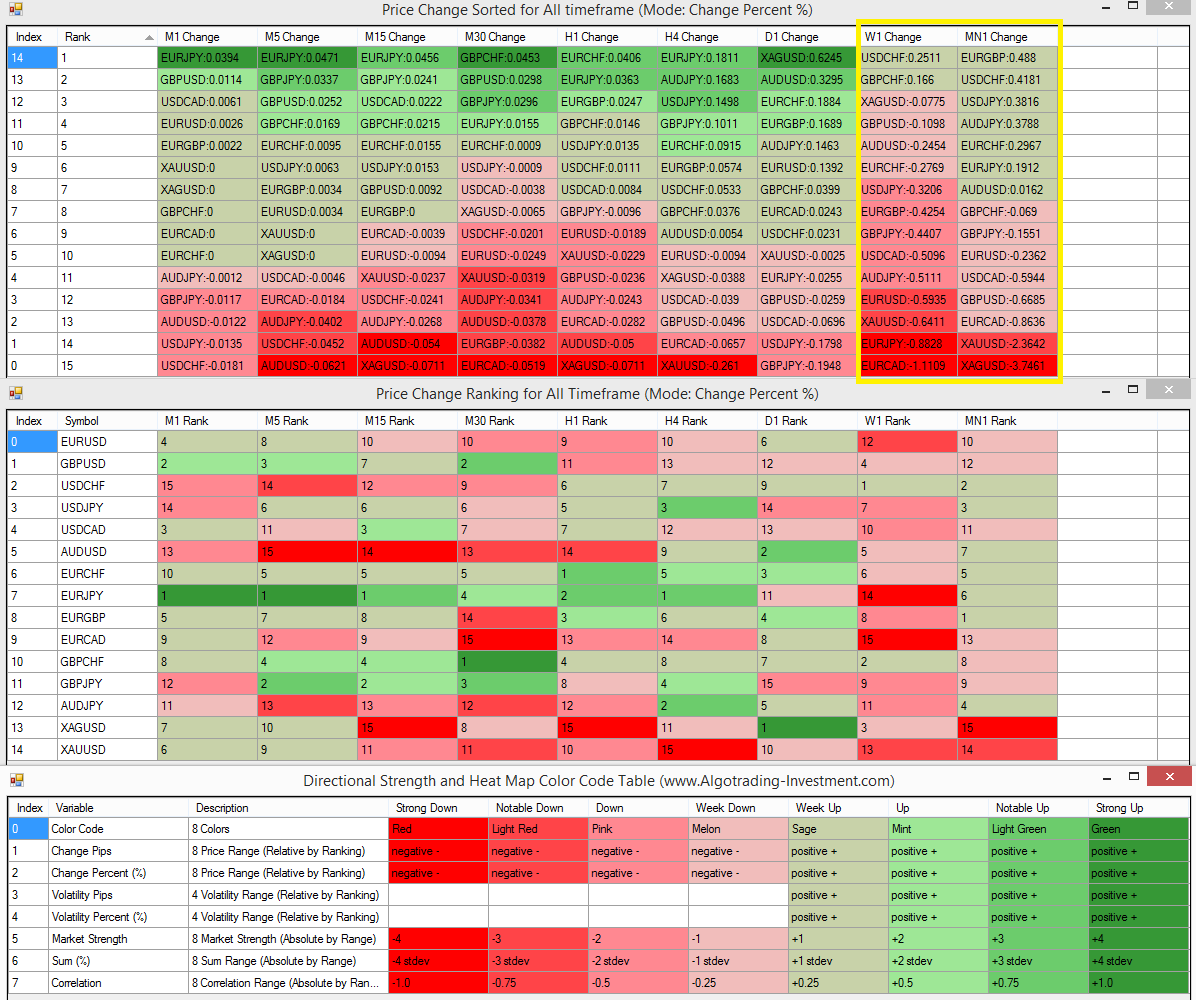
Market Outlook - 29 July 2018
For our trading, we always need to check what market is doing overall. It helps us to track which instruments are getting more trading volumes and their potential direction. This is all about the market sentiment in fact. Anyway here is the analysis from last one week movement. We use change percent in our analysis (i.e. change percent in the candle bar). It is easy to see that overall market are having the bearish sentiments. We can tell that EURUSD, EURJPY and EURCAD are the three biggest bearish movers (i.e also EURGBP too). Now it is not difficult to see that the common factor among these three pairs are EUR. In another words, EUR was weakest currency last week. The question is that would EUR will take some recovery this week ? In fact, we did have a mild recovery of EUR currency last Friday. Typically like the biggest loser EURCAD or EURJPY can gain some trading volume rapidly this week. However, set your target with both bearish and bullish price levels to follow the crowds. This analysis was done using Correlation Insight Heat Map.
Free Correlation Heat Map can be downloaded from this link below (Version 1.38)
http://algotrading-investment.com/download/79991/
http://algotrading-investment.com/
https://www.mql5.com/en/users/financeengineer/seller#products

Young Ho Seo
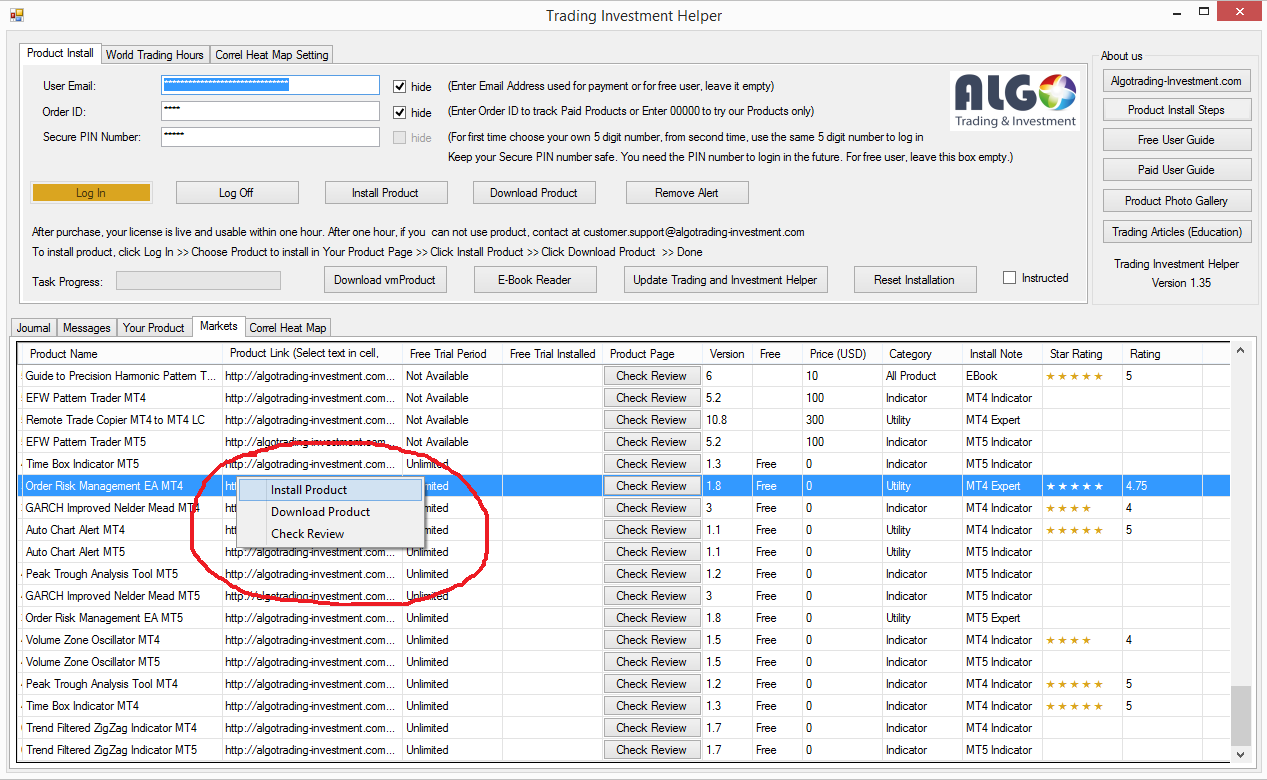
List of Free Tools for Your Trading and Investment
List of Free Tools for Your Trading and Investment
Here are the list of free tools. You can use this free tools to enhance your profitability for your trading and investment.
World Trading Hour Indicators – This free tool can help you to recognize which stock market in the world is opening. Further more, you can add or remove different international stock market according to your own preferences. This free tool is also embedded inside Trading Investment Helper.
http://algotrading-investment.com/download/79991/
Correlation Insight Heat Map – This free tool allow you to sort, rank, monitor forex and commodity symbols for your trading. Trade with winner and stay away from losers. Very efficient market monitoring tool. This free tool is also embedded inside Trading Investment Helper. Just click HM Start button to start the Heat Map.
http://algotrading-investment.com/download/79991/
Auto Chart Alert – This is a convenient tool to set alert for your trading in your chart. With Auto Chart Alert, you can set the alert line in one click in your desired location in your chart. You can even set alert over the sloped lines in your chart. Auto Chart Alert is a great tool when you have to watch out important support and resistance levels for your trading.
http://algotrading-investment.com/portfolio-item/auto-chart-alert/
GARCH improved Nelder Mead – First tool to implement the complex GARCH algorithm using Nelder Mead Algorithm. Very good tool to predict and monitor market volatility. Yes, this is free.
http://algotrading-investment.com/portfolio-item/garch-improved-nelder-mead/
https://www.mql5.com/en/market/product/6918
https://www.mql5.com/en/market/product/6910
Peak Trough Analysis – Another popular tool to study fractal and fractal related patterns. If you know how to use this tool properly, you can make tons of money. Free tool means really free.
https://www.mql5.com/en/market/product/22420
https://www.mql5.com/en/market/product/23797
http://algotrading-investment.com/portfolio-item/peak-trough-analysis-tool/
Order Risk Management EA – Very simple but powerful order and risk management tool. If you do not have one, you should really.
https://www.mql5.com/en/market/product/8586
https://www.mql5.com/en/market/product/6910
http://algotrading-investment.com/portfolio-item/order-risk-management-ea/
Time Box indicator – This free tool allow you to resolve each candle bar into daily, weekly and monthly time zone. At the same time, you can check Open, High, Low, Close price of day, week and month chart. Handy utility for forex trader.
http://algotrading-investment.com/portfolio-item/time-box-indicator/
Volume Zone Oscillator – This free oscillator is one of the very few oscillator using the volume. How to use is similar to RSI. Overbought and oversold area is shown for your trading.
http://algotrading-investment.com/portfolio-item/volume-zone-oscillator/
EFW Pattern Trader Demo – You can use only 1 pattern to trade. Comparing to the full version, the feature is limited. But it is free and better than nothing.
https://www.mql5.com/en/market/product/28402
https://www.mql5.com/en/market/product/28403
http://algotrading-investment.com/portfolio-item/efw-pattern-trader/
And Many More – Visit our website for more powerful tools for your trading and investment.
http://algotrading-investment.com
https://www.mql5.com/en/users/financeengineer/seller#products

Young Ho Seo
Trading Investment Helper Version 1.37 Released
For better security for our customers, we have released the Trading Investment Helper version 1.37. If you had a problem with installation using version 1.36, then please use this version 1.37.
Due to our server maintenance work, you might experience some product installation error earlier. It is all done now. Now you should be able to use our Trading Investment Helper and its automatic installation facility without any limitation. If you experience any problem, please write us customer.support@algotrading-investment.com
Here are the download link for version 1.37 of Trading Investment Helper:
http://algotrading-investment.com/download/79991/
http://algotrading-investment.com/
https://www.mql5.com/en/users/financeengineer/seller#products
Kind regards.

Young Ho Seo
Introduction to Harmonic Pattern Scenario Planner
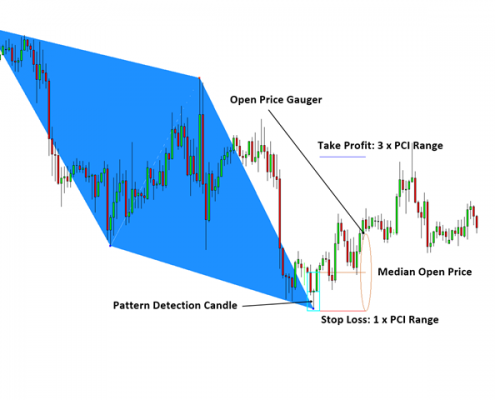
The present state of Forex market can go through many different possible price paths to reach its future destination. Future is dynamic. Therefore, planning your trade with possible future scenario is an important step for your success. To meet such a powerful concept, we introduce the Harmonic Pattern Scenario Planner, the first predictive Harmonic Pattern Tool in the world among its kind.
Main Features
Predicting future patterns for scenario analysis
11 Harmonic Pattern Detection
Automatic stop loss and take profit recognition for superb risk management
Pattern Completion Interval for precision trading
PRZ Type B level detection
Automatic Channel Detection to go with Harmonic Pattern (Optional)
Multiple timeframe Pattern Analysis
Multiple timeframe Pattern Detection
Guided Trading Instruction for professional traders
Pattern Locking and Unlocking feature in your chart
Even more, please find it out.
Scenario Simulation for Future Harmonic Pattern
There are powerful simulation techniques known to generate possible future price patterns like Monte Carlos Simulation, Brownian motion simulation, etc. To do so, we need to understand the price behaviour including distribution and its randomness. Then we repeat the simulation as many times as possible to identify various future price path. Some future price path may be very important for your trading whereas some other price path may be insignificant. Harmonic Pattern Scenario Planner collects those significant price paths only for your advance trading decision.
How to Use
You can run Harmonic Pattern Scenario Planner like Harmonic Pattern Plus to pick up the turning point. At the same time, you can predict the future patterns for the advanced scenario analysis. The predicted pattern can be used for the earlier decision making for your trading.
Reduce commission and slippage using pending orders in advance
Worst case scenario planning before taking position
Early identification of important support and resistance lines automatically in advance
More accurate prediction of entry and exit timing
How to Trade
Each Harmonic Pattern provides you the potential entry for the turning point. You might apply few other filters to improve your trading. Some of the basic filters you can apply include RSI, CCI, MACD, Bollinger Bands, and Moving Average. More advanced filter can include Price Breakout Pattern Scanner, Mean Reversion Supply Demand, Elliott Wave Trend, and Harmonic Volatility Indicator. Please note that the trading performance can vary for your trading experience and trading skills.
Indicator Input
Here we list part of input setting. For full input setting, visit this webpage:
http://tradeinvestsmart.com/2018/05/short-guideline-for-harmonic-pattern-plus-and-harmonic-pattern-scenario-planner
Harmonic Pattern Parameters 1 ( User Option ) ===========================
These parameters below concerns operations of Harmonic patterns. You can change button size, timeframe to detect patterns and alerts using these parameters. You can change timeframe of pattern detection. However, you cannot use smaller timeframe pattern detection for higher timeframe. For example, you cannot set Timeframe to detect patterns = H1 timeframe while you are using D1 chart.
Timeframe to detect Patterns
Max number of patterns to display
Pattern Index from which to display
Enable sound alert
Send email if pattern is found
Send notification if pattern is found
Display Fibo retracement (DC Future Price Projection)
Fibo Retracement Length
Fibo Retracement Color for pattern
Fibo Retracment Wdith for pattern
Use white background for chart
Amount of bars to scan for pattern search (1500 = default)
Detect Pattern at Every Tick: true or false only
Pattern Update Frequency (Period)
http://algotrading-investment.com/portfolio-item/harmonic-pattern-scenario-planner/
https://www.mql5.com/en/market/product/6101
https://www.mql5.com/en/market/product/6240

Young Ho Seo
PRZ Type B versus Fibonacci Retracement for Harmonic Pattern Plus and Harmonic Pattern Scenario Planner
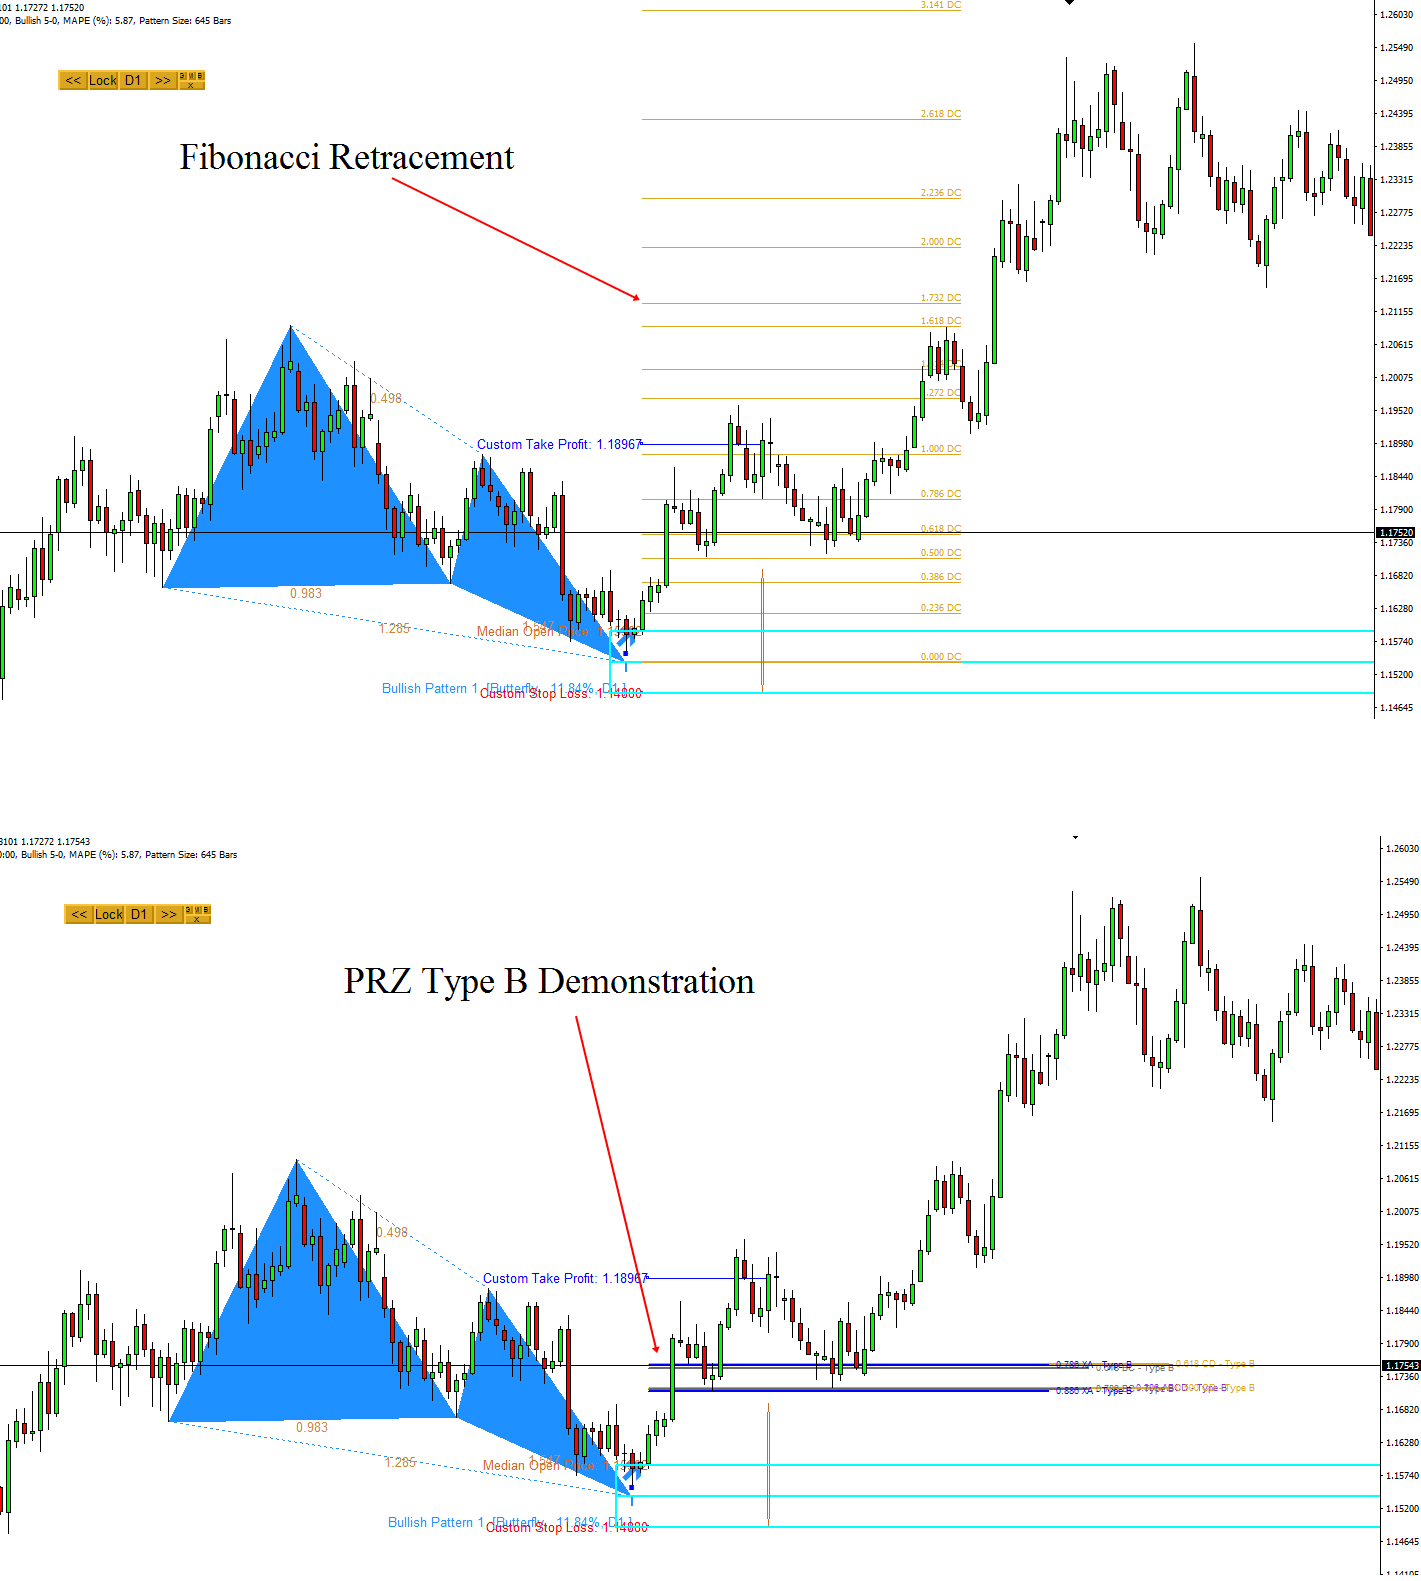
In Harmonic Pattern Plus (and with Harmonic Pattern Scenario Planner), you can use both PRZ Type B and classic Fibonacci Retracement from Final Point D. Fibonacci Retracement is classic and simple. However, PRZ Type B provide much clear prediction towards the future movement of the price. We recommend to use PRZ Type B for your trading if possible.
If you are using Fibonacci retracement solely , then it is difficult to manage your order according to your preferred Reward/Risk ratio. We recommend to manage your trading using Pattern Completion Interval ultimately. This is much better approach over the classic Fibonacci ratio trading.
But it is just recommendation though. If you prefer the old way of using Fibonacci Retracement, you can still use them from our Harmonic Pattern Plus (and Harmonic Pattern Scenario Planner). However, we have seen many trader using the classic harmonic pattern trading approach, they risk too much with bad draw down.
Manage your risk as the top priority in your trading. For your information, we are the creator of PRZ Type B and Pattern completion interval for the fully integrated trading tool for you.
Check the book: Guide to Precision Harmonic Pattern Trading
http://www.algotrading-investment.com/
https://www.mql5.com/en/users/financeengineer/seller#products

Young Ho Seo
EURGBP Market Outlook-28 July 2018
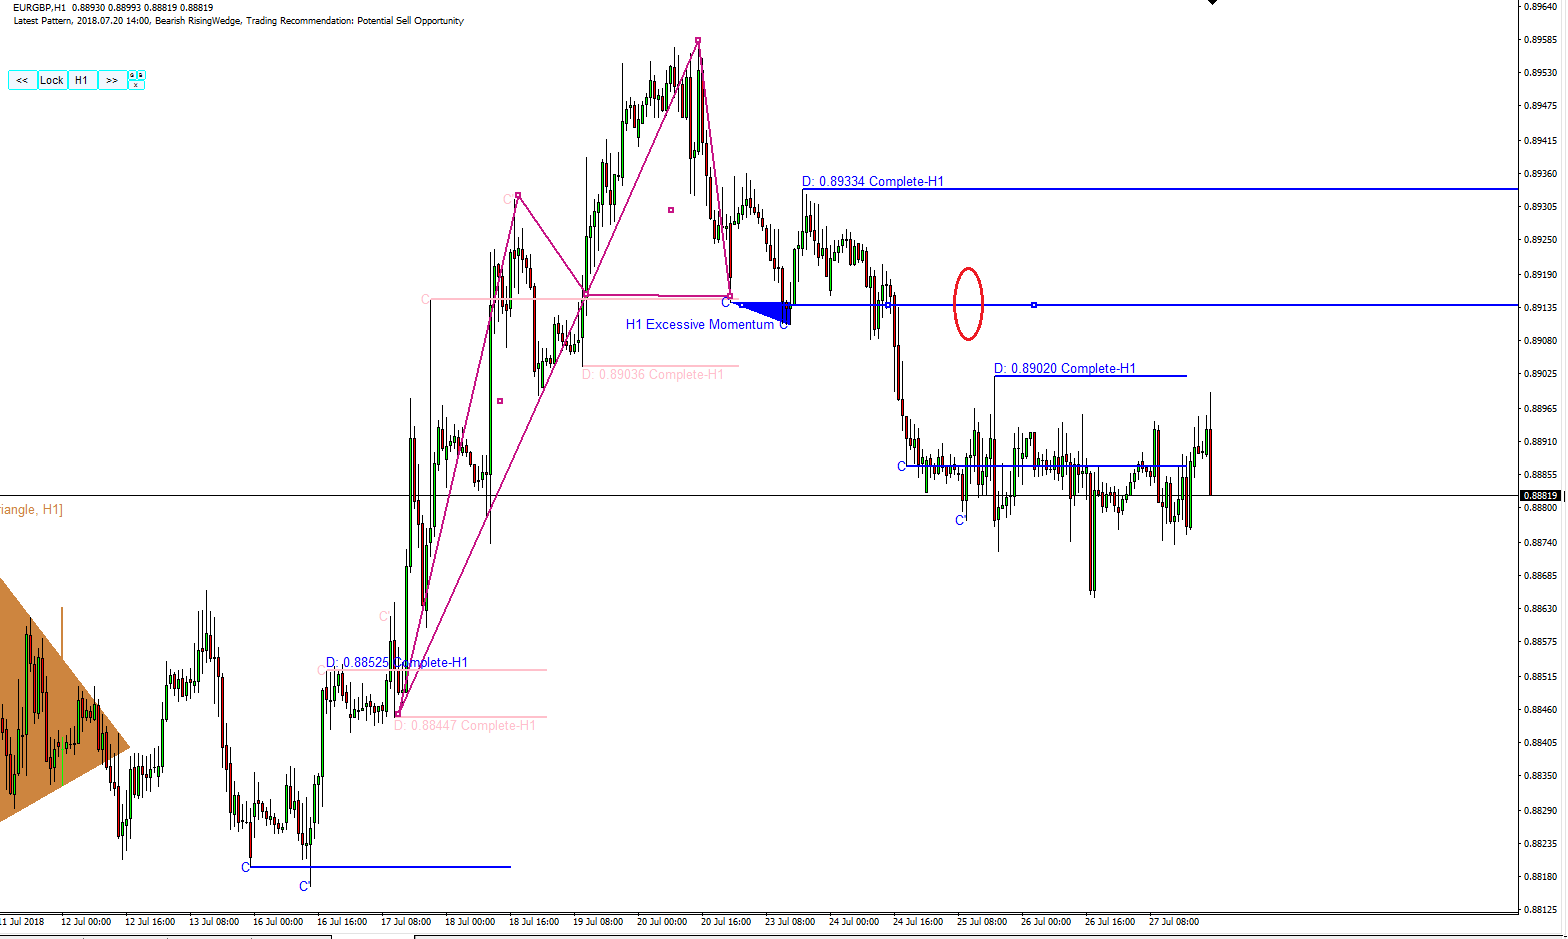
Here are some interesting analysis on EURGBP on H1 timeframe. Last week, EURGBP formed a perfect head and shoulder patterns. We have detected the excessive Momentum around the shoulder to confirm its bearish action. Since then EURGBP went down nearly 50 pips. Excessive momentum indicator can be used for many trading styles and detecting head and shoulder pattern is one of its ability. You can also use it to confirm DBDT(double bottom and double top) patterns.
http://algotrading-investment.com/
https://www.mql5.com/en/users/financeengineer/seller#products

Young Ho Seo
USDJPY Market Outlook- 28 July 2018
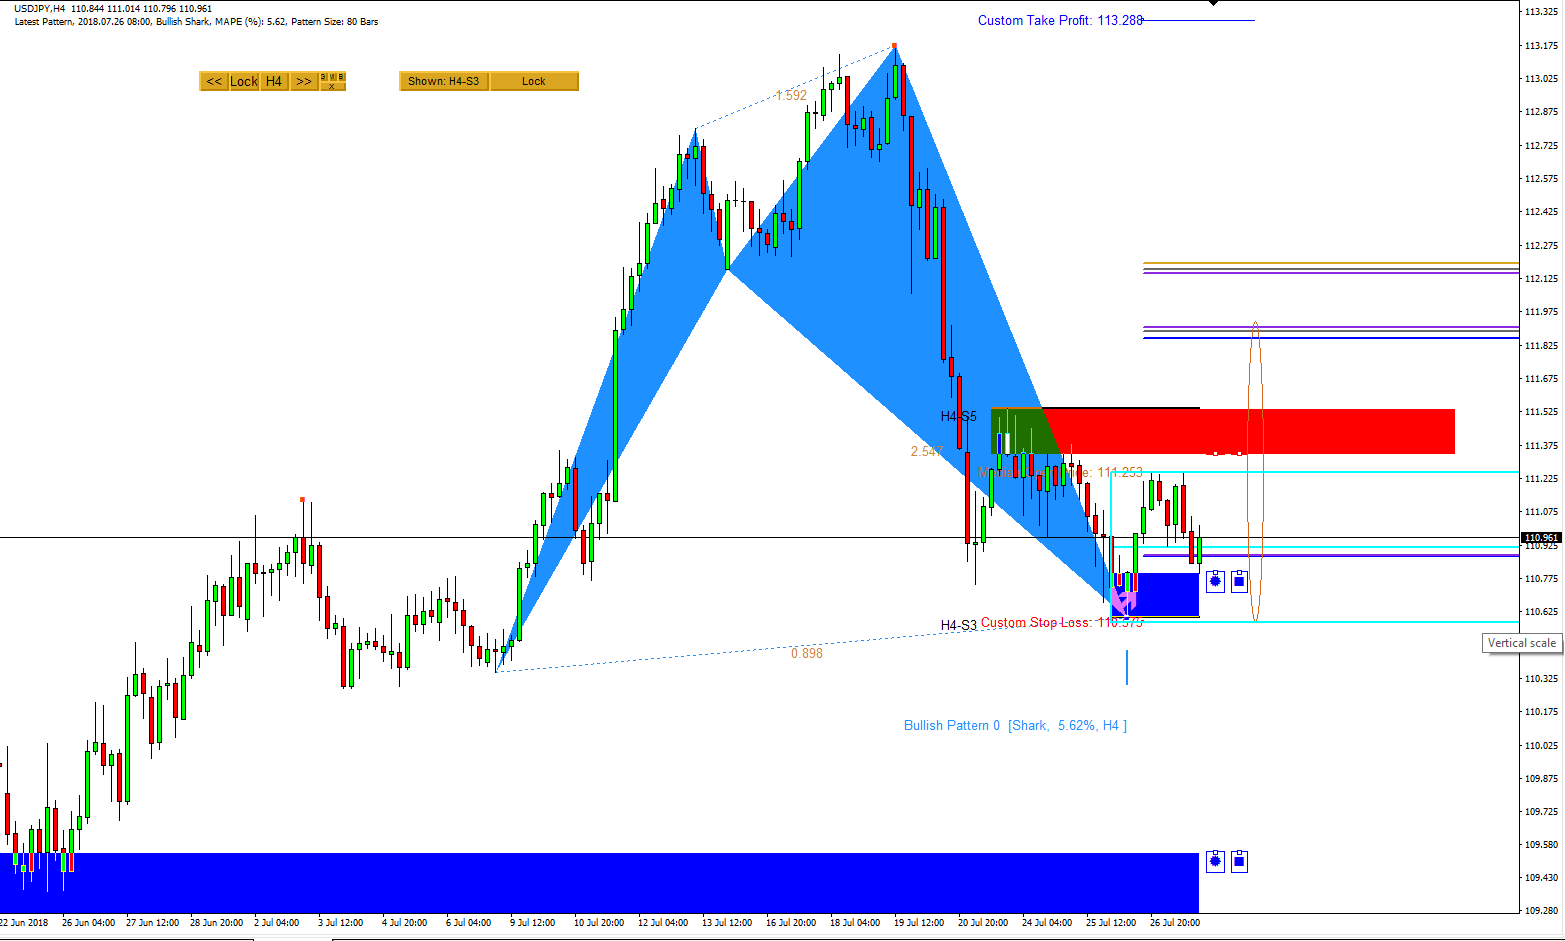
The point D of Shark pattern is coincided with demand zone (Strength = 3) in H4 timeframe with Mean Reversion Supply Demand. In this case, we will just use our typical supply demand trading knowledge. At the same time, we have supply zone around 111.525. USDJPY will likely to retest this zone again. PRZ Type B levels are still applicable for your trading.
http://algotrading-investment.com/
https://www.mql5.com/en/users/financeengineer/seller#products

: