Swing daily
- Indikatoren
- Version: 2.0
- Aktualisiert: 29 Januar 2024
- Aktivierungen: 5

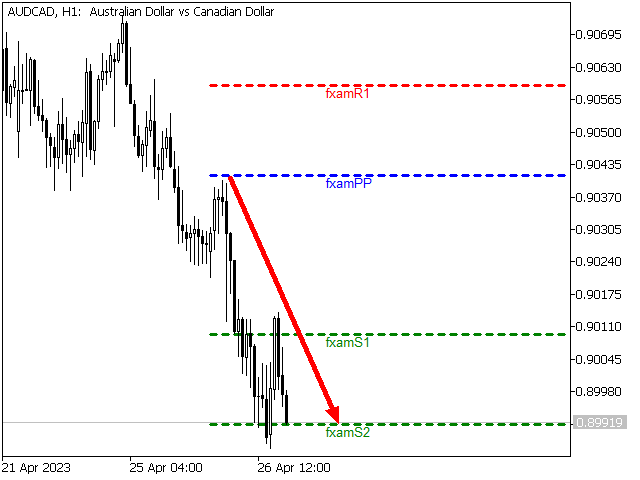
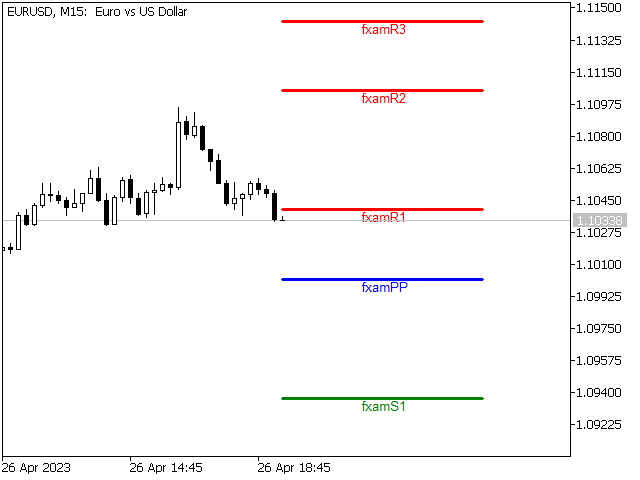
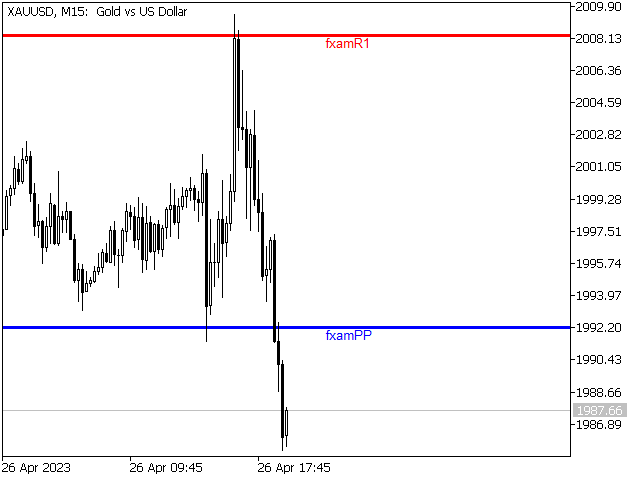
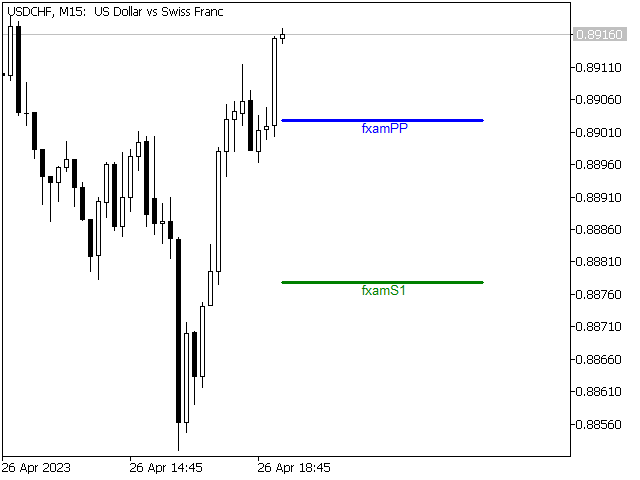
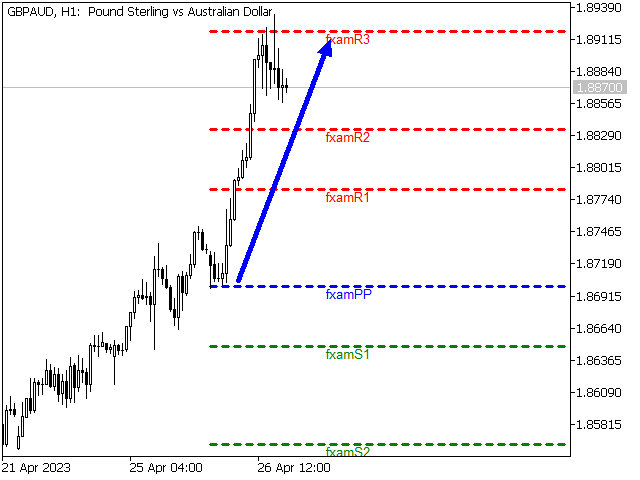
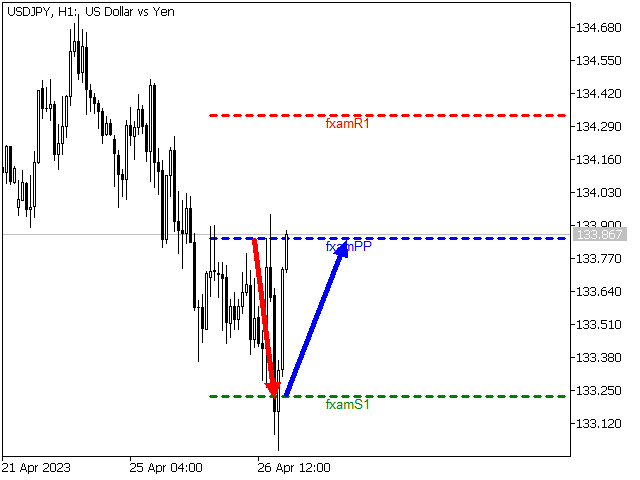
Der Swing Daily ist ein fortschrittlicher Pivot-Point-Indikator, der dem Benutzer die Kontrolle über viele Aspekte der Handelsniveaus ermöglicht, die Sie im Abschnitt "Steuerung" kennenlernen werden.
er wird hauptsächlich dazu verwendet, Intraday-Handelsniveaus zu finden, um die Preisentwicklung in Intraday-Zeitrahmen zu verstehen
es wäre perfekt, ihn zusammen mit unserem Indikator (Swing Trend) zu verwenden, um bessere Ergebnisse zu erzielen
Die Steuerelemente sind:
Pivot-Auswahl (Standard, Fibonacci, Camarilla, Woodie), um eine Pivot-Auswahlmethode zu wählen
draw floor mid pp (ja oder nein), um mehrere Pivots mit S&R zu wählen
show price label (ja oder nein), um die Preise auf den Ebenen anzuzeigen oder nicht
Zeitrahmen wählen ( 1 min - 1 Monat ) meine persönliche Empfehlung ist 1D
die Kopfzeile enthält den Link zu unserem Telegrammkanal, einfach kopieren und in Telegramm einfügen
costume message um etwas auf die Pivot-Linien zu schreiben
verwenden Sie eine kurze Linie (ja oder nein), damit die Pivots den ganzen Chart einnehmen oder nicht
Linienstil (Punkt; Strich; durchgezogen)
Linienbreite
Schriftart
Schriftgröße der Beschriftung
Beschriftung verschieben
Farbschema von (pp ; S1 ; S2 ; S3 ; S4 ; R1 ; R2 ; R3 ; R4)
ICH WÜNSCHE IHNEN ALLES GUTE