Average Daily Range Alert
- Indikatoren
- Version: 1.5
- Aktualisiert: 14 September 2022
- Aktivierungen: 5
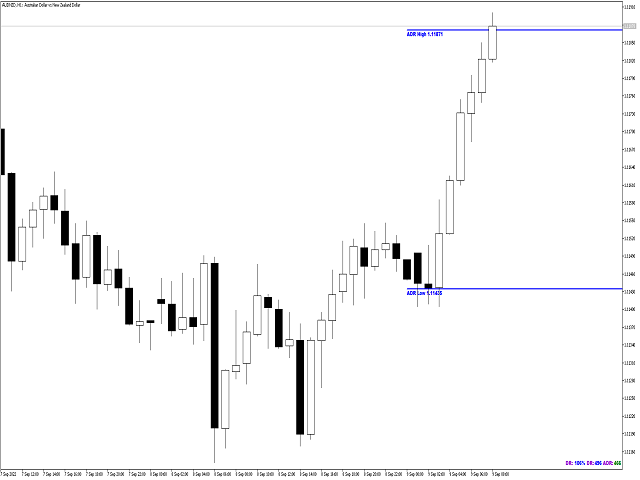
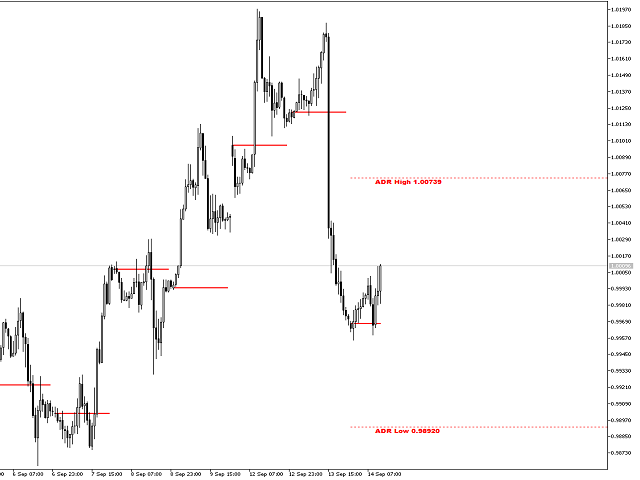
Die Average Daily Range (ADR) ist ein Indikator, der anzeigt, wie weit sich ein Währungspaar an einem Tag bewegen kann.
Zeigt automatisch das obere und untere ADR-Niveau an.
Berechnet automatisch den Prozentsatz und den Abstand des ADR, den das Währungspaar an diesem Tag erreicht hat.
Benachrichtigt, wenn der Kurs das ADR-Niveau erreicht.
Ändert die Farbe und Dicke der ADR-Linie, wenn der Kurs sie erreicht.