Investment Castle Support and Resistance
- Indikatoren
-
Ahmed Alaaeldin Abdulrahman Ahmed Elherzawi
 Every day is a new opportunity. You can build on yesterday's success or put its failures behind and start over again. That's the way life is, with a new game every day, and that's the way baseball is.
 - Version: 1.5
- Aktualisiert: 7 August 2021
Investment Castle Support & Resistance — Automatische Kauf-/Verkaufsniveaus
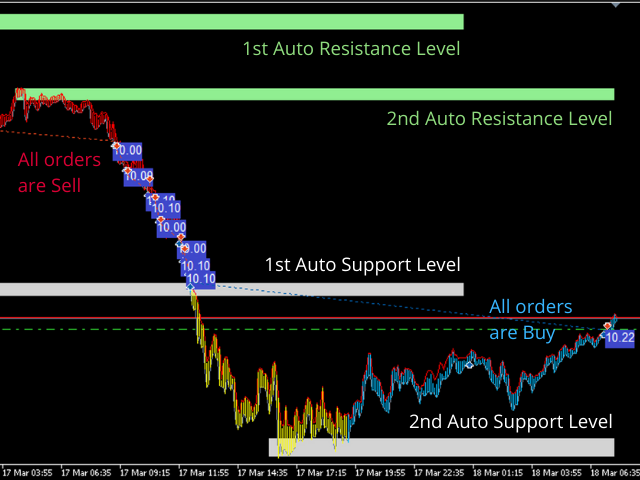
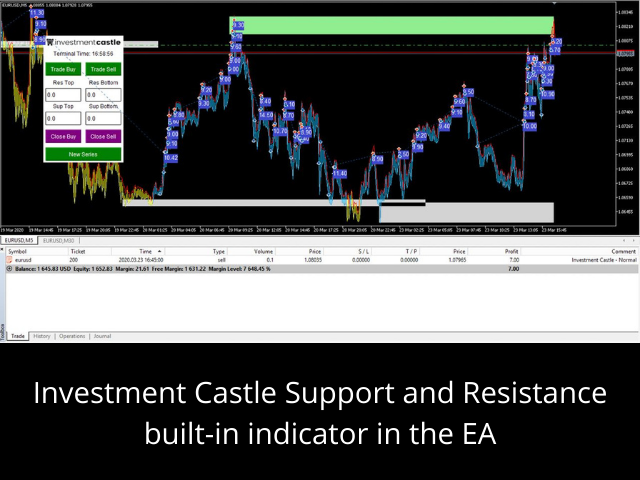
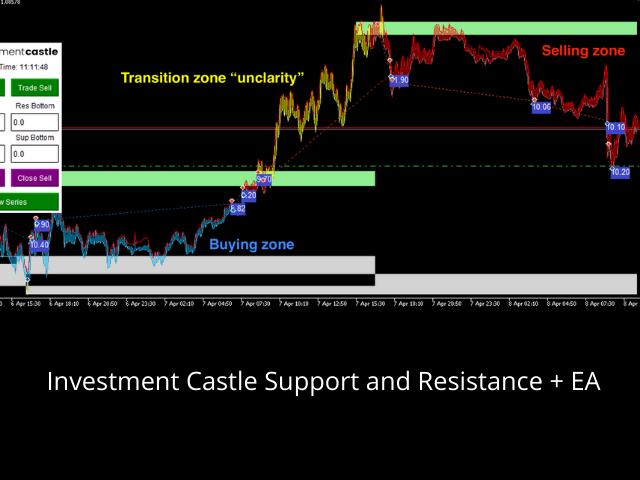
Schluss mit dem manuellen Einzeichnen von Unterstützung und Widerstand. Dieser Indikator markiert die wichtigen Kauf- und Verkaufsniveaus automatisch für Sie und färbt die Kerzen nach Tendenz, sodass die vom Markt bevorzugte Seite auf einen Blick erkennbar ist. Es ist dieselbe Support-&-Resistance-Engine, die im Investment Castle EA eingebaut ist.
Was er für Sie tut
- Automatische Kauf-/Verkaufsniveaus: Unterstützung und Widerstand werden für Sie erkannt und eingezeichnet — ohne manuelles Zeichnen.
- Farbcodierte Tendenz: Kerzen werden bei Kauf blau und bei Verkauf rot (Standard, in den Eingaben anpassbar).
- Schnellere Entscheidungen: sehen Sie sofort, wo der Kurs reagieren könnte und welche Richtung bevorzugt wird.
- Teil eines Systems: der Support-&-Resistance-Kern des Investment Castle EA, zusammen mit den psychologischen Schlüssel-Levels.
- Funktioniert überall: jedes Symbol, jede Zeiteinheit.
Für wen: für Trader, die saubere, objektive S/R-Niveaus ohne manuelle Chartarbeit wollen.
Risikohinweis: Der Handel ist mit erheblichem Verlustrisiko verbunden. Testen Sie immer zuerst auf einem Demokonto und verwenden Sie Risikoeinstellungen, mit denen Sie sich wohlfühlen. Vergangene Ergebnisse sind keine Garantie für zukünftige Resultate.


👍