Handelsroboter und Indikatoren für den MetaTrader 4 - 79

Ein Skript, mit dem Sie alle Elemente im aktuellen Diagramm auswählen können.
Es ist sehr einfach, kann aber gleichzeitig ein sehr nützliches Skript sein, insbesondere wenn ihm ein Tastaturkürzel zugewiesen wird. Sie müssen dann nicht mehr alle Objekte im Diagramm manuell auswählen. Dies ist das Gegenstück zu meinem Skript "Unselect All". Das Skript hat keine Eingabeparameter.
Ich wünsche Ihnen viel Spaß mit diesem kostenlosen Tool. Bitte lassen Sie mich wissen, was Sie davon halten.
FREE

EA New Zealand Bank - Automatisierter Handel für NZDUSD Anweisungen: Kompatible Makler: TICKMILL, TitanFX, IcMarkets, FXPig. Symbol: NZDUSD. Empfohlener Kontotyp: LOW SPREAD. Zeitrahmen: 1 STUNDE. Bitte beachten Sie, dass ich nicht empfehle, diesen Expert Advisor mit einem Broker außerhalb der Liste zu verwenden. Er wurde speziell für eine optimale Leistung mit den genannten Brokern und Symbolen entwickelt und getestet. Für den Einstieg empfehle ich, die Strategie auf einem Demokonto zu testen.
FREE

Ich freue mich, Sie auf meiner Produktseite begrüßen zu dürfen! Das anfängliche Laden des Panels befolgt die Hintergrundeinstellungen, das Panel steuert das Handelsmanagement, das den Hintergrund außer Kraft setzt. Bitte achten Sie auf die Verwaltung der Handelsrichtung, es ist wichtig, dass die richtige Handelsrichtung ist von grundlegender Bedeutung für das Überleben des Handelsmarktes. Ea Handel hat 2 Strategien Sto, MA und Benutzer in das Panel, um die Ausführung von Aufträgen zu öffnen, son
FREE

V-Trailing ist ein fortschrittliches Tool zur Unterstützung des manuellen Handels mit speziellen Funktionen für die Verwaltung von Take Profit, Stop Loss und Trailing Stops. Dieses Dienstprogramm vereinfacht nicht nur die Dateneingabe auf MT4, sondern ermöglicht Ihnen auch die Konfiguration von Trailing-Stop-Parametern, die standardmäßig auf der Plattform nicht verfügbar sind. Das Hauptmerkmal von V-Trailing ist die Möglichkeit, einen individuellen Startpunkt für den Trailing-Stop festzulegen, d
FREE

Dieser Indikator vereinfacht die Erstellung von Chartvorlagen, indem er es Ihnen ermöglicht, die aktuellen Charteinstellungen mit nur einem Klick auf eine Schaltfläche in einer Vorlage zu speichern. Der Indikator fügt eine Schaltfläche direkt in das Diagramm ein, die automatisch die Vorlage mit einem bestimmten Namen und Präfix speichert, was die Organisation und Verwendung von Vorlagen erleichtert.
Die Hauptfunktionen des Indikators sind:
Erstellung einer Vorlage des aktuellen Charts mit ein
FREE

Einfacher Pfeil mit Alarm auf dem Chart. Dies ist KEIN Einstiegsindikator, sondern ein Richtungsindikator. Er verwendet die MACD-Signallinie, um Ihnen die mögliche zukünftige Richtung eines Trends zu zeigen. Bitte verwenden Sie ihn mit anderen Filtern oder Bestätigungen, um richtig zu handeln. Empfohlen für Scalping und kurzfristige Trades. Hergestellt für EURUSD M5, aber es sollte auf jedem wichtigen Paar auf M5 Zeitrahmen funktionieren. Für MT5 Version gehen Sie bitte hier! *Wenn Sie ein volla
FREE

Equity Alert kann Ihnen helfen, Benachrichtigungen an Ihr persönliches Telegram zu senden, wenn Ihr Kontostand einen voreingestellten Wert erreicht/unterschreitet. Außerdem können Sie Ihre MT4/5-Kontoinformationen jederzeit von Ihrem Telegramm aus mit dem einfachen Befehl /check überprüfen . Holen Sie sich hier weitere kostenlose nützliche EAs !
WIE EINZURICHTEN ? * Holen Sie sich Inputs für den EA: - Telegram Bot Token: Erstellen Sie einen Telegram-Bot von @BotFather , und speichern Sie Ihren
FREE

TRAILINATOR ist eine einzigartige Lösung, um verschiedene Trailing-Stop-Varianten zu verwenden und Ihre Einstellungen per Fernbedienung zu ändern. Sie konfigurieren Ihren Trailing-Stop für ein bestimmtes Symbol nur einmal. Diese Einstellung wird für alle Ihre Positionen desselben Symbols verwendet.
Derzeit unterstützen wir diese verschiedenen Trailing-Stops:
Standard: Funktioniert wie im Metatrader Terminal, beginnt mit dem Trailing, wenn Ihr Gewinn größer als der Trailing Stop ist Start nac
FREE
TradingDesk Demo - Leistungsanalyse MT4 Dies ist eine Demo-Version des TradingDesk-Indikators, die nur den EURUSD anzeigt. Die Vollversion finden Sie hier: https://www.mql5.com/en/market/product/40189
TradingDesk analysiert die historischen Daten des MetaTrader 4 nach Symbol, Magic Number, Trade oder Kommentar. Alle diese Auswertungen werden in Echtzeit in Ihrem MetaTrader 4 Chartfenster angezeigt.
Alle diese Informationen werden in den folgenden Dashboards angezeigt: Kontoinfo Allgemeine Inf
FREE

Dies ist eine voll funktionsfähige Testversion für die Arbeit mit "CADCHF". Vollversion - Risikokontrolle Wenn beim Start des Roboters aktive Geschäfte auf dem Konto vorhanden sind, werden alle außer CADCHF geschlossen! Risk Controller ist ein Tool, mit dem Sie Aufträge, Verluste und emotional motivierte Aktionen automatisch kontrollieren können.
Die wichtigsten Vorteile Begrenzung des Gesamtverlustes des Kontos. Wenn der MinimalDepo-Wert erreicht ist, wird jeder Handel geschlossen. Begrenzung
FREE
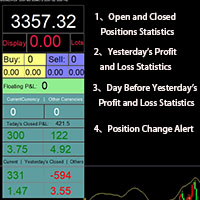
Smart Trade Monitor - Echtzeit-Positionsverfolgung, P&L-Analyse und Alarmsystem Überwachung in Echtzeit : Verfolgt automatisch offene/geschlossene Positionen, zeigt die Gewinn- und Verlustrechnung von gestern und vorgestern an - keine manuellen Berechnungen!
Smart Alerts (nur Premium) : Sofortige Push-Benachrichtigungen + akustische Warnungen bei Positionsänderungen - verpassen Sie keine Handelsmöglichkeit!
Benutzerfreundlich : Ein-Klick-Einrichtung, Anzeige der wichtigsten Daten direk
FREE

Überblick Custom Logic for Trading Mini ist die kostenlose Version von Custom Logic for Trading , die darauf ausgelegt ist, Trades auf der Grundlage von benutzerdefinierten Indikatorsignalen auszuführen, mit robusten Positionsmanagement-Funktionen und Break-even-Einstellungen. Mit diesem Skript können Händler ihre Strategien mit hoher Präzision und Flexibilität umsetzen und so ihre Handelseffizienz und Rentabilität steigern. Eingabe-Parameter Indikator-Einstellungen indicator_name : Name des ben
FREE

Chemische Raketen sind der häufigste Typ von Hochleistungsraketen, die in der Regel durch die Verbrennung von Treibstoff mit einem Oxidationsmittel einen Hochgeschwindigkeitsausstoß erzeugen . Der gespeicherte Treibstoff kann ein einfaches Druckgas oder ein einzelner flüssiger Treibstoff sein , der sich in Gegenwart eines Katalysators zersetzt ( Monotreibstoff ), zwei Flüssigkeiten, die bei Kontakt spontan reagieren ( hypergole Treibstoffe ), zwei Flüssigkeiten, die gezündet werden müssen, um zu
FREE

Eine Eizelle ist das organische Gefäß, in dem sich die Zygote befindet und in dem sich ein Embryo entwickelt , bis er selbständig überleben kann und schlüpft. Ein Ei entsteht durch die Befruchtung einer Eizelle . Die meisten Gliederfüßer , Wirbeltiere ( mit Ausnahme von lebendgebärenden Säugetieren ) und Weichtiere legen Eier, einige, wie z. B. Skorpione , tun dies jedoch nicht. Reptilieneier , Vogeleier und Eier von Monotreme werden außerhalb des Wassers abgelegt und sind von einer flexiblen od
FREE

Universeller Expert "WOz" mit integriertem Handelspanel
Die Funktionen des EA können im Strategietester im visuellen Modus problemlos getestet werden.
Der EA kann im Strategietester echten Handel simulieren und die SL- und TP-Level verschieben.
Der EA verfügt über 5 Betriebsarten:
1. AUTOTRADING automatischer Handelsmodus für ein gesetztes Signal
2. NUR SIGNAL-Modus zum Verfolgen des eingestellten Signals ohne automatischen Handel
3. BEREICHSMODUS Modus für die automatische Platzierung äq
FREE

1. ** Extrem einfach übergroß ** - Überschreiben Sie das Diagramm mit dem Echtzeit-Kurs der übergroßen Schrift, ** Keine Notwendigkeit, auf den Preis zu schauen **, geeignet für Multi-Bildschirm / Fernüberwachung. - Unterstützung benutzerdefinierter Farben, Hintergrund-Transparenz, perfekte Anpassung an jeden Chart-Stil. 2. ** Vollständig anpassbar ** - freie Anpassung Schriftgröße (Unterstützung ** 10 ~ 500px **), Farbe, Lage, erfüllen Personalisierung braucht. - 3. ** Multi-Variante & Multi -
FREE

Die Stunden der Toronto Stock Exchange Session
Mit diesem Indikator können Sie die Notierungen des Währungspaares während der folgenden Teile der Börsensitzung live verfolgen. Vor Beginn der Börsensitzung wird ein Rechteck auf dem Chart gezeichnet, das jedoch nicht mit Farbe ausgefüllt ist. Es bedeutet die Ausdehnung der Sitzungsdauer. Bevor der erste Balken in das Rechteck der Börsensitzung eintritt, werden wir durch ein akustisches Signal oder ein Pop-up-Fenster darauf hingewiesen, dass die
FREE

ONREX IV ONREX IV ist ein Handelswerkzeug, mit dem Sie Ihre manuellen Handelsfähigkeiten üben und verbessern können. Es ist auch ein Auto Trading Expert Advisor. Machen Sie sich keine Sorgen, wenn Ihre Trades in die falsche Richtung gehen, ONREX IV übernimmt und versucht, Ihr Risikomanagement zu verwalten und zu kontrollieren. ONREX IV bietet ein Handels-Interface-Panel, das Händlern erlaubt, manuell zu handeln oder FULL AUTO TRADING zu wählen. Es ist auch eingestellt, um die Take Profit und St
FREE

ForexBob 1 Click Button ist ein sehr beeindruckendes Forex-Tool für Scalper: 1. Hilfreich beim Schließen mehrerer Trades mit nur einem Klick. 2. Scalper können am meisten profitieren, die immer darauf erpicht sind, mehrere Trades im Mittelwert zu schließen und die Gewinne schnell zu sichern. 3. Es hilft, Latenz zu vermeiden und Gewinne dort zu sichern, wo wir sie brauchen. 4. Einfach zu installieren, genauso wie jeder andere Expert Advisor. 5. Die Geschwindigkeit des Handelsabschlusses hängt v
FREE

Telegram Trading Panel – MT4‑Utility zur Ordersteuerung über Telegram Zweck
Utility für MetaTrader 4 zum Öffnen/Schließen von Orders, Setzen von SL/TP, Erstellen von Pending Orders und Anzeigen von Positionsinfos direkt in Telegram via Inline‑Keyboards. Für Mobile/VPS‑Einsatz. Hauptfunktionen Telegram‑Panel mit Inline‑Tastaturen: BUY/SELL Market Einzelorder schließen oder “Alles schließen” Pending: Buy/Sell Limit, Buy/Sell Stop mit Preis/Expiry Unterstütztes Break Even: SL ±1 Pip vom Open mit Be
FREE

Dieser EA ist eine kleine Hilfe, geeignet für alle, die gerne auf Smartphones oder Tablets handeln. Der EA wird auf einem Diagramm platziert und überwacht alle Märkte (Multicurrency). Egal wo Sie sind, solange Sie Internet haben, können Sie damit handeln. Position öffnen, Stop einstellen, und der EA erstellt automatisch einen TP im vorher eingestellten Verhältnis (1:1, 1:2 usw.) zum Stop. Dies ist eine sehr praktische Funktion, die Ihnen hilft, Ihre Trades besser zu verwalten. Ideal für den Hand
FREE
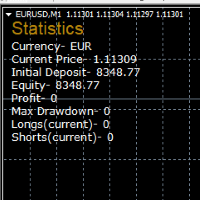
STATISTIK OSD
Statistik OSD (Bildschirmanzeige) Ist sehr hilfreich und einfach zu benutzen. Heute herunterladen! GENIESSEN! :) On Screen Display -Währung -aktueller Preis -Anfangseinlage -Eigenkapital -Gewinn -Max Drawdown -Longs(Aktuell) -Shorts(Aktuell)
*Sehr nützlich bei der Konfiguration von EAs oder Strategien, weil Sie visuell sehen können, wenn es eine Menge von Shorts oder Longs hat. Dann können Sie zurückgehen und entsprechend optimieren.
FREE

Der Binäranalysator ist eine großartige Gelegenheit, eigene Indikatoren und Handelsstrategien zu schreiben, die auf vorgefertigten Berechnungen basieren, die auf Binärcode basieren. Der Analysator arbeitet mit allen Währungspaaren mit 5 Dezimalstellen "0,00001" EUR / USD, GBP / USD ITD Empfohlene Sitzung M1 Im Katalog enthalten. Indikator - "Binärreferenz" und 4 Indikatoren zur Messung der bullischen und bärischen Marktstimmung // ------------------------------------------------ ---------------
FREE

Wenn Sie die Funktionalität dieses Tools testen möchten, können Sie dies mit dieser DEMO-Version tun, die nur auf die Währungspaare EURUSD und USDJPY beschränkt ist. Die Vollversion ist hier verfügbar: https://www.mql5.com/en/market/product/29243/ Dieser EA wurde ursprünglich als Backup-Tool für meine persönlichen Trades programmiert, da wir alle (oder zumindest diejenigen, die eine Order offen gelassen haben und schlafen gegangen sind) die frustrierende Erfahrung gemacht haben, aufzuwachen, di
FREE

Wollten Sie schon immer Ihren gesamten POV der Plattform entrümpeln? Sie haben die Möglichkeit, jedes Chart-Fenster zu löschen! Wenn Sie dieses Skript anhängen, ist die Erlaubnis erforderlich, um jedes Chart-Fenster zu schließen, unabhängig vom Symbol, Zeitrahmen oder der Anzahl der Indikationen oder EAs, AKTIV. Die Autonomie der Annullierung jedes Chart und auf dem grauen Bildschirm zu sein, geschieht mit diesem Skript, im Wesentlichen. Ich könnte fortfahren und Ihnen sagen, die Market Watch L
FREE
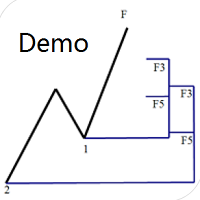
Dinapoli Levels Expansion und Retracement Demo Ein Hilfswerkzeug, das speziell für die DiNapoli-Punkt-Handelsmethode entwickelt wurde. Dies ist eine Testversion und es gibt keine Einschränkungen für den XAUUSD H4. Offizielle Version https://www.mql5.com/en/market/product/32213
Die Hauptfunktion:
1. Sie können direkt mehrere Sätze von Fibonacci-Retracements einzeichnen, und die Beziehung zwischen wichtigen Rückkehrpunkten ist auf einen Blick ersichtlich.
2. Sie können Fibonacci-Erweiterungen z
FREE

Es ist Demo-Version von Auto StopLoss Defender , können Sie auf Seite kaufen - https://www.mql5.com/ru/market/product/33112 oder erweiterte Version des Programms ist Auto StopLoss Premium , Sie können Stoploss und Takeprofit einstellen - https://www.mql5.com/ru/market/product/33113
Demo Einschränkungen: StopLoss wird bei neuen Aufträgen auf 0,10% zurückgesetzt.
Während Sie handeln, erledigt Auto StopLoss Defender die gesamte Routinearbeit. "Ein Muss für Scalping. Der beste Weg, um den Kontosta
FREE

AR Canada Lite ist ein vollautomatischer Expert Advisor, der für den Handel mit USDCAD H1 optimiert ist. Der Expert Advisor verwendet KEINE Hedging-, Martingale-, Gitterstrategien, Arbitrage usw. Er verwendet einen Handelsalgorithmus, der auf dem Schnittpunkt von zwei gleitenden Durchschnitten zur Analyse der Marktbedingungen basiert. Die Take Profit- und Stop Loss-Werte sind fest und haben ein Verhältnis von 1 zu 4. Der EA schließt Positionen, wenn Take Profit oder Stop Loss erreicht werden.
P
FREE

Dieses Tool fügt Ihren Fibo-Retracement- und Fibo-Expansions-Objekten auf dem Chart Warnungen hinzu. Außerdem bietet es ein praktisches Menü, um die Fibo-Einstellungen einfach und schnell zu ändern! Hinweis: Dies ist eine Demoversion, die nur auf USDCHF funktioniert . Die Vollversion können Sie hier kaufen: https://www.mql5.com/en/market/product/6760
Funktionen Warnung für Fibo Retracement und Fibo Expansion Levels. Ton, Handy und E-Mail-Alarm. Bis zu 20 Fibo-Levels. Kontinuierlicher Tonalarm a
FREE

Mit dem Dienstprogramm TSim können Sie den manuellen Handel mit dem MetaTrader 4 Strategy Tester simulieren. Im Panel können Sie Losgröße, Take Profit und Stop Loss einstellen. Das Panel verfügt über die Schaltflächen Sell und Buy zum Platzieren von Marktaufträgen sowie über die Schaltflächen CloseSell, CloseBuy und CloseAll zum schnellen Schließen von Aufträgen. Die Liste der offenen Orders wird unterhalb des Panels angezeigt. Achtung! Das Panel funktioniert nur im visuellen Modus des MetaTrade
FREE
Über CandTimer Indikator: Extrem einfacher CandTimer Indikator. Der CandTimer Indikator zeigt die verbleibende Kerzenzeit an. Funktioniert für folgende Zeitrahmen: M1 (Minuten-Zeitrahmen); M5 (Fünf-Minuten-Zeitrahmen); M15 (Fünfzehn-Minuten-Zeitrahmen); M30 (Dreißig-Minuten-Zeitrahmen); H1 (Stündlicher Zeitrahmen); H4 (Vier-Stunden-Zeitrahmen); D1 (Tageszeitrahmen); W1 (Wöchentlicher Zeitrahmen); MN (monatlicher Zeitrahmen). Der Timer wird auf dem Chart als Zahlen in Stunden, Minuten und Sekunde
FREE

ExpertLines ist ein Produktivitätsexperte, der Aufträge durch das Durchbrechen von Kauf- oder Verkaufslinien eröffnet und Informationen über Risiko und Gewinn sowie Pips für jeden Handel bereitstellt. Der Experte kann den geöffneten Auftrag durch virtuelle Linien von Stop-Loss und Take-Profit oder durch Schließen der Kauf- oder Verkaufstaste schließen. Er hat auch eine Trailing-Stop-Ressource, wenn sie aktiviert ist. All dies auf schnelle und einfache Weise. Rüsten Sie Ihren Handel mit ExpertLin
FREE

Wer braucht dieses Tool? 1-Wenn Sie ein Martingale Trader sind, müssen Sie sich dieses Tool ansehen
2-Wenn Sie ein Trend-Preis-Kanal-Händler sind, müssen Sie sich dieses Tool ansehen Smarty Semi Automated EA Dieses Tool ist eine große Hilfe für Scalper, die Grid oder Martingale verwenden. Es ist ein intelligentes Trading-Tool der nächsten Generation. Sie stellen die Handelsparameter ein und drücken dann einen Knopf, um den gesamten Handel für Sie zu erledigen. Es handelt sich jedoch um einen h
FREE

Bollinger Bands TP Guardian
Dieser nützliche Expert Advisor verwendet Bollinger Bänder, um das Take Profit (TP)-Niveau offener Orders zu modifizieren, Ihr Handelsmanagement zu verbessern und Ihnen nach manueller Ausführung eines Trades die Hände freizumachen.
Hauptmerkmale Automatische TP-Anpassung: Der EA passt das TP offener Aufträge automatisch an. Integration der Bollinger Bänder: Die TP-Niveaus werden unter Verwendung des oberen, mittleren oder unteren Bollinger Bandes festgelegt. Anpassb
FREE
Der EA "Change Chart Timeframe" ist ein leistungsstarkes Tool, mit dem Sie mühelos Chart-Zeitrahmen entsprechend Ihrer Handelsstrategien und persönlichen Präferenzen ändern und anpassen können. Sie können einzelne Charts auswählen, um sie zu ändern, oder die Änderungen auf alle Charts gleichzeitig anwenden, was wertvolle Zeit und Mühe spart. Dieser EA ist nur ein Werkzeug, das Ihnen beim automatischen Handel hilft. Er eröffnet keine Trades, so dass nichts passiert, wenn Sie ihn backtesten. Alle
FREE

KOSTENLOS BIS 14. FEBRUAR 2023
VERBRINGE MEHR ZEIT MIT DEINER FAMILIE. GENIESSEN SIE DAS LEBEN ... UND TUN SIE NICHTS. In dieser Version werden nur Takeprofit und StopLoss automatisch gesetzt.
Hauptversion von TropangFX: MT4 Version | MT5 Version Empfohlener Zeitrahmen: H1 Unterstützte Währungspaare: GBPUSD, EURUSD, EURCHF , USDCAD , USDCHF , AUDCAD, EURCAD, EURAUD und viele mehr...
Anforderungen
Der EA erfordert gute Brokerage-Bedingungen: niedriger Spread und Slippage während der Rollover-
FREE

Auto Close ist ein Expert Advisor, der Sie bei Ihren Geld- und Risikomanagementregeln unterstützt. Der EA kann Ihren Saldo, Ihr Eigenkapital, Ihre Marge, Ihren globalen Gewinn und Ihren globalen Verlust überwachen und Sie benachrichtigen, wenn einer dieser Werte einen bestimmten Schwellenwert erreicht. In dieser Demoversion sind die Funktionen Benachrichtigung und Schließen deaktiviert, die Vollversion finden Sie unter https://www.mql5.com/en/market/product/29141
Wie funktioniert es? Laden Sie
FREE
Tester für binäre Optionen, Strategien und Indikatoren. Es ermöglicht Ihnen, sich selbst zu testen, testen Strategien und Indikatoren auf binäre Optionen. Der EA führt keine echten Geschäfte durch! Er ist nur für Testzwecke gedacht. Er kann sowohl auf einem Live-Chart, als auch im MetaTrader 4 Strategy Tester ausgeführt werden. MetaTrader 4 bietet zahlreiche Indikatoren, die Sie an den Chart anhängen und unbegrenzt testen können. Es gibt zwei Schaltflächen auf dem Chart, Call und Put, sowie ein
FREE
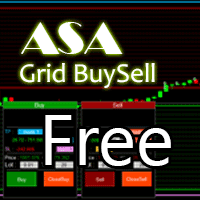
Asa Manual Grid Buy Sell with UI ist für den Grid-Handel konzipiert, bei dem Aufträge über und unter einem festgelegten Preis platziert werden, wodurch ein Raster von Aufträgen zu schrittweise steigenden und fallenden Preisen entsteht.
Hauptmerkmale Möglichkeit, ein Kaufgitter mit maximal 3 Aufträgen zu erstellen. (200 in der Vollversion)
Möglichkeit, ein Verkaufsraster mit maximal 3 Aufträgen festzulegen. (200 in der Vollversion)
Leicht zu bedienen mit einfacher Schnittstelle. Verfügt über
FREE
TP-Belichtungsmatrix (MT4)
---
Kompatibilität
Plattform: Meta Trader 4
Zeitrahmen: Alle
Symbole: Alle (Forex, Gold, Krypto, Indizes, etc.)
---
Version 1.0 Höhepunkte
Sauberes Layout der Unterfenster
Gruppierte Symbolanzeige (Kauf/Verkauf)
Mehrere Summenmodi
Optionale Live-P/L-Ansicht
Vollständige Anpassung von Farben und Abständen
Automatische Bereinigung von Objekten.
Für jegliche Anfragen kontaktieren Sie mich bitte in MQL5.com
FREE
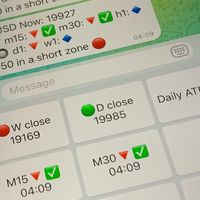
Wussten Sie, dass zusätzliche Telegram-Infopanels Ihre Handelsverluste reduzieren? Heute war ich an der Fertigstellung eines Telegrammbots interessiert, der den Zeitpunkt eines bestätigten Ausstiegs aus den überkauften/überverkauften Zonen innerhalb der Schaltflächen anzeigt. Jede Schaltfläche mit Zeitrahmen wird zeigen, wo verwendet wurde Handel Eintrag Zeit Signal. Dies geschieht bei der Schließung des RSI-Periode und auch die Schließung der Bar in die entgegengesetzte Richtung des vorherigen
FREE
Der Tickerly TV Connector ermöglicht eine nahtlose Integration zwischen TradingView-Strategien und Ihrem MT4-Terminal.
Mit diesem Tool können Sie die Handelsausführung automatisieren, indem Sie die leistungsstarke Scripting-Umgebung von TradingView mit Ihrem MetaTrader-Terminal verbinden. Zu den Funktionen gehören eine schnelle Handelsausführung über die Tickerly-Engine und eine einfache Einrichtung über Webhooks.
Dieser EA ist perfekt für Trader, die ihre TradingView-Strategien auf MT4 einse
FREE

Der SyncAllCharts-Indikator rationalisiert den Handel, indem er automatisch alle geöffneten MetaTrader 4-Charts auf das Symbol des Charts ausrichtet, auf den er angewendet wird. So sparen Händler Zeit und Mühe, wenn sie einen einzelnen Vermögenswert über mehrere Zeitrahmen oder Setups hinweg analysieren. Mit einem anpassbaren "Main Sync"-Label zur Identifizierung des Lead-Charts wird ein klarer, übersichtlicher Arbeitsbereich gewährleistet, der die Effizienz des Workflows und die Konsistenz für
FREE

Dieses kostenlose Tool ist zuverlässiger und benutzerfreundlicher in der Anwendung Bitte geben Sie fünf Sterne, wenn Sie das Tool für hilfreich halten Die Positionierung der Losgröße ist die wichtigste Regel des Risikomanagements Je größer das Lot ist, desto mehr Risiko ist man ausgesetzt. Kleinere Losgrößen werden oft von Händlern bevorzugt, die das Risiko konservativer verwalten wollen.
Eine allgemeine Faustregel besagt, dass sie bei jedem Handel nicht mehr als 1-2 % ihres Kontos riskieren s
FREE

FXO-PREISAKTIONSLEVEL-BENACHRICHTIGUNGEN
Anmerkungen:
1. .ex4 muss in den EA-Ordner geladen werden (nicht in den Indikator-Ordner).
2. Aktivieren Sie die MT4-Anwendungsbenachrichtigungen über Tools/Optionen/Push-Benachrichtigung aktivieren.
3. Ziehen Sie die überlappenden horizontalen Linien zu Beginn auf die gewünschten Levels.
Dies ist eine Indikator-Datei, sie wird nicht selbständig Trades durchführen.
Bei Fragen Support: admin@forexmarket.one
Urheberrecht: www.forexmarket.one
FREE

Ändern Sie das Symbol für alle Diagramme mit einem einzigen Klick. Legen Sie diese Datei in den Ordner Scripts, damit sie funktioniert. Geben Sie den gewünschten Chart und mich ein und wenden Sie dieses Skript auf einen beliebigen Chart an. Es wird alle Charts auf diesen bestimmten Chart ändern.
Für jede Hilfe - Telegramm - @binaryguruofficial
Fühlen Sie sich frei, dieses kostenlose Skript zu verwenden. Möge Gott Sie mit großen Gewinnen segnen Viel Glück für Ihren Handel. Mit freundlichen Grüß
FREE

Skript zum Schließen aller offenen SELL-Aufträge.
Verwendung:
- Enable Automate Trading
- Attach / Doppelklick auf das Skript
ENJOY IT.
//+------------------------------------------------------------------+ //|SELL schließen.mq4 | //|Copyright 2015, SangBatosai-Code5 | //| https://www.mql5.com/de/users/mahakaya | //| Kredit:| //| SangBatosai-Code5| //+------------------------------------------------------------------+ #property copyright "Copyright 2015, SangBatosai-Code5". #property li
FREE

Dieser Expert Advisor überwacht ständig das Gleichgewicht und P / L Ihres Handelskontos, um teure Abhebungen zu vermeiden und / oder Gewinne zu nehmen. Wenn ein bestimmter Drawdown oder Gewinnziel erreicht ist, wird der EA warnen, schließen Sie alle trades. very einfache Einstellung, setzen Sie die Take-Profit und der Stop-Loss (in Geld) und der Experte wird beginnen, um die Aufträge, die manuell oder von einem anderen Experten sind zu überwachen, und sobald der Gewinn oder Stop-Loss-Punkt geset
FREE
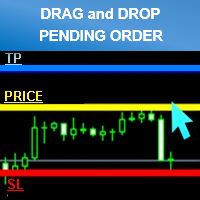
Einfacher Weg, um Pending Order zu platzieren, einfach Linie ziehen, Preis festlegen Kann im Live- und Backtest funktionieren (Strategy Tester) Hinweis: Diese Demoversion ist nur zum Testen des CADCHF-Paares gedacht. Die Vollversion finden Sie hier: https: //www.mql5.com/en/market/product/11174
Eigenschaften
1. einfacher Weg zur Eröffnung von Pending Orders. Sie müssen nur eine Linie ziehen, um den Eröffnungskurs, den Stop Loss und den Take Profit zu definieren. Klicken Sie dann auf die Schalt
FREE

FOREXBOB AUTO CLOSER ist ein sehr attraktives Tool für manuelle Trader, die :- Skalpieren Korrelations-Hedging Diejenigen, die Mittelwertbildungsmethoden verwenden usw. Dieses Tool hilft Ihnen dabei, alle Ihre laufenden Trades zu schließen, wenn der universelle gleitende P/L einen bestimmten Wert erreicht, den Sie in den Eingaben festlegen. Sie können die Warnmeldung auf Ihrem Mobiltelefon aktivieren und deaktivieren, wenn der automatische Schließer alle laufenden Geschäfte bei einem bestimmten
FREE

OvertradeShield – Utility-EA zur Vermeidung von Overtrading im diskretionären Trading Haben Sie schon einmal bereut, im diskretionären Trading „nur noch einen Trade“ gemacht zu haben? OvertradeShield ist ein Utility-EA, der basierend auf realisierten Gewinnen und Verlusten automatisch weitere Einstiege einschränkt und warnt, um Ihre Trading-Regeln und mentale Disziplin zu unterstützen. Ideal für Trader, die ihre täglichen Ergebnisse im Blick behalten möchten, Overtrading vermeiden und Gewinn- un
FREE

Kopierer von Transaktionen durch Telegram-Kanal . Hilft Ihnen, Ihren Handel sofort im Telegram-Kanal zu veröffentlichen oder Geschäfte aus dem Telegram-Kanal zu kopieren. Das Dienstprogramm kann in zwei Richtungen arbeiten, indem es Signale in MT4 empfängt und Signale an Telegram sendet . Telegram-Chat für Fragen und Diskussionen: https://t.me/forex4up_chat Keine verpassten Geschäfte mehr Keine Panik mehr Kapital-Management Einfacher Gebrauch PAY-Version: https://www.mql5.com/en/market/produc
FREE

Dies ist eine DEMO-Version des Smarter Trade Managers Der Smarter Trade Manager ist ein fortschrittliches Handelsmanagement-Tool, mit dem Sie Ihre manuellen und EA-Trades entsprechend den von Ihnen gewählten Einstellungen überwachen und verwalten können. Es arbeitet wie ein Expert Advisor (EA), es öffnet keine Trades, sondern schließt Trades gemäß den Einstellungen für das automatische Schließen oder durch manuelles Drücken einer der Schließen-Schaltflächen.
MERKMALE:
Dreidimensionale interakti
FREE

Ego Guard ist ein fortschrittlicher Expert Advisor, der das Eigenkapital Ihres Kontos durch robuste Risikomanagementmaßnahmen schützt. Dieser EA überwacht die Kontoaktivität genau und greift bei Bedarf ein, um ein übermäßiges Risiko zu verhindern. Insbesondere deaktiviert Ego Guard automatisch alle anderen Expert Advisors, die versuchen, Trades zu eröffnen, die die vordefinierte Risikoschwelle überschreiten. Durch die effektive Verwaltung des Handelsvolumens und die Einhaltung der Risikomanageme
FREE

Stochastic Full View zeigt alle 29 Haupt- und Nebenpaare Stochastik-Indikator Live-Wert, Händler können alle 29 Paare Stochastik-Indikator Live-Wert mit allen 9 Timeframes nur auf EINER Chart, Händler können alle 9 Timeframe überkaufte Signal und überverkaufte Signal nur auf EINER Chart zu sehen Stochastic Full View zeigt den überkauften Wert und den überverkauften Wert mit hervorgehobener Hintergrundfarbe und Schriftfarbe, Sie können dieses Dienstprogramm auf jedem Paar und jedem Zeitrahmen anb
FREE

Bequemes und einfach zu bedienendes Mini-Panel, das die Rentabilität von Januar bis zum aktuellen Monat anzeigt.
Dies hilft, die Ergebnisse der Transaktionen schnell zu bewerten , ohne das Konto überwachen zu müssen.
Die Daten werden automatisch aktualisiert .
Jedes Panel-Element kann mit seiner eigenen Farbe und Transparenz konfiguriert werden.
Es gibt englische und russische Sprachen.
Das Panel kann im Strategie-Tester ausgeführt werden, um zu sehen, wie es aufgebaut ist.
D
FREE
Der Indikator BOSSTESTER (Binary Option Super System Tester) ist ein einfaches Testgerät für das BOSS Handelssystem für binäre Optionen. Sein Ziel ist es, eine Gleichgewichtslinie auf den historischen Daten während der CALL- und PUT-Transaktionen des BOSS-Handelssystems zu konstruieren. Der Tester benötigt mindestens 50 Balken in der Historie.
Eingaben Anfangssaldo - Anfangssaldo. Investitionsrate - Investitionsrate. Losses Cover Ratio - Verlustdeckungsgrad. Auszahlung - Auszahlung in %. Verlus
FREE

Diese App wurde entwickelt, um die Handelseffizienz zu revolutionieren, und ermöglicht es Händlern, mit intuitiven Pfeiltasten auf der Tastatur oder dynamisch positionierten Schaltflächen auf dem Chart nahtlos durch die Market Watch-Symbole zu navigieren, wodurch die Navigationszeit minimiert und die Konzentration auf die Marktanalyse verbessert wird.
Potenzial : Dieses leichtgewichtige MetaTrader 4-Tool ermöglicht einen schnellen Symbolwechsel für die vergleichende Analyse von Vermögenswert
FREE

Guten Morgen! Der folgende Indikator ist sehr nützlich, wenn Sie mehrere Trades mit demselben Instrument verwalten. Er ermöglicht es Ihnen, den durchschnittlichen Einstiegspreis für KAUF- und VERKAUFSgeschäfte zu sehen. Wenn es ein Ungleichgewicht gibt (wie im Beispielfoto gezeigt), zeigt der Indikator die Durchschnittswerte der SELL/BUY-Trades und eine GOLD-Linie an, die den Break-Even-Preis (ohne Swap und Kommissionen) markiert.
FREE

Das Panel für das MT4-Terminal wurde entwickelt, um dem Händler zu helfen, schnell schwebende Orders für einen Ausbruch aus dem vorherigen Balken zu setzen.
Das Dienstprogramm berechnet das Auftragslos selbst zum angegebenen Stop-Loss-Kurs und maximalen Verlustprozentsatz.
Das Panel verfügt auch über eine Schaltfläche für die Konvertierung in den Breakeven. Wenn Sie darauf klicken, wird der Stop-Loss einer offenen Position in den Eröffnungspreis der Order umgewandelt.
FREE

Dieser Indikator liefert wichtige Informationen in einer einfachen Tabelle über die Marktspanne und zeigt an, ob der Markt wichtige Pivot-Levels berührt hat und ob er aus dem vorherigen Hoch/Tief ausgebrochen ist. Diese Version befindet sich noch in der Testphase und wird kostenlos angeboten und kann nur für einen Zeitraum von 3 Monaten genutzt werden. Wir freuen uns über Ihr Feedback, damit wir diese Anwendung verbessern können.
FREE
Special Trailing Sl ist ein automatischer Trailing Stop_loss. Es wird zunächst versuchen, Ihr Risiko zu beseitigen und dann die Gewinne zu sichern. Der erste Schritt besteht darin, den SL bei Long-Trades 50 Punkte unter den aktuellen Kurs und bei Short-Trades 50 Punkte über den aktuellen Kurs zu verschieben, sobald der Handel den Mindestgewinn pro Punkt erreicht hat. Zweiter Schritt: Der SL folgt dem aktuellen Preis mit einem dynamischen Abstand. Dieser Trailing Stoploss wurde in meinen Produkte
FREE

Dies ist ein multifunktionales Skript für alle Schließungen
MT4-Version
Eigenschaft: 1, es kann alle Aufträge des Diagrammsymbols oder aller Symbole schließen. (Modus auswählen) 2, es kann alle Aufträge vom Typ Kauf, Verkauf oder beides schließen. 3, es können alle Aufträge mit Gewinn, Verlust oder beliebig geschlossen werden. 4, Sie können die magische Zahl und den Orderkommentar als Filter für die Orderschließung angeben. 5, es kann auch eine teilweise Schließung nach Prozentsatz für alle A
FREE

Die Verwaltung von Aufträgen kann schwierig werden, insbesondere wenn viele Aufträge gleichzeitig offen sind, sowohl Long- als auch Short-Aufträge. Mit den Standardwerkzeugen von Metatrader kann jeweils nur ein Auftrag geändert werden.
Wenn Sie das Stop-Loss-Niveau oder das Take-Profit-Niveau aller Ihrer offenen Aufträge ändern möchten, ist dieses Tool genau das Richtige für Sie. Mit diesem Tool können Sie das Stop-Loss-Niveau für ALLE offenen Orders mit einem einfachen "Drag and Drop" auf dem C
FREE

Script zum Schließen aller offenen BUY-Orders.
Verwendung:
- Enable Automate Trading
- Attach / Doppelklick auf das Skript
ENJOY IT.
//+------------------------------------------------------------------+ //|Kaufen schließen.mq4 | //|Copyright 2015, SangBatosai-Code5 | //| https://www.mql5.com/de/users/mahakaya | //| Kredit:| //| SangBatosai-Code5| //+------------------------------------------------------------------+ #property copyright "Copyright 2015, SangBatosai-Code5". #property lin
FREE

Buffer Scanner ist ein Skript, das Ihnen hilft, nur 2 Puffer Ihrer benutzerdefinierten Indikator-Daten mit Geschichte Datum Zeit und open&close Preis in CSV-Datei zu exportieren, Der Dateiname hat bereits umbenannt. Mehr wie für BinaryOptions Indikatoren, Analysen, können Sie die Eingabe von Skript-Parameter, insbesondere~!No Notwendigkeit, über den Indikator setzt Bars begrenzt, einige der Indikatoren haben Parameter, aber wichtige Sache ist Bars begrenzt, erinnern Sie dieses Skript nur für "De
FREE

Ein EA zum Exportieren der Handelshistorie für FXer - Journaling and Analytics. fxer.net Registrieren Erstellen Sie ein API-Token EA auf einen beliebigen Chart setzen (jeder TF ist in Ordnung) Füllen Sie das API-Token aus Verfolgen Sie die Analysen für besseres Trading Wir bei FXer haben ein klares Ziel: Wir wollen Händlern wie Ihnen die Werkzeuge an die Hand geben, die sie brauchen, um in der sich ständig verändernden Welt des Handels zu bestehen. Wir sind bestrebt, erstklassige, datengestützte
FREE

MT4 Positions-Assistent Aufgrund der Einschränkungen der hochgeladenen Version ist eine sehr alte Version Nach dem Laden siehe EA " About " Beschreibung
PS: Die neueste Version von MT4 Position Assistant kann nur einen Teil der Funktionen in einer einzigen Datei erfüllen und benötigt eine große Anzahl von Indikatoren, um zu laufen. Drucken Sie die EA-Verknüpfungsbeschreibungsdatei vor der Verwendung aus. Die Datei ist auf dem Netbook oder der Q-Gruppe verfügbar, normalerweise im Ordner des Ass
FREE

Revolutionieren Sie Ihr Handelserlebnis mit unserem fortschrittlichen Management-Panel Maximieren Sie die Effizienz und Kontrolle mit unserem hochmodernen Management-Trading-Panel, das exklusiv für anspruchsvolle Händler entwickelt wurde. Unser innovatives Panel ist ein Novum im Bereich des Finanzhandels und bietet unvergleichliche Funktionalität und benutzerfreundliche Funktionen. Hauptmerkmale: Automatischer täglicher Gewinn-/Verlustabschluss : Legen Sie die von Ihnen gewünschten Gewinn- oder
FREE
Echtzeit-Spread-Indikator auf dem Chart Dieser revolutionäre Indikator bietet Ihnen eine transparente und detaillierte Ansicht des Echtzeit-Spreads direkt auf Ihrem Trading-Chart. Dieser Indikator wurde entwickelt, um genaue und wichtige Informationen zu liefern, und verbessert Ihre Fähigkeit, fundierte Entscheidungen zu treffen und Ihre Handelsperformance zu optimieren. Hauptmerkmale: Sofortige Anzeige: Zeigen Sie den Echtzeit-Spread direkt auf Ihrem Chart an, so dass Sie nicht mehr zwischen ve
FREE
Ist Ihnen bekannt, warum der MetaTrader Market die beste Plattform für den Verkauf von Handelsstrategien und technischer Indikatoren ist? Der Entwickler braucht sich nicht mit Werbung, Programmschutz und Abrechnung mit Kunden zu beschäftigen. Alles ist bereits erledigt.
Sie verpassen Handelsmöglichkeiten:
- Freie Handelsapplikationen
- Über 8.000 Signale zum Kopieren
- Wirtschaftsnachrichten für die Lage an den Finanzmärkte
Registrierung
Einloggen
Wenn Sie kein Benutzerkonto haben, registrieren Sie sich
Erlauben Sie die Verwendung von Cookies, um sich auf der Website MQL5.com anzumelden.
Bitte aktivieren Sie die notwendige Einstellung in Ihrem Browser, da Sie sich sonst nicht einloggen können.