Levels of resistance and support
- 指标
- 版本: 1.2
- 更新: 11 六月 2022
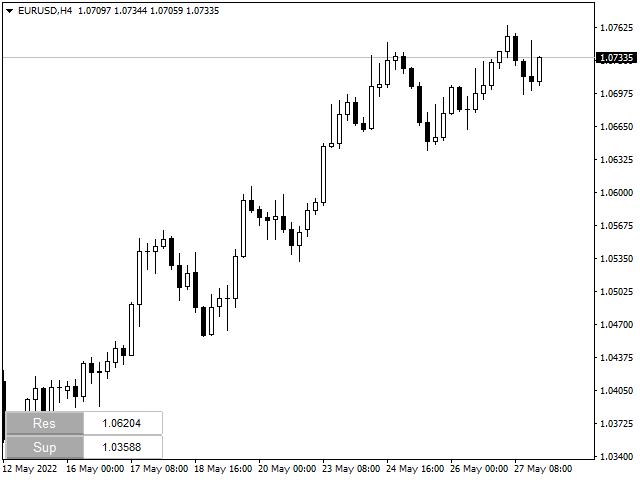
Resistance and Support is an easy to use indicator to apply horizontal lines of resistance and support.
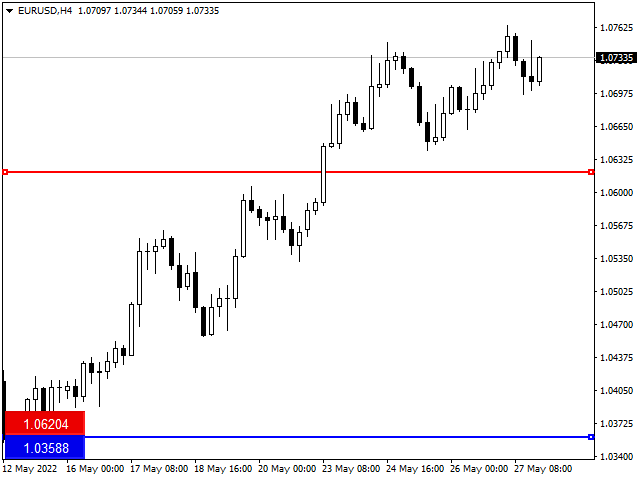
There are two windows for adding levels. When you press the button, a line appears on the price chart.
It is possible to double-click this line with the mouse to activate and move it,
thereby changing the indicator readings.
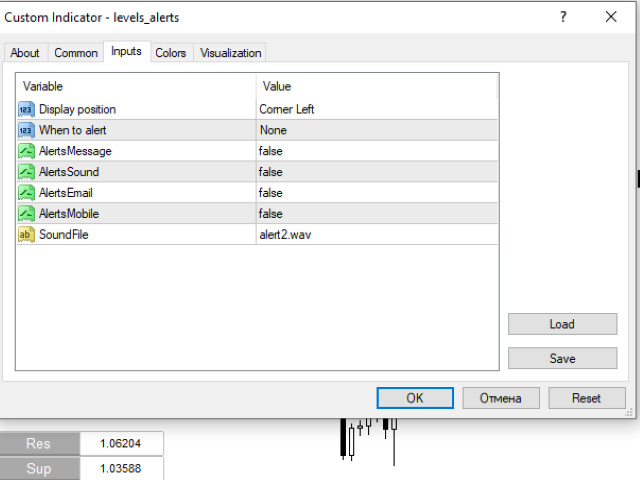
In the indicator menu there is a choice of possible alerts -
no alert,
alert on touching the level
an alert for closing the candle after the level.
用户没有留下任何评级信息