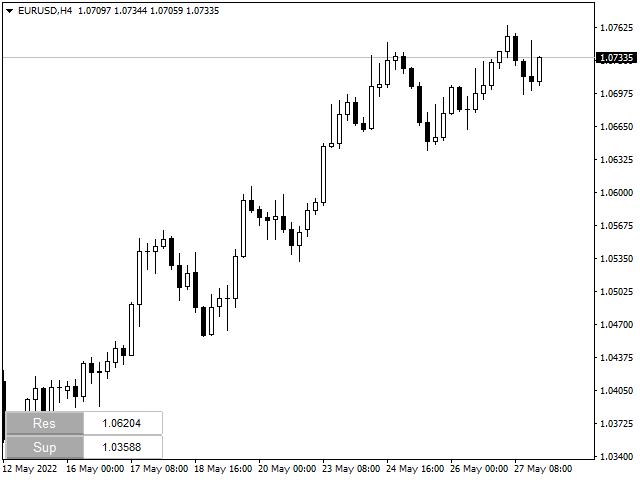
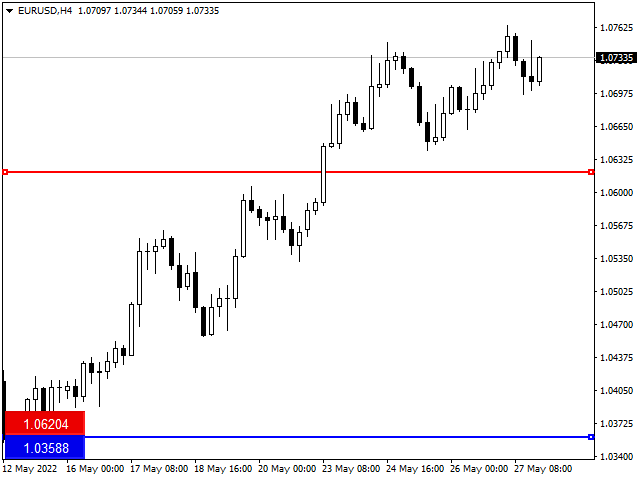
Levels of resistance and support
- 지표
- 버전: 1.2
- 업데이트됨: 11 6월 2022
Resistance and Support is an easy to use indicator to apply horizontal lines of resistance and support.
There are two windows for adding levels. When you press the button, a line appears on the price chart.
It is possible to double-click this line with the mouse to activate and move it,
thereby changing the indicator readings.
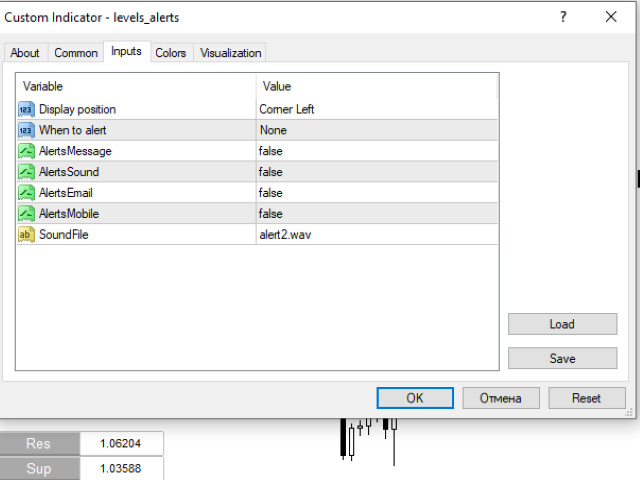
In the indicator menu there is a choice of possible alerts -
no alert,
alert on touching the level
an alert for closing the candle after the level.
사용자가 평가에 대한 코멘트를 남기지 않았습니다