Volatility Vision
- 指标
- 版本: 1.0
- 激活: 10

Volatility Vision: Essential for Forex and Stock Markets
发现Volatility Vision:您的交易革命
完美适合初学者和专业交易者
简单入门指南: 通过我们的用户手册,学习如何有效使用它。
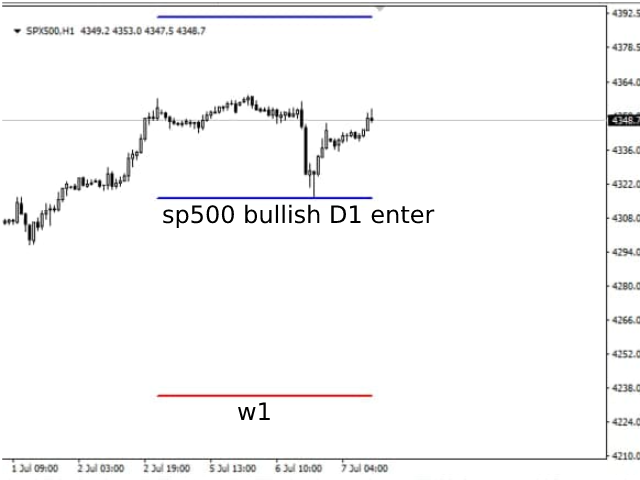
Volatility Vision 指标是一个强大的工具,可以在您的图表上精确描绘波动率水平。这个多功能工具是整合到您的交易策略中必不可少的,兼容所有货币对和股票市场。
利用波动率阈值,自信地管理您在一周内的交易。
Volatility Vision的优势
- 增强准确性:显著减少了常见于随机振荡器的误报。
- 早期信号:比RSI更早捕捉交易信号,帮助您抓住错失的机会。
- 市场领先:在MACD响应之前提供前瞻性见解。
- 可靠性:避免了CCI常见的误信号陷阱。
轻松配置
输入ATR值以开始(默认值为15)。所有级别都是固定的,以保持一致的分析;切换时间框架以刷新数据。
指标指南
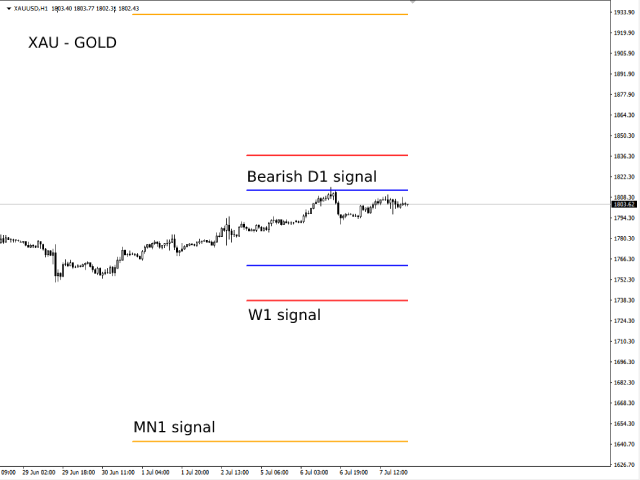
- 蓝线:每日波动率。
- 红线:每周波动率。
- 橙线:每月波动率。
将Volatility Vision与传统的ATR结合使用,以获得更多战略机会。今天就增强您的交易策略吧!
立即获取指标:访问市场
安装简单,立即为您的成功做好准备!
重要:由于静态值限制,指标只能在平台的第一周进行测试。