Adapter

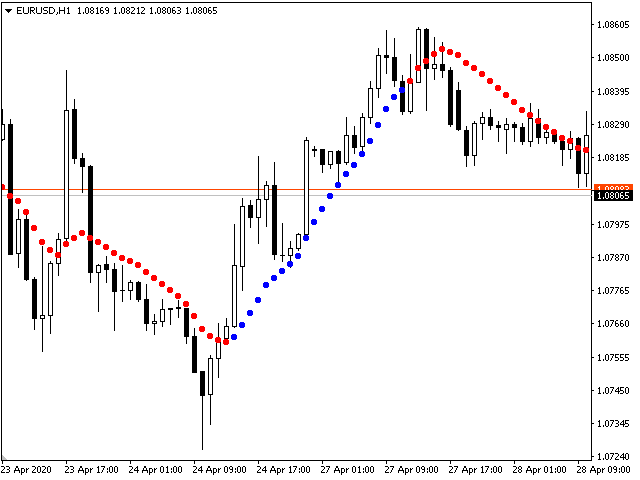
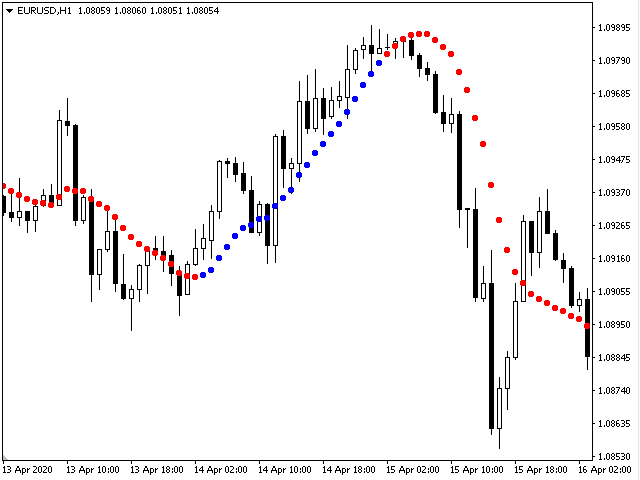
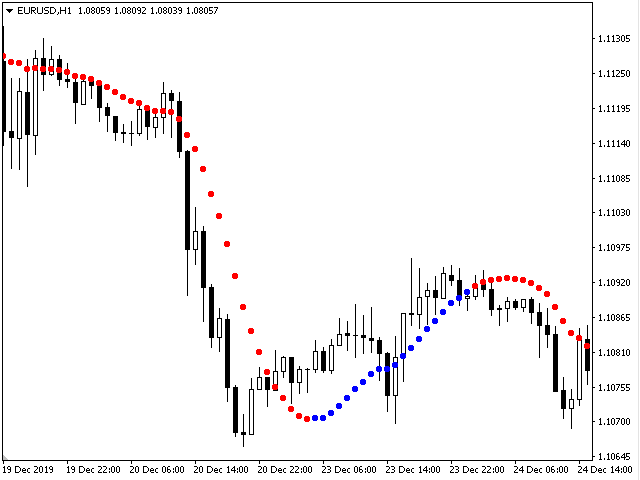
Индикатор Adapter определяет господствующую тенденцию, помогает анализировать рынок на выбранном временном интервале. Прост в настройке и работает на всех парах и всех временных интервалах.

Индикаторы тренда дают возможность классифицировать направление ценового движения, определив его силу. Решение этой проблемы помогает инвесторам вовремя войти в рынок и получить хорошую отдачу. Для любого трейдера крайне важно правильно определить направление и силу трендового движения. К сожалению, единственное верное решение этой задачи отсутствует. Множество трейдеров торгуют на различных временных интервалах. По этой причине получаемые сигналы воспринимаются субъективно.


推荐产品
ColorTrendStd
ANTON BELOUSOV
Индикатор использует сложный алгоритм, который позволяет ему обнаруживать потенциальные развороты тренда. На основе его кода, индикатор сравнивает движение цены со средним диапазоном свечей. Так же индикатор показывает места флета где появляется разворот и приостанова движения цены Работает на любой валютной паре, с любым таймфреймом Дополнительно можно встроить передачу сигналов в телеграм, Выбор цветов позволяет пользователю настроить свою цветовую гамму.
OrderBlock TS Roman
Vladislav Vlastovskii
3.8 (5)
Индикатор строит блоки заказов (БЗ) по торговой системе (ТС) Романа. Поиск блоков осуществляется одновременно на двух таймфремах: текущем и старшем (определяемым в настройках). Для оптимизации и игнорирования устаревших блоков в настройках задается ограничение количества дней в пределах которых осуществляется поиск блоков. Блоки строятся по правилам ТС состоящем из трех шагов: какую свечу вынесли (что?); какой свечой вынесли (чем?); правило отрисовки (как?).
FREE
Tipu Heikin Ashi Panel
Kaleem Haider
4.56 (18)
Tipu Heikin-Ashi Panel is the modified version of the original Heiken Ashi indicator published by MetaQuotes here . A professional version of this indicator is available here . Features An easy to use Panel that shows the Heiken Ashi trend of selected timeframe. Customizable Buy/Sell alerts, push alerts, email alerts, or visual on-screen alerts. Customizable Panel. The panel can be moved to any place on the chart or minimized to allow more space. Heikin means "the average", and Ashi means "foot
FREE
什麼是 Schaff Trend Cycle? Schaff Trend Cycle(STC)是一種振盪指標,用於及時捕捉市場趨勢的反轉。與傳統指標如移動平均線或MACD相比,STC 結合了循環週期與動能,可更清晰地辨識趨勢的開始與結束。 主要特點 明確的趨勢反轉信號:上升趨勢中週期線上升,下降趨勢中週期線下降。 在震盪行情中降低噪音:基於循環的平滑處理有助於過濾短期波動。 參數靈活可調:可通過調整週期與平滑參數來適配不同交易風格。 計算邏輯概覽 動能計算 根據設定週期內的價格變化,計算短期與長期動能。 循環平滑處理 對動能進行雙重平滑處理,提取循環成分。 標準化 將結果標準化到0至100之間,以振盪圖形式顯示。 信號產生 當指標線突破25或75時,產生買入/賣出信號。 輸入參數 CyclePeriods – 動能計算的週期。預設值:10 FastMA – 短期平滑移動平均。預設值:3 SlowMA – 長期平滑移動平均。預設值:3 OverboughtLevel – 超買區閾值。預設值:75 OversoldLevel – 超賣區閾值。預設值:25 如何安裝此指標 在 MQL
FREE
FlatBreakout
Aleksei Vorontsov
FlatBreakout (Free Version) Flat Range Detector and Breakout Panel for MT4 — GBPUSD Only FlatBreakout is the free version of the professional FlatBreakoutPro indicator, specially designed for flat (range) detection and breakout signals on the GBPUSD pair only. Perfect for traders who want to experience the unique fractal logic of FlatBreakout and test breakout signals on a live market without limitations. Who Is This Product For? For traders who prefer to trade breakout of flat ranges (breakout,
FREE
QualifiedEngulfing
Ashkan Hazegh Nikrou
QualifiedEngulfing - 是 ProEngulfing 指标的免费版本 ProEngulfing - 是 Advance Engulf 指标的付费版本, 点击此处下载。 ProEngulfing 的免费版与付费版有什么区别?免费版每天只能发出一个信号。 介绍 QualifiedEngulfing - 你的专业 Engulf 模式指标,适用于 MT4 通过 QualifiedEngulfing 发挥精准性的力量,这是一款设计用于辨识和突显外汇市场中合格 Engulf 模式的前沿指标。专为 MetaTrader 4 开发,QualifiedEngulfing 提供了一种细致入微的 Engulf 模式识别方法,确保您只收到最可靠的交易信号以做出决策。 QualifiedEngulfing 的工作原理: QualifiedEngulfing 采用先进的算法分析 Engulf 模式,超越了简单的模式识别,确保模式的合格性。以下是其工作原理: 资格标准:该指标评估实体百分比相对于整个蜡烛大小的百分比,并考虑影子百分比相对于蜡烛大小的比例。这种仔细的评估确保只有高概率的 Engul
FREE
Candle Countdown — MT4 精确K线倒计时 Candle Countdown 是一个简单且精确的工具,可在图表上显示 当前K线剩余时间 。 当交易入场依赖K线收盘时,即使几秒钟也非常关键。 该指标帮助您看到准确时间,从而在无需猜测或仓促决策的情况下进行交易。 用于精确控制K线收盘时间的工具。 指标显示内容: 当前K线剩余时间 服务器当前时间 点差(Spread) 止损最小距离(Stop Level) 该计时器独立于行情跳动(tick),通过平台内部定时器更新,即使在市场波动较低时也能保持稳定显示。 在低波动环境下依然可以获得平滑且稳定的倒计时效果。 所有信息显示在带背景的区域中,在任何图表配色下都清晰可见,并且不会影响图表分析。 随着K线接近收盘,计时器颜色会发生变化,帮助您快速判断当前状态。 提供 MT5 版本: Candle Countdown MT5 实际应用 使用该计时器可以提高入场时机和交易控制: 等待信号K线收盘 在新K线开始时同步入场 避免过早决策 指标可自然融入图表界面,不影响分析 : 不影响图表对象 切换周期时保持稳定 不会增加终端负担 计划更
FREE
Power Trend Free
Yurij Kozhevnikov
5 (2)
Power Trend Free - the indicator shows the trend strength in the selected period. Input Parameters The indicator has three input parameters: Period - a positive number greater than one, it shows the number of candlesticks used for calculations. If you enter one or zero, there will be no error, but the indicator will not be drawn. Applied Price - the standard "Apply to:" set meaning data used for the indicator calculation: Close - Close prices; Open - Open prices; High - High prices; Low - Low p
FREE
Double HMA lines MTF
Pavel Zamoshnikov
5 (1)
This is a multi-timeframe version of the popular Hull Moving Average (HMA). The Double HMA MTF Light indicator combines two timeframes on a single chart. The HMA of the higher timeframe defines the trend, and the HMA of the current timeframe defines short-term price movements. The indicator is freely distributed and hasn't audio signals or messages. Its main function is the visualization of price movements. If you need advanced functionality of the HMA multi-timeframe indicator (information ab
FREE
Color Macd Tf
Syarif Nur Arief
MACD is well known indicator that still can be use for prediction where price will go next few minutes, hours or even weekly  With colored bar of Macd, your eyes can easily catch when color is changed based what market price movement to find any early trend on market. here is the parameter of the indicator: TF_MACD , default is 1 Hour , this mean you can see clearly MACD of 1 Hour TimeFrame on Lower TimeFrame. InpPrice , default is Price Close , this is original MACD parameter from Metaquotes st
FREE
PZ Penta O MT4
PZ TRADING SLU
2.33 (3)
The Penta-O is a 6-point retracement harmonacci pattern which usually precedes big market movements. Penta-O patterns can expand and repaint quite a bit. To make things easier this indicator implements a twist: it waits for a donchian breakout in the right direction before signaling the trade. The end result is an otherwise repainting indicator with a very reliable trading signal. The donchian breakout period is entered as an input. [ Installation Guide | Update Guide | Troubleshooting | FAQ | A
FREE
Trendline indicator
David Muriithi
2 (1)
Are you tired of drawing trendlines every time you're analyzing charts? Or perhaps you would like more consistency in your technical analysis. Then this is for you. This indicator will draw trend lines automatically when dropped on a chart. How it works Works similar to standard deviation channel found on mt4 and mt5. It has 2 parameters: 1. Starting Bar 2. Number of bars for calculation The   starting bar   is the bar which drawing of the trend lines will begin, while the   number of bars for c
FREE
Wise Men Indicator demo
Bohdan Kasyanenko
3 (2)
The indicator displays signals according to the strategy of Bill Williams on the chart. Demo version of the indicator has the same features as the paid, except that it can work only on a demo account . Signal "First Wise Man" is formed when there is a divergent bar with angulation.  Bullish divergent bar - with lower minimum and closing price in the upper half. Bearish divergent bar - higher maximum and the closing price at the bottom half. Angulation is formed when all three lines of Alligator
FREE
With this system you can spot high-probability trades in direction of strong trends. You can profit from stop hunt moves initiated by the smart money! Important Information How you can maximize the potential of the scanner, please read here: www.mql5.com/en/blogs/post/718109 Please read also the blog about the usage of the indicator: Professional Trading With Strong Momentum This FREE Version of the indicator works only on EURUSD and GBPUSD. The full version of the indicator can be found here:
FREE
GS spread
Aleksander Gladkov
The indicator calculates the current spread for each tick using the formula Spread=(ASK-BID)/Point. Schedule of changes in the boundaries spread over the timeframe displayed in a separate window from the date of accession of the indicator. Two lines corresponding to the minimum and maximum spread values are displayed. The indicator window is self-adjusted according to the minimum and maximum values from the moment of launch. The minimum and maximum values for the entire period of the indicator o
FREE
“可调分形” - 是分形指标的高级版本,非常有用的交易工具! .......................................................................................... - 众所周知,标准分形 MT4   指标根本没有设置 - 这对交易者来说非常不方便。 - 可调分形解决了这个问题 - 它具有所有必要的设置: - 指标的可调周期(建议值 - 高于 7)。 - 价格高点/低点的距离可调。 - 可调分形箭头设计。 - 指标内置移动和 PC 警报。 点击这里查看高质量的交易机器人和指标! 这是仅在此 MQL5 网站上提供的原创产品。 ....................................................
MTF Stochastic and RSI
Georgiy Gazaryan
5 (2)
A simple but effective helper that will allow you to track both global and local market trends. The indicator combines the work of two oscillators: Stochastic and RSI. Both indicators can be set to any timeframe. Advantages of Use Multitimeframe - you can adjust both indicators to the desired timeframes. To obtain the entry points, you can use the Elder's triple screen system. Highly customizable - you can configure not only the parameters of the indicators, but also their appearance (color and
FREE
这种用于从无穷远衡量货币强弱的创新指标是长期交易的黄牛和交易者不可或缺的助手。 分析货币强弱的系统早已被世界领先的交易者所熟知并在市场上使用。 没有这种分析,任何套利交易都是不完整的。 我们的指标很容易确定基础货币相对于彼此的强弱。 它显示所有或当前货币对的折线图,允许即时分析和搜索最强的入口点。 该指标直观,允许您快速找到并切换到任何一对,具有可放置在地下室和主图表上的移动面板。 通知货币强度变化的计时器模式使交易者有机会在手机上收到通知。  使用货币功率计无穷大指示器的几种策略: 1. 使用货币强度的线性显示图表搜索交叉点作为新兴趋势的信号 2. 在趋势反转信号出现后,向强势货币方向反弹 3. 使用货币强度发散分析扭转当前趋势 4. 使用其他无限指标向强势货币方向交易 
FREE
Free automatic fibonacci
Tonny Obare
4.67 (49)
Free automatic Fibonacci is an indicator that automatically plots a Fibonacci retracement based on the number of bars you select on the BarsToScan setting in the indicator. The Fibonacci is automatically updated in real time as new highest and lowest values appears amongst the selected bars. You can select which level values to be displayed in the indicator settings. You can also select the color of the levels thus enabling the trader to be able to attach the indicator several times with differe
FREE
UPD1 X00 Levels
Vitaliy Kuznetsov
5 (10)
该指标在图表上显示圆形水平。 它们也被称为心理、银行或主要参与者级别。 在这些水平上,多头和空头之间存在真正的斗争,许多订单的积累导致波动性增加。 该指标会自动调整到任何工具和时间范围。 当80水平被突破然后测试时,我们买入。当20级被突破然后测试时,我们卖出。目标是00。 注意力。由于强大的支撑   。   和阻力位,价格可能略低于 00 水平。 输入参数   。 Bars Count - 线条长度(以条为单位) 。 Show 00 Levels - 显示或不显示 00 级   。 Show 10, 90 Levels   。 Show 20, 80 Levels   。 Show 30, 70 Levels   。 Show 40, 60 Levels   。 Show 50 Levels   。 N Lines - 限制图表上级别数的参数   。 Distance 00 Levels - 层间距离(自动或手动) 。 Line Position - 图形前面或后面的线   。 Visual Button - 按钮显示(启用/禁用)   。 Corner - 按钮锚定角度  
FREE
MTF Heiken Ashi MA is a multiple timeframe Heiken Ashi & Moving Average indicator. Fully customizable for advanced & unique Heiken Ashi & Moving Average calculations. Key Features Modified appearance and appeal from the traditional using only H eiken Ashi MA bodies. MTF Higher or lower timeframes available making this it great for trends and scalping. There are many settings that can be non-repaint for signals at a new bar and at bar 0. Inputs Timeframe  = PERIOD_CURRENT - timeframe of Moving
FREE
" Scalping and dethatching " is a signal forex indicator for scalping, which visually shows the direction of the current trend on the chart. This indicator allows you to determine the direction of the current trend with an accuracy of up to 90% within 3 seconds after being added to the chart. The universality of the indicator lies in the fact that it works on all currency pairs. All currency pairs are subject to the same fundamental market laws, so the " Scalping and dethatching " indicator wor
WaveTrend Oscilator
Ibrahim Kisioglu
Wavetrend Oscillator Indicator — Version 1.0 The Wavetrend Oscillator is a momentum-based technical analysis tool. It is designed to highlight potential momentum shifts, areas that may be overbought or oversold, and the prevailing bias when confirmed by a higher timeframe filter. How it works WT1 and WT2 Lines : Crossovers between these lines are used to indicate changes in momentum. WT1 crossing above WT2 suggests bullish conditions. WT1 crossing below WT2 suggests bearish conditions. WT3 High
FREE
SuperTrend V
Muhammad Hassaan
*This is TradingView indicator converted to mql4* The SuperTrend V indicator is a popular technical analysis tool used to identify trends and potential trend reversals in financial markets. It is based on the concept of the SuperTrend indicator but incorporates additional features and variations. The SuperTrend V indicator uses a combination of price action and volatility to determine the trend direction and generate trading signals. Here are the key components and features of the indicator: Ca
FFx Momentum
Eric Venturi-Bloxs
4 (1)
The purpose of this new version of the MT4 standard indicator provided in your platform is to display in a sub-window multiple timeframes of the same indicator. See the example shown in the picture below. But the display isn’t like a simple MTF indicator. This is the real display of the indicator on its timeframe. Here's the options available in the FFx indicator: Select the timeframes to be displayed (M1 to Monthly) Define the width (number of bars) for each timeframe box Alert pop up/sound/ema
FREE
PZ Turtle Trading
PZ TRADING SLU
3.8 (10)
海龟交易指标实现了原始的 Dennis Richards 和 Bill Eckhart 的交易系统, 俗称海龟交易法。这个趋势跟踪系统依据突破历史高点和低点来下单或平仓: 它与“低买高卖”方式完全相反。主要规则是 "在 N-日突破时下单,并在 M-日的高点或低点突破时获利了结 (N 必须在 M 之上)"。 介绍 海龟交易法的传奇始于美国千万富翁、大宗商品交易商 Richard Dennis,和他的商业伙伴 William Eckhardt 之间的赌局。Dennis 相信交易者可以通过培养而成功; Eckhardt 不认可这种主张,他认为遗传是决定因素,而娴熟的交易者对于明晰市场趋势拥有与生俱来的敏锐感觉。而在 1983-1984 发生的事件,成为交易史上的著名实验之一。平均每年 80%,计划成功,表明任何人如果具有良好的规则和足够的资金,都可以成功。 在 1983 中期,Richard Dennis 开始在华尔街日报上刊登广告,他征求申请者参加他自己的交易理念培训,无须任何经验。他最终召集了具有不同背景的约 21 名男性和两名女性。这群交易者被集中到芝加哥市中心一座家俱稀少的大房间中
FREE
它预测最有可能的短线价格走势,基于先进的数学计算。 功能 评估即时价格走势; 计算实时市场趋势; 计算最重要的支撑和阻力位; 算法优化,在进行复杂数学计算时系统资源消耗最小。 最佳性能自调整, 所以它可以工作于任何品种 (无论它有多奇葩) 以及任意时间帧; 与所有 MetaTrader 平台兼容, 不管报价位数或其它参数; 与所有其它工具兼容 (指标, EA 或脚本),不会减缓终端性能和交易操作。 注: 为了获取多个时间帧的数值, 密集区域和附加的功能,您必须适用 专业版 或 大师版 。 介绍 构建一般交易策略的许多经典指标都基于简单的数学,不是因为创建这些指标时,没有优秀的数学家 (事实上,那时的数学家有可能比现在更好),但因为电脑还不存在,或是它们太简单,持续处理复杂数学操作的能力低下。如今,任何智能手机都完胜几十年前最强大的计算机。所以,处理海量信息的能力如今不再是限制,除了极其复杂的模拟处理。 高级价格走势预测者 (APMP) 指标利用当前处理能力的优势,通过一些最先进的数学、统计和概率的概念,来捕获价格波动的本质。 APMP 不能用来预测它自己,由于价格运动是一种非平稳随
FREE
Special Trend Oscillator is an indicator designed to detect trend change points and measure the power of the current trend. This indicator is a different model of the MACD indicator. The indicator has two channels. The blue channel is the upper line of the upward trend. The red channel line is the underscore of the downward trend. Buy when the trend line reaches the red line. Sell when the trend line reaches the blue line. Our Popular Products Super Oscillator HC Cross Signal Super Cross Trend S
CCI in MA
Nikolaos Pantzos
4.75 (4)
iCC in iMA is indicator to change color in iMA if iCCI crosses level up (up trend) or crosses level down (down trend). It is a useful tool to track when the upside and the downside iCCI on iMA. You can to get source code from here . Parameters MA_Periods —Period for iMA. MA_Method — Method for iMA. CCI_Periods —Period for iCCI. CCI_ApliedPrice — Price used for iCCI. CCI_LevelsUp — Level iCCI for up trend. CCI_LevelsDN — Level iCCI for down trend. BarsCount — How many bars will show the line. R
FREE
Extremum by trend
Anton Iudakov
5 (2)
Looking for entry points along the local trend without repaint! Arrows indicate entry points. Based on classic indicators. The indicator is easy to use. Settings Наименование Описание Frequency factor Signal frequency. The less, the more often. This affects the quality. Recommendations Recommended for use on major currency pairs. Timeframe from m5, m15, m30 Subscribe to my telegram channel, where we discuss intraday trading, ideas, indicators, etc., a link in my profile contacts.
FREE
该产品的买家也购买
Gann Made Easy
Oleg Rodin
4.83 (160)
Gann Made Easy 是一个专业且易于使用的外汇交易系统,它基于使用先生理论的最佳交易原则。 W.D.江恩。该指标提供准确的买入和卖出信号,包括止损和获利水平。您甚至可以使用推送通知在旅途中进行交易。 购买后请联系我,即可免费获得交易指导和超棒的额外指标! 您可能已经多次听说过江恩交易方法。通常 Gann 的理论不仅对于新手交易者而且对于那些已经有一定交易经验的人来说都是非常复杂的东西。这是因为江恩的交易方法在理论上并不那么容易应用。我花了几年时间来完善这些知识,并将最好的原则应用到我的外汇指标中。 该指标非常易于应用。您所需要的只是将其附加到您的图表并遵循简单的交易建议。该指标不断进行市场分析工作并寻找交易机会。当它检测到一个好的入口点时,它会为您提供一个箭头信号。该指标还显示止损和获利水平。 换句话说,当您像先生一样进行交易时,该指标会为您提供最佳江恩建议。江恩亲自告诉你此时此刻该做什么。但最好的部分是您不需要了解任何有关江恩交易原则的知识,因为该指标会为您完成整个市场分析工作。
M1 Sniper
Oleg Rodin
5 (21)
M1 SNIPER 是一款易于使用的交易指标系统。它是一个专为 M1 时间框架设计的箭头指标。该指标可以作为独立的系统在 M1 时间框架下进行剥头皮交易,也可以作为您现有交易系统的一部分使用。虽然该交易系统专为 M1 时间框架交易而设计,但它也可以用于其他时间框架。我最初设计此方法是为了交易 XAUUSD 和 BTCUSD。但我发现这种方法在其他市场交易中也同样有用。 指标信号既可以顺势交易,也可以逆势交易。我教授一种特殊的交易技巧,帮助您利用指标信号进行双向交易。该方法基于使用特殊的动态支撑位和阻力位区域。 购买后,您可以立即下载 M1 SNIPER 箭头指标。此外,我还为所有 M1 SNIPER 工具用户免费提供下方屏幕截图所示的 Apollo Dynamic SR 指标!这两个指标的组合可以帮助您更轻松、更准确地利用 M1 时间框架进行交易。 购买后请联系我,免费获取交易提示和奖励指标! 祝您交易成功!
Scalper Inside PRO
Alexey Minkov
4.74 (69)
Scalper Inside PRO – Since 2020. An exclusive indicator that utilizes an innovative algorithm to swiftly and accurately determine the market trend. The indicator automatically calculates opening, closing, and profit levels, providing detailed trading statistics. With these features, you can choose the most appropriate trading instrument for the current market conditions. Additionally, you can easily integrate your own arrow indicators into Scalper Inside Pro to quickly evaluate their statistics
Ultimate Sniper Dashboard
Hispraise Chinedum Abraham
4.82 (22)
折扣价为299美元! 未来可能会涨价! 请阅读下面的描述! 终极狙击手仪表盘的最佳进入系统。终极动态水平。(请查看我的产品) 由于MT4多币种测试的限制,终极狙击手仪表盘只适用于实时市场。 介绍Ultimate-Sniper Dashboard! 我们最好的产品包括HA-狙击手、MA-狙击手和许多特殊模式。终极狙击手仪表盘是一个绝对的野兽! 对于任何新手或专家交易者来说,这是最好的解决方案! 永远不要再错过任何一个动作! 对于那些喜欢简单和点数的交易者,我们有一个特别的产品给你。本质上很简单,该仪表板根据多种自定义算法查看28种货币对,完成所有工作。只需一张图表,你就可以像专家一样阅读市场。试想一下,如果你能在任何外汇对开始移动时准确地确定其方向,你的交易会有多大的改善。   我们的系统是为了寻找高概率信号并实时向用户发送警报。没有滞后或错误的信号。 为了保持图表的清洁,你可以在不需要时隐藏Ultimate-Sniper。只需按下箭头按钮即可隐藏仪表板。 Ultimate-Sniper适用于从1分钟到月度的所有时间框架,因此你可以在你选择的任何时间框架上快速发现趋势。 高概率信号
Market Makers
Mohamed Hassan
5 (3)
After purchase, contact me privately to receive 1 month of free testing with EA Forex Proton! This advanced MT4 trading robot automatically executes signals from any MT4 indicator, including Market Makers. The latest version also includes AI integration, allowing each trade signal to be analyzed using Artificial Intelligence. Live Signal with EA Forex Proton: Click here Market Makers is a powerful price action trading system designed to identify high-probability Buy and Sell opportunities based
Trend Screener
STE S.S.COMPANY
4.79 (95)
趋势指标,趋势交易和过滤的突破性独特解决方案,所有重要趋势功能都内置在一个工具中! 它是 100% 非重绘多时间框架和多货币指标,可用于所有符号/工具:外汇、商品、加密货币、指数、股票。 限时优惠:支撑和阻力筛选指标仅售 50美元,终身有效。(原价 250 美元)(优惠延长) 趋势筛选器是有效的指标趋势跟踪指标,它在图表中提供带有点的箭头趋势信号。 趋势分析器指标中可用的功能: 1.趋势扫描仪。 2. 具有最大利润分析的趋势线。 3.趋势货币强度计。 4. 带有警报的趋势反转点。 5. 带有警报的强趋势点。 6. 趋势箭头 每日分析示例,每日信号表现...等与我们的趋势筛选指标,可以在这里找到: 点击这里 限时优惠:Trend Screener Indicator 仅售 50 美元且终身可用。原价 125$) 通过访问我们的 MQL5 博客,您可以找到我们所有的高级指标以及分析示例、每日信号表现...等。 : 点击这里 我们的趋势系统由 2 个指标组成: 1. Trend Screener Indicator:显示趋势仪表盘、图表中的趋势线、入场点...等。 2. Trend
Atomic Analyst
Issam Kassas
5 (5)
首先值得强调的是,该交易指标是非重绘、非延迟的指标,这使其成为手动和机器人交易的理想选择。 用户手册:设置、输入和策略。 Atomic Analyst是一种PA价格行动指标,利用价格的力量和动量来寻找市场上更好的机会。配备了高级过滤器,可帮助去除噪音和假信号,并提高交易潜力。使用多层复杂的指标,Atomic Analyst扫描图表,并将复杂的数学计算转化为任何初学者都能理解并用来做出一致交易决策的简单信号和颜色。 “Atomic Analyst”是专为新手和经验丰富的交易者量身定制的综合交易解决方案。它将高级指标和一流功能融合为一体的交易策略,使其成为所有类型交易者的多功能选择。 日内交易和剥头皮策略:专为快速准确的日内交易和短期交易而设计。 日内和摆动交易策略:可用作追求价格大幅波动的日内和摆动交易者的可靠工具。 多货币和市场:凭借其可靠的精度,在不同的工具和市场上运作。 多个时间框架:可在多个时间框架上使用,性能良好。 稳定性:所有指标均不重绘、不重绘和不滞后,确保可靠的信号。 信号清晰度:提供箭头信号,用于清晰的入场和出场点。 实时警报:通过交易入场、SL和TP警报通知交易者
Super Signal – Skyblade Edition 專業級無重繪 / 無延遲趨勢信號系統,擁有卓越勝率 | 適用於 MT4 / MT5 在較低的時間週期上效果最佳,例如 1 分鐘、5 分鐘與 15 分鐘圖表。 核心特色: Super Signal – Skyblade Edition 是一套專為趨勢交易設計的智能信號系統。 其採用多重濾波邏輯,僅篩選出具有明確方向性、動能強勁且波動結構健康的走勢進場點。 本系統 不預測高點或低點 ,只有在同時滿足以下三項條件時才會觸發交易信號: 趨勢方向明確 動能持續增強 波動率結構穩定 此外,系統還結合市場流動性分析,以進一步提升信號的準確性與觸發時機。 信號特性: 所有箭頭信號皆為 100% 無重繪,無延遲 信號一旦出現即固定於圖表,不會閃爍或消失 提供圖表箭頭、資訊面板、彈出通知、聲音提示及推播訊息 支援 EA 呼叫(Buffer 輸出),可整合至自動化交易或信號跟單系統 提供預設參數模板,免調整即可使用,適合新手快速上手 總結: Super Signal – Skyblade Edition 是一款邏輯清晰、穩定高效的專業趨勢型
介绍 ON Trade Waves Patterns Harmonic Elliot Wolfe,这是一款高级指标,旨在使用手动和自动方法检测各种市场模式。以下是它的工作原理: 谐波模式: 该指标可以识别出现在您图表上的谐波模式。这些模式对于练习谐波交易理论的交易者非常重要,正如Scott Carney的书《谐波交易第1卷和第2卷》所描述的那样。无论您是手动绘制它们还是依赖自动检测,ON Trade Waves Patterns都可以胜任。 控制面板: 我们配备了一个用户友好的控制面板,它会保存您的图表和时间帧设置,使您可以轻松切换不同配置。您甚至可以最小化它以最大化图表空间。如果您更喜欢使用其他分析工具,只需单击关闭按钮即可隐藏所有指标数据。 模板保存: 当您自定义设置或添加其他指标,如移动平均线或布林带时,该指标会自动保存您的模板。这意味着您可以随时轻松加载您喜欢的设置。 优化显示: 对于Windows 10用户,我们建议调整您的DPI设置以获得高清设备上的最佳屏幕体验。右键单击MetaTrader图标,选择“兼容性”,然后选择“更改高DPI设置”,将其设置为“系统(增强)”。
Dynamic Scalper System
Vitalyi Belyh
5 (1)
“ Dynamic Scalper System ”指标专为在趋势波内进行剥头皮交易而设计。 已在主要货币对和黄金上进行测试,并可与其他交易工具兼容。 提供顺势短线建仓信号,并提供额外的价格变动支持。 指标原理: 大箭头决定趋势方向。 在趋势波内,我们采用一种生成小箭头形式的剥头皮交易信号的算法。 红色箭头代表看涨方向,蓝色箭头代表看跌方向。 敏感的价格变动线会沿着趋势方向绘制,并与小箭头信号协同作用。 信号运作方式如下:当线在适当时刻出现时,将形成入场信号;在出现线时,持仓;线完成后,平仓。 建议的操作时间范围为M1 - H4。 箭头在当前K线上方形成,如果下一根K线已开仓,则不会重新绘制上一根K线上方的箭头。 输入参数 Trend Wave Period - 趋势方向(大箭头)的周期,改变趋势波的时间间隔。值 1 表示趋势方向的最长持续时间,参数值越大,持续时间越短。 Scalper Arrows Period - 信号箭头(小箭头)的计算周期,改变入场信号的生成频率。值 3 表示最频繁的生成频率,参数值越大,箭头频率越低,准确度越高。 这些参数可以根据不同的时间范
PRO Renko System
Oleg Rodin
5 (30)
PRO Renko Arrow Based System for trading renko charts.  准确的信号交易任何外汇工具. 另外,我将免费提供系统的附加模块! PRO Renko系统是RENKO图表上高度准确的交易系统。该系统是通用的。 该交易系统可应用于各种交易工具。 该系统有效地中和了所谓的市场噪音,打开了获得准确反转信号的通道。 该指标易于使用,只有一个参数负责产生信号。 您可以很容易地使算法适应您感兴趣的交易工具和renko酒吧的大小。 我很乐意通过提供任何咨询支持来帮助所有客户有效地使用该指标。 祝您交易成功!购买后,立即写信给我! 我将与您分享我的建议和我的renko发电机。 另外,我将免费提供系统的附加模块!
TPSpro RFI Levels
Roman Podpora
4.86 (28)
俄语说明 /  英文 说明   -  MT5 版本 主要功能: 显示卖家和买家的活跃区域! 该指标显示所有正确的买入和卖出的初始脉冲水平/区域。当这些水平/区域被激活时,即开始寻找入场点的位置,水平线会改变颜色,并填充特定颜色。此外,还会显示箭头,以便更直观地了解情况。 LOGIC AI - 激活模板时显示用于搜索入口点的区域(圆圈) 为了提高视觉清晰度,添加了使用人工智能搜索入口点的显示区域的功能。 显示更高时间范围内的级别/区域(MTF 模式) 新增使用更高时间间隔显示级别/区域的功能。此外,该指标还具有自动趋势检测功能 (   TPSproTREND PRO   )。 独立的专业分步交易算法 该算法专为顺势和逆势的日内交易而设计。每个活动模板均提供详细的说明。 适用于不同的时间范围 TPSpro RFI 水平指标可用于图表上的任何时间间隔,从分钟(M1)到每月(MN)。 图形和声音警报 该指标提供图形和声音提示,让您不会错过交易信号。 此外,还支持手机通知。 简单有效的活性模板扫描器 这是一个非常紧凑的主动模式扫描仪,当在一个方向上的所有时间间隔内激活模式时,它会自动发出警报并
BTMM State Engine Pro MT4
Garry James Goodchild
BTMM State Engine Pro is a MetaTrader 4 indicator for traders who use the Beat The Market Maker approach: Asian session context, kill zone timing, level progression, peak formation detection, and a multi-pair scanner from a single chart. It combines cycle state logic with a built-in scanner dashboard so you do not need the same tool on many charts at once. What it does Draws the Asian session range; session times can follow broker server offset or be set in inputs. Tracks level progression (L
Linear Trend Predictor — 结合切入点和方向支撑线的趋势指标。按照突破高/低价通道的原理运作。该指标算法过滤市场噪音,考虑波动性和市场动态。 指示器功能  使用平滑方法,显示市场趋势和开立买入或卖出订单的切入点。  适合通过分析任何时间范围内的图表来确定短期和长期的市场走势。  输入参数可适应任何市场和时间范围,允许交易者独立定制指标。  设定的指示信号不会消失,也不会重新绘制——它是在蜡烛收盘时确定的。  几种类型的通知以箭头组合。  该指标既可以作为独立的交易系统使用,也可以作为其他交易系统的补充。  可供任何经验水平的交易者使用。 主要参数 Volatility Smoothing Level - 指标的主要参数,允许您配置指标以实现舒适的操作。 它的数字范围是 1 到 100,从而增加了您可以获得更长趋势运动的平滑度。 通过少量的数字,您可以获得短期走势并快速退出交易。 使用指标进行交易的时刻:  红线和箭头表示下降趋势和卖出开盘信号。止损应根据前一个上分形来设置。  黄线和箭头表示上升趋势和买入开盘信号。止损应根据前一个下分形来设置。
Advanced Currency Strength28 Indicator
Bernhard Schweigert
4.91 (657)
目前40%的折扣 任何新手或专家交易者的最佳解决方案! 这个指标是一个独特的、高质量的、可负担得起的交易工具,因为我们纳入了一些专有的功能和一个新的公式。只需一个图表,你就可以读出28个外汇对的货币强度!想象一下,你的交易将如何得到改善,因为你的交易是在你的手中进行的。想象一下,你的交易将如何改善,因为你能够准确地确定新趋势或剥头皮机会的触发点? 用户手册:点击这里  https://www.mql5.com/en/blogs/post/697384 这是第一本,原版的! 不要买一个毫无价值的崇拜者的克隆品。 特别的 子窗口中的箭头显示强劲的货币势头GAP将指导你的交易! 当基础货币或报价货币处于超卖/超买区域(外盘斐波那契水平)时,在个人图表的主窗口中出现警告信号。 当货币力量从外围区间回落时,回撤/反转警报。 十字星模式的特别警报 可选择多个时间框架,以快速查看趋势! 货币强度线在所有的时间框架中都非常平稳,当使用较高的时间框架来识别总体趋势,然后使用较短的时间框架来确定精确的入口时,效果非常好。你可以根据自己的意愿选择任何时间框架。每个时间框架都由其自身进行了优化。
Easy Breakout
Mohamed Hassan
4.71 (14)
After your purchase, feel free to contact me for more details on how to receive a bonus indicator called VFI, which pairs perfectly with Easy Breakout for enhanced confluence!    Easy Breakout is a powerful price action trading system built on one of the most popular and widely trusted strategies among traders: the Breakout strategy ! This indicator delivers crystal-clear Buy and Sell signals based on breakouts from key support and resistance zones. Unlike typical breakout indicators, it levera
Volatility Trend System - a trading system that gives signals for entries. The volatility system gives linear and point signals in the direction of the trend, as well as signals to exit it, without redrawing and delays. The trend indicator monitors the direction of the medium-term trend, shows the direction and its change. The signal indicator is based on changes in volatility and shows market entries. The indicator is equipped with several types of alerts. Can be applied to various trading ins
Trend Lines PRO
Roman Podpora
5 (1)
TREND LINES PRO 帮助您了解市场真正的方向转变点。该指标显示真实的趋势反转点以及主要参与者重新入场的时机。 您可以看到 BOS线、 趋势变化和更高时间框架的关键水平——无需复杂的设置或不必要的干扰。信号不会重绘,并在K线收盘后仍然保留在图表上。 VERSION MT 5    -   与……搭配使用时,可发挥其最大潜力   RFI LEVELS PRO 指示器 该指标显示的内容: 实际变化 趋势(BOS 线) 一旦信号出现,它就始终有效!这与会重绘的指标有着重要的区别,后者可能会发出信号后又改变信号,从而导致资金损失。现在,您可以更精准、更准确地进入市场。此外,还有一个功能,会在箭头出现后为K线着色,直到达到目标价位(止盈)或出现反转信号为止。 重复条目   以及主要玩家的充值 为了提高寻找入场点时的视觉清晰度,我们创建了一个模块,该模块首先显示买入/卖出区域,并在该区域内寻找最佳入场点。此外,我们还加入了智能逻辑来管理止损位,该逻辑会随着时间的推移逐步降低止损位的大小,从而降低入场交易时的初始风险(移动止损位)。 信号强度水平(BOS) 该指标采用三个显著性等级来衡量
GOLD Impulse with Alert
Bernhard Schweigert
4.67 (12)
这个指标是我们2个产品 Advanced Currency IMPULSE with ALERT  +   Currency Strength Exotics 的一个超级组合。 它适用于所有时间框架,并以图形方式显示8种主要货币和一种符号的强势或弱势冲动! 该指标专门用于显示任何符号的货币强度加速,如黄金、异国货币对、商品、指数或期货。这是它的第一个指标,任何符号都可以被添加到第9行,以显示黄金、白银、石油、DAX、US30、MXN、TRY、CNH等的真实货币强度加速(冲动或速度)。 建立在新的基础算法上,它使识别和确认潜在的交易更加容易。这是因为它以图形方式显示了一种货币的强势或弱势是否正在加速,并测量了这种加速的速度--把它想象成你汽车中的速度表。当你加速时,事情显然会发生得更快,这在外汇市场上也是一样的,即如果你配对的货币正在向相反的方向加速,你就会发现一个潜在的有利可图的交易。 动态市场斐波那契28水平被用作警报触发器,将适应市场活动。如果冲动击中黄色触发线,你将收到警报。然后你就知道作为一个交易员应该做什么。货币对和方向已经给出。只需点击警报按钮,就可以切换到该货
Order Block Hunter
Noha Mohamed Fathy Younes Badr
5 (10)
Order block hunter indicator is the best indicator for  hunt the order blocks that area where there has been a large concentration of limit orders waiting to be executed Order blocks are identified on a chart by observing previous price action and looking for areas where the price experienced significant movement or sudden changes in direction .This indicator does that for you by using very complicated codes and helps you to take the best areas To buy and sell because it make marks at the best a
KT Gaussian Trend Filter MT4
KEENBASE SOFTWARE SOLUTIONS
KT Gaussian Trend Filter 结合高斯滤波与线性回归平滑处理,为交易者提供清晰且准确的趋势分析。它生成直观的买入和卖出信号,同时有效地突出市场的长期方向。 功能特点 可自定义的高斯滤波器: 可调节周期和极点设置,优化平滑效果并提升趋势可读性。 线性回归增强: 进一步细化高斯平滑效果,减少市场波动带来的假信号。 多周期扫描仪: 自动检测多个周期的高斯趋势方向,并在面板中清晰显示。 回撤带功能: 便于在趋势回调阶段识别有效的进场机会。 可自定义颜色设置: 可根据图表风格和个人偏好轻松调整指标配色。 内置提醒功能: 支持弹窗、邮件、推送和声音提醒,实时通知信号变化。 使用方法 该指标提供直观的信号,帮助交易者判断何时进场与出场。一个实用的方法是在回调结束后寻找趋势延续信号。过滤器能有效判断回调是否结束,以及主趋势是否重新启动。 多周期分析: 在不同周期上应用此指标,可更全面地评估趋势一致性并优化入场时机。 控制平滑强度: 过度平滑可能掩盖重要价格变化。建议适度调整设置,以平衡趋势清晰度与灵敏度。 参数设置 Gaussian Period – 定义高斯滤波器的周期长度
Advanced Supply Demand
Bernhard Schweigert
4.91 (299)
现在优惠 40%! 任何新手或专业交易者的最佳解决方案! 该指标是一款独特、高质量、且价格合理的交易工具,因为我们已经整合了许多专有功能和新公式。 依据此更新,您将能够显示双重时间帧区域。 您不仅可以显示一个较高的时间帧,还可以同时显示图表时间帧,加上更高的时间帧:显示嵌套时区。 供需双方所有交易者都会喜欢它。 :) 重要信息披露 高级供需的最大潜力,请访问 https://www.mql5.com/zh/blogs/post/720245   想象您的交易如何得以改善,是因为您能够精准定位入场或目标位吗? 构建于新的底层算法,它可以更轻松地识别出买卖双方之间的潜在失衡。 这是因为它以图形方式展示供需最强劲区域,及其过去的表现(显示旧区域)。 这些功能旨在帮助您更轻松地发现最佳入场区域和价位。 现在您可以针对您的交易品种和时间帧来优化和编辑区域强度! 高级供需指标适用于所有产品和时间帧。 它是一个新的公式,非常新的功能是两个区域强度函数可由用户输入进行调整! 这在交易中是一大优势。 当您学习如何使用专有功能,例如带有价格游离最小 X 因子的区域强度时,您能够判断该区域强劲与否。 供需
Route Lines Prices -  是一款用于寻找价格方向的指标。其简洁的界面包含多种价格行为和未来方向计算算法。这些算法包括基于所用时间周期的波动率计算和价格平滑。 该指标只有一个参数,用于更改“ Calculating price values ”。默认值 1 提供均衡的自动计算, 无需手动配置即可使用。 通过手动更改 2 到 500 之间的值,您可以根据自己的交易系统自定义指标。 建议在 M1 到 H4 的时间周期内使用此指标。适用于任何交易品种。 信号箭头在蜡烛图收盘时生成;不会重绘历史数据。 主图表上提供重复箭头。 提供多种类型的警报。内置的线轨迹计数器基于收盘价工作。这意味着,当出现相反信号时,会确定价格轨迹的数值,并在信号结束后的下一根蜡烛图上显示这些数值。 总计数器将获得的值相加,以便在相应的图表上方便地调整参数。
目前八折优惠! 对任何新手或专家交易者来说都是最好的解决方案! 这个仪表板软件适用于28种货币对。它基于我们的两个主要指标(高级货币强度28和高级货币冲动)。它对整个外汇市场提供了一个伟大的概述。它显示高级货币强度值,货币运动速度和28个外汇对在所有(9)时间段的信号。想象一下,当你可以使用图表上的单一指标观察整个市场,以确定趋势和或剥头皮的机会时,你的交易将得到改善 我们已经在这个指标中建立了一些功能,使你更容易识别强势和弱势货币,同时识别和确认潜在的交易。该指标以图形方式显示货币的强势或弱势是增加还是减少,以及它在所有时间段的表现。 增加的新功能是动态市场斐波那契水平,它适应当前的市场条件变化,这是一个已经在我们的高级货币强度28和高级货币冲动指标中使用的成熟的加分项。 在交易时,总是将弱势货币和强势货币配对,这个新指标将帮助你做到这一点。 用户手册:点击这里  https://www.mql5.com/en/blogs/post/708783 特点  显示每个时间段的ACS28和GAP-speed(冲动)的货币强度值。 列:颜色代码以7种颜色显示货币强度:强势
这是一个预测蜡烛收盘价的指标。 该指标主要用于 D1 图表。 该指标适用于传统外汇交易和二元期权交易。 该指标可以用作独立的交易系统,也可以作为您现有交易系统的补充。 该指标分析当前蜡烛,计算蜡烛本身内部的某些强度因素,以及前一根蜡烛的参数。 因此,该指标预测市场走势的进一步方向和当前蜡烛的收盘价。 由于这种方法,该指标既适用于短期盘中交易,也适用于中长期交易。 该指标允许您设置指标在分析市场情况期间将产生的潜在信号的数量。 在指标设置中有一个特殊的参数。 此外,该指标可以通过图表上的消息、电子邮件以及推送通知的形式通知新信号。感谢您的关注!交易愉快! 购买后一定要写信给我! 我会给你我的交易指标的建议! 还可以获得奖金!
Scalper Vault
Oleg Rodin
5 (36)
Scalper Vault 是一个专业的剥头皮系统,为您提供成功剥头皮所需的一切。该指标是一个完整的交易系统,可供外汇和二元期权交易者使用。推荐的时间范围是 M5。 该系统为您提供趋势方向的准确箭头信号。它还为您提供顶部和底部信号以及江恩市场水平。无论您拥有何种交易经验,该系统都易于使用。您只需要遵循简单的规则并每天重复该过程。 建议将此系统用于主要货币对。感谢您的关注! 请注意,该指标在策略测试器中可能无法正常工作。因此,我建议仅在模拟或真实账户的真实交易条件下使用该系统。 指示器提供所有类型的警报,包括推送通知。 购买指标后请与我联系。我将免费与您分享我的个人交易建议和出色的奖励指标! 祝您交易愉快,盈利!
Miraculous 指标 – 100% 不重绘的外汇和二元期权工具,基于江恩九方图 这个视频介绍的 Miraculous 指标 是一款专为外汇和二元期权交易者开发的高精度、强大交易工具。该指标的独特之处在于它建立在传奇的 江恩九方图 和 江恩振动法则 之上,使其成为现代交易中可用的最精确预测工具之一。 Miraculous 指标 完全不重绘 ,这意味着它的信号在 K 线收盘后不会改变或消失——你看到的就是你得到的。这为交易者提供了可靠且一致的基础,让他们能够自信地进出场交易。 主要特点: 基于江恩九方图和江恩理论构建 100% 不重绘的信号系统 适用于所有时间周期(M1、M5、H1、H4、日线、周线) 适用于外汇和二元期权交易 清晰的买卖信号,准确率高 可用于剥头皮、日内交易或波段交易 兼容大多数 MT4 平台 这款工具旨在帮助初学者和专业交易者做出更好、更明智的决策。无论您是交易货币、指数还是二元期权,Miraculous 指标都将为您在市场中提供所需的优势。
Currency Strength Exotics
Bernhard Schweigert
4.88 (33)
目前8折优惠! 对任何新手或专家交易者来说都是最好的解决方案! 这个指标是专门用来显示任何符号的货币强度,如异国货币对、商品、指数或期货。它是同类产品中的第一个,任何符号都可以添加到第9行,以显示黄金、白银、石油、DAX、US30、MXN、TRY、CNH等的真实货币强度。这是一个独特的、高质量的、负担得起的交易工具,因为我们已经纳入了一些专有的功能和一个新的公式。想象一下,你的交易将如何改善,因为你能够准确地确定新趋势或剥头皮机会的触发点? 用户手册:点击这里   https://www.mql5.com/en/blogs/post/708876 它适用于所有时间框架。你将很快能够看到TREND! 根据新的基础算法设计,它使识别和确认潜在交易变得更加容易。这是因为它以图形方式显示了8种主要货币和一种符号的强弱。 该指标显示了8种主要货币(澳元加元瑞士法郎欧元英镑日元新西兰美元)的强弱线,再加上一个符号! 该指标显示了符号的真实价值。例如:对于XAUUSD(黄金):价格以美元报价。如果黄金在上涨,你怎么能知道是黄金的强势还是美元的弱势?只有当黄金走强时,我们才会进行交易。该指
Bull versus Bear
Mohamed Hassan
4.5 (18)
Huge 70% Halloween Sale for 24 hours only!  Send us a message after your purchase to receive more information on how to get your  BONUS  for FREE  that works in great combination with Bull vs Bear ! Bull versus Bear is an easy-to-use Forex indicator that gives traders clear and accurate signals based on clear trend retests . Forget about lagging indicators or staring at charts for hours because  Bull vs Bear provides real-time entries with no lag and no repaint, so you can trade with confiden
Auto Optimized Parabolic RSI: 高级 3D 动量引擎 大多数零售指标之所以失效,是因为它们依赖于静态输入,一旦市场波动率发生变化,这些输入就会崩溃。Auto Optimized Parabolic RSI 通过不断重新计算自身的数学优势,解决了“指标衰退”的问题,将机构级别的量化自适应能力直接引入您的 MT5 终端。 核心优势:定制的内存 3D 优化   标准的自动优化器通常会导致 MT5 平台卡顿,因为它们通过标准的指标调用使终端超载。该工具完全绕过了这些性能瓶颈。内部引擎采用定制的原生基于 RAM 的计算器构建,每次加载图表或更改时间周期时,它都会执行极速的 3D 网格搜索。它同时扫描 RSI 周期(频率)、SAR 步长(加速度)和 SAR 最大值(速度限制),在绝对的毫秒级时间内测试数以万计的参数组合,且完全不会拖慢您的平台。它不是仅仅寻找一个“不错”的设置,而是映射整个参数空间,以寻找资产当前动量结构的绝对全局最大值。 严格的财务评分与逼真的交易模拟   与基于抽象“指标点数”进行优化评分的业余工具不同,该引擎的 3.10 版本严格与资金数学挂钩。每
作者的更多信息
Trend Anthropoid is a trend indicator that allows you to effectively determine the direction of the current trend, as well as identify potential reversal points. The indicator makes it possible to classify the direction of price movement by determining its strength. Solving this problem helps to enter the market on time and get the desired result. Let's start with the benefits. Allows you to determine the current trend. You can quickly understand which trend is currently developing in the mark
Trend Logic
Yvan Musatov
The Trend Logic indicator provides an opportunity to classify the direction of price movement by determining its strength. Solving this problem helps to enter the market on time and make a good profit. It is extremely important for any trader to correctly determine the direction and strength of the trend movement. Unfortunately, there is no single correct solution to this problem. Many traders trade at different time frames. For this reason, the received signals are perceived subjectively. The
Trend Goblin
Yvan Musatov
The Trend Goblin indicator identifies the mainstream trend. They help to analyze the market on a selected time frame. Easy to set up and works on all pairs and all time frames. Trend indicators provide an opportunity to classify the direction of price movement by determining its strength. Solving this problem helps investors enter the market on time and get good returns. It is extremely important for any trader to correctly determine the direction and strength of the trend movement. Unfortunat
The Analytical Trend indicator can track sustained price movement in a specific direction. In this case, the movement itself can be downward, upward or sideways, when the market movement does not have a pronounced direction. The indicator works on the basis of two moving averages and an oscillator. Using the signal search algorithm, the indicator generates signals in the form of arrows. Flexible settings allow you to receive more accurate signals for opening positions. You can quickly understan
The Supernatural channel is determined using a special algorithm, marker points are used to determine the movement of the channel. The Supernatural channel consists of two lines, red and blue, that make up the channel. Simple, visual and efficient use. Can be used for intra-channel trading. The indicator does not redraw and does not lag. Works on all currency pairs and on all timeframes.
Channel Oscillations is a non-redrawing channel indicator based on moving averages. The key difference between the Channel Oscillations indicator and other channel indicators is that Channel Oscillations does not take into account simple moving averages, but double-smoothed ones, which, on the one hand, makes it possible to more clearly determine the market movement, and on the other hand, makes the indicator less sensitive.
Diogenes
Yvan Musatov
Introducing the Diogenes trend indicator! The indicator analyzes market dynamics for pivot points. Shows favorable moments for entering the market in stripes. The principle of operation of the indicator is to automatically determine the current state of the market when placed on a chart. Ready-made trading system. Can be used as a channel indicator or level indicator! This indicator allows you to analyze historical data and, based on them, display instructions for the trader for further action
The Trend Champion indicator works on all timeframes and currency pairs. The indicator should be used as an auxiliary tool for technical analysis, it helps to determine the direction of the trend: either upward or downward price movement for a particular currency pair. Can be used along with oscillators as filters. Trend Champion is a trend indicator. Arrows indicate favorable moments and directions for entering the market. The indicator can be used both for pipsing on small periods and for lo
Qubit Trend
Yvan Musatov
The Qubit Trend indicator works using the cyclical-wave dependence function. Thus, all entry points will be optimal points at which movement changes. Entry points should be used as potential market reversal points. The default indicator settings are quite effective most of the time. You can customize them based on your needs. But do not forget that the approach must be complex, the indicator signals require additional information to enter the market.
Trend Mobile
Yvan Musatov
The regression channel is one of the most popular technical analysis tools among traders. First, the indicator draws a trend line between two points, then on its basis it builds a channel of two parallel lines, which will be at the same distance from the regression line. The term linear regression belongs to the field of statistics. The center line of the channel is the trend line. To calculate it, the least squares method is used. The line above the center line acts as resistance for the pric
Control Shot
Yvan Musatov
Control Shot - Unique indicator for identifying trends. The new system adapts to the market, eliminates additional conditions and copes with its task. A revolutionary new way to identify the start of a trend early. The trend indicator, shows signals, can be used with an optimal risk ratio. It uses reliable algorithms in its calculations. Shows favorable moments for entering the market with arrows, that is, using the indicator is quite simple. Tired of adjusting the indicator settings, wasting
Planned transition is a trend indicator that will help a trader to determine the direction of trade. The indicator has a complex algorithm of work. But for the user, only two lines remain, the red line indicates a sell trend, and the blue line indicates a buy trend. Thus, it is quite simple to interpret the indicator signals. The indicator works on different timeframes; to work with lower timeframes, it is recommended to decrease the indicator period for more frequent entries. To work on higher
Modify Trend
Yvan Musatov
Modify Trend - Unique indicator for identifying trends. The indicator has a complex algorithm of work. But for the user there are only two colors of arrows, red indicates a sell trend, blue indicates a buy trend. Thus, it is quite easy to interpret the indicator signals. The indicator works on different timeframes; to work with lower timeframes, it is recommended to decrease the indicator period for more frequent entries. To work on higher timeframes, on the contrary, increase. The new system ad
Just download the Quarter Strike indicator and embrace your dream. Trading within the volatility range has always attracted traders, because most often it is simple instruments that turn out to be the most profitable. The Quarter Strike indicator is a variant of constructing a price channel that gives signals of sufficiently high accuracy on any instruments and time periods. Bias or other additional parameters are not applied, that is, the indicator evaluates only the real dynamics. By default
Trinitys
Yvan Musatov
The Trinity indicator will tell you whether you have configured the indicator correctly, while you can specify the history interval in the bars that interests you. Look at the numbers on the chart near the arrows! These are pips of profit from a series of entries on the indicator. Profit pips are calculated at the specified interval. The signal can be read without any problems by any bot. Trading within the volatility range has always attracted traders, because most often it is simple instrumen
Spv
Yvan Musatov
The SPV indicator clearly reflects the cyclical nature of the market. Just one key setting! If it is equal to one, then a fast cycle is displayed, but if, for example, the parameter is 12, then the indicator looks for a cycle in the last 12 bars. You can see the ups and downs of the indicator alternate and have such dependence on the market, which can be used to draw conclusions to predict price behavior. Also, indicators can be combined with each other. Also, the indicator can indicate the qual
SPV Cross
Yvan Musatov
The SPV Cross indicator is based on the SPV  indicator. Works as two indicators together on the same chart. With different settings, you can react to the intersection of lines. Clearly reflects the cyclical nature of the market. Just two key settings! It works on the basis of the principle - one is fast and the other is slow. You can see the ups and downs of the indicator alternate and have such a relationship with the market, which can be used to draw conclusions to predict price behavior. The
SPV Corr
Yvan Musatov
The SPV Corr indicator displays the average percentage correlation between the bar's body and its shadows. A very effective system for building various filters and market entry confirmations. It fixes cyclicality and can be used in trading in different ways. You can see the ups and downs of the indicator alternate and have such a relationship with the market, which can be used to draw conclusions to predict price behavior. Also, indicators can be combined with each other. The value of the indica
SPV Body
Yvan Musatov
The SPV Body indicator displays the average analysis of the intersection of adjacent bars. The indicator can easily detect unusual market movements which can be used as a filter. For clarity, poke the graphs to the very beginning of the history when the bars were incomplete, and the indicator will easily display this anamaly. A very effective system for building various filters and confirmations of market entry, to exclude anomalies from trading. It also fixes cyclicity, it turns out that the in
The SPV Volatility indicator is one of the most effective filters. Volatility filter. Shows three volatility options. The so-called limit, real, and the last most effective filter for the filter is the percentage filter. Percentage display of folatility shows the ratio of limit to real volatility. And thus, if we trade in the middle of the channel, then it is necessary to set a condition that the percentage is less than a certain indicator value. If we trade on the channel breakout - following t
Mastodon
Yvan Musatov
Mastodon - displays potential market entry points. According to the wave theory, Mastodon displays the course of a large wave, while the oscillator can specify the entry point, that is, catch the price movement inside it, i.e. small “subwaves”. By correctly understanding the wave nature of price movements and using the Mastodon indicator in conjunction with an oscillator, you can create your own trading system, for example, entering the market after a large wave has formed and then exiting whe
GladiatorGo
Yvan Musatov
The advantage of working with the Gladiator signal indicator is that the trader does not need to conduct technical analysis of the chart on his own. The tool generates ready-made signals in the form of directional arrows. The indicator is considered effective as it does not redraw its signals. This tool is an arrow (signal) one and works without redrawing. Its signals are based on a robust algorithm. Gladiator does not change its readings. Daily and session ranges can be useful for confirming
Signal Casablanca - Arrow technical indicator in the Forex market without redrawing. Able to give hints with minimal errors. It combines several filters, displaying market entry points with arrows on the chart. You can note the accuracy and clarity of the signals of this pointer indicator. Having seen a signal to buy, a trader opens an order without expecting that after a while the initial hint may change to the completely opposite one or simply disappear, having lost its relevance. The signal w
Fargo
Yvan Musatov
Fargo does not change its readings, it is a technical indicator in the Forex market without redrawing. It combines several filters to display market entry arrows on the chart. You can note the accuracy and clarity of the signals of this pointer indicator. When a suitable moment for buying appears, the indicator generates a signal exactly at the moment of its appearance and not below or above the current candle. The arrow will be exactly at the price where the signal appears and will not change
Wonderful
Yvan Musatov
Trend Expert. It works by entering the market with only one buy order and another sell order. It does not form a series of rendering, and therefore you can work with them starting from $ 100! Which is great for beginners. To enter, it uses a system of indicators and a system of dynamic correction of stops depending on volatility, which can be disabled in the settings, but in this case, you will significantly reduce the efficiency of the bot. The bot implements a money management system, which c
Catch
Yvan Musatov
Catch is a reversal indicator and is part of a special category of instruments. it not only analyzes the price movement, but also indicates the points of possible reversals. This facilitates fast and optimal opening of buy or sell orders (depending on the current situation). In this case, the historical data of the analyzed asset must be taken into account. It is the correct execution of such actions that largely helps traders to make the right decision in time and get a profit.
Matios
Yvan Musatov
The Matios indicator visually unloads the price chart and saves analysis time: no signal - no deal, if an opposite signal appears, then the current deal should be closed. This is an arrow indicator for determining the trend. According to the wave theory, Matios displays the course of the wave, while the oscillator can specify the entry point, that is, catch the price movement inside it, i.e. small “subwaves”. By correctly understanding the wave nature of price movements and using the Matios in
Sting
Yvan Musatov
Sting implements indicator technical analysis and allows you to determine the state of the market in the current period and make a decision on a deal based on certain signals. Sting is the result of mathematical calculations based on data on prices and trading volumes. Sting creates signals to perform operations on strong trend movements; it is more expedient to use it for trading when the trend is weakening or sideways. It is used as an additional one, regardless of the phase of the trend mov
Labyrinth
Yvan Musatov
Labyrinth - Trend Expert Advisor. It works by entering the market in lots of buy and sell. It does not form a series of rendering, and therefore you can work with them starting from $ 1000! Which is great for beginners. The bot implements a money management system, which consists in a competent calculation of the risk depending on the deposit. For the correct calculation of the volume, you need to specify the base deposit for calculating the risk. By default, we are talking about a $ 1000 depos
Haine
Yvan Musatov
Haine is a reversal indicator that is part of a special category of instruments. The indicator not only analyzes the price movement, but also indicates the points of possible reversals. This facilitates fast and optimal opening of buy or sell orders (depending on the current situation). In this case, the historical data of the analyzed asset must be taken into account. It is the correct execution of such actions that largely helps traders to make the right decision in time and get a profit. Th
筛选:
无评论
回复评论