Ceres Trend

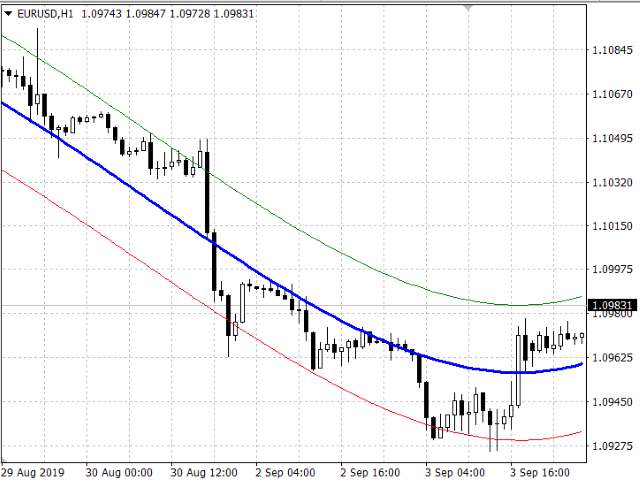
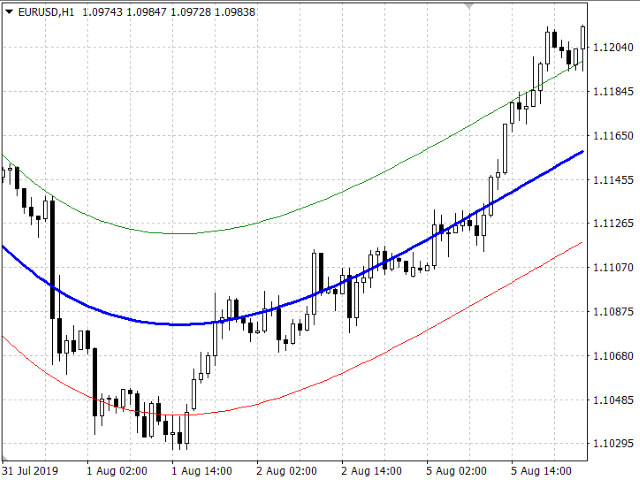
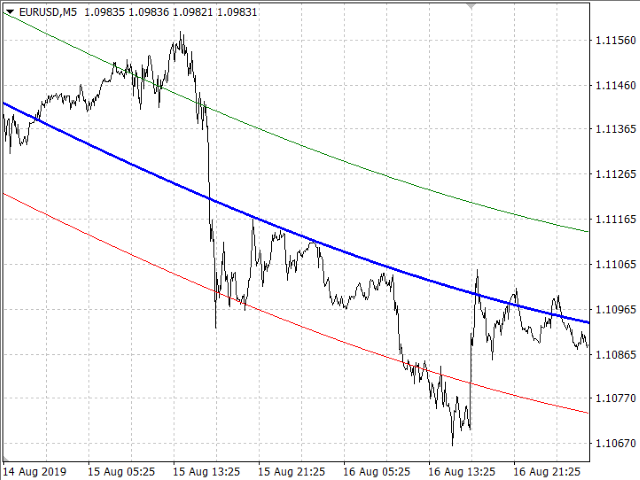
The Ceres Trend Indicator displays polynomial regression on history and in the current time.

In the indicator settings:
module - degree of regression (1 - linear, 2 - parabolic, 3 - cubic, etc.)
koeff is the standard deviation channel multiplier.

The main direction of application of this indicator is the ability to determine the likelihood of further growth. If there is an intersection of the linear regression line from below, then this indicates a trend inhibition and a possible reversal. Similarly, the opposite direction.
推荐产品
Tiger Trend
Leandro Bernardez Camero
Tiger Trend – 基于动态区间的趋势反转指标 加入频道获取最新动态: https://www.mql5.com/en/channels/forexnewadvisor Tiger Trend 是一款动态趋势指标,旨在通过根据近期价格区间计算的自适应支撑和阻力水平,识别潜在的趋势反转。它通过分析收盘价相对于这些动态阈值的位置,帮助交易者识别动能可能发生转变的时刻。 核心概念包括: 基于平均价格区间和用户定义的风险参数,计算动态支撑/阻力水平 当价格收盘高于或低于这些自适应水平时,检测趋势方向变化 通过箭头在图表上标记潜在买入和卖出反转点 与箭头信号同步的警报系统,实时通知交易者趋势变化 Tiger Trend 特别适用于日内交易和波段交易者,帮助他们尽早识别市场动能的转变。 工作原理 信号生成基于以下逻辑: 区间分析: 指标通过指定数量的K线,计算平均区间以评估当前波动性。 动态阈值: 支撑与阻力水平根据区间及用户设置的风险参数动态调整。 趋势识别: 当价格收盘低于下轨时,表示可能进入下跌趋势;高于上轨时,表示可能进入上升趋势。 信号同步: 箭头在趋势变化检测到的瞬间绘制
Market Trend
Andrey Kozak
Market Trend - a comprehensive system for determining the trend direction. Analyzes the market using a formula which considers the values of multiple technical indicators and other trading strategies. IT determines not only the current trend direction, but also its movement strength. The indicator is intuitive and very easy to use. The information on the current trend direction and its movement strength are displayed on the chart. If the indicator shows "UP!" then an uptrend is currently present
Atom Trend
Svyatoslav Kucher
Determining the current trend is one of the most important tasks of a trading regardless of the trading style. The Atom Trend indicator can help in doing that with a fairly high probability. Atom Trend is a trend recognition indicator, which uses an original calculation algorithm. You can use it on any currency pair and every time frame. It does not change its values. The tick volume can also be used in the calculations as an additional filter. Indicator Parameters Main Settings : VolMode - if
Draw by Hand Tool
John Louis Fernando Diamante
This tool provides a freehand drawing method, to treat the chart space as a blackboard and draw by-hand. Drawings can be made to stick to the CHART (moves with chart scroll), or to stick to the WINDOW (does not move with chart scroll). Features: all drawings are individually styled, color, width show/hide each drawing type delete last drawing drawings, on chart and on window, remain through TF changes and terminal re-starts, until the indicator is removed Panel: stylable colors scalable in size
標準的相對強度指數 (RSI) 指標,我們在其中添加了電話和電子郵件通知功能。 在指標設置中,您可以指定指標的上限和下限,達到指標將向您發送通知到您的手機和電子郵件。 通知將以以下格式發送:貨幣對+時間範圍+通知時間。 如果您在交易策略中使用這個免費的標準指標,那麼我們改進的這個指標版本可能對您有用。 在指標設置中還有免費版本中的所有標準參數。您還可以在指示器中更改線條的顏色及其粗細。 這些參數在指標設置中可用。 指標設置: period - 指數計算的平均週期。 applied_price - 應用價格。 可以是 ENUM_APPLIED_PRICE 枚舉值之一。 最大值 - 當指標達到此值時,交易者會通過電話和電子郵件收到通知。 最小值 - 當指標達到此值時,交易者會通過電話和電子郵件收到通知。
"Gradient adaptive rsi mt4" - 自适应外汇指标 RSI,在价格图表上显示为梯度。 该指标帮助交易者确定当前趋势的方向、趋势的强度、趋势反转点。 “梯度自适应 rsi mt4”- 为 Metatrader4 平台创建,可以在所有货币对和时间范围内工作。 在设置的帮助下,这个“梯度自适应 rsi mt4”指标可以适应不同的交易策略。 “梯度自适应 rsi mt4”指标使用内存交换缓冲区进行工作,因此可以轻松集成到任何机器人中并实现自动化。 "Gradient adaptive rsi mt4"   指标的优势: 很好的直观的展示了趋势的方向 显示价格反转点 显示趋势的强度 "Gradient adaptive rsi mt4" 指标的设置: Step_period - 指标计算周期。 Smooth - 平滑值的方法。 Relativity——价值适应系数。 bars - 图表上应显示指标的柱数。 size_arrow - 出现在信号线交叉点的箭头的大小。
SuperRSI
Andriy Sydoruk
The SuperRSI indicator is an advanced index of internal strength. The indicator shows not the relative strength of the trading instruments being compared, but the internal strength of a single instrument, therefore, it is the “Internal Strength Index”. This is an advanced form of the SuperRSI indicator. It converts the signal so that low-frequency components are delayed much more than high-frequency components. In general, the data of the last bar have more weight than previous data, like an exp
Introduction "Smart money" is money invested by knowledgeable individuals at the right time, and this investment can yield the highest returns. The concept we focus on in this indicator is whether the market is in an uptrend or downtrend. The market briefly takes a weak and reversal trend with "Minor BoS" without being able to break the major pivot. In the next step, it returns to its main trend with a strong bullish move and continues its trend with a "Major BoS". The "order block" beh
Unique Trend
Andriy Sydoruk
The Unique Trend indicator tracks market trends, ignoring sharp fluctuations and market noise. The indicator is suitable for trading on small timeframes because it ignores sudden price jumps or price corrections due to the reduction of market noise around the average price. The scan at minima and maxima forms the internal boundaries (channel) when calculating the indicator signals. The channel allows you to remove market noise. iMA and iATR are used to generate signals using the author's algor
Quantum Trend Monitor Indicator
QUANTUM TRADING SOFTWARE LIMITED
Currency pairs never go up or down in a straight line. They rise and fall constantly, creating pullbacks and reversals. And with each rise and fall, so your emotions rise and fall. Hope, then fear, then hope. This is when the market will try to frighten you out of a strong position. It is when you are most vulnerable. But not if you have the Quantum Trend Monitor. And here, you even get two indicators for the price of one! The Quantum Trend Monitor has been designed to absorb these temporary pau
Fibonacci Auto Levels
Mohamed yehia Osman
Possible Price reversals levels - based on  Fibonacci + Support +  Resistance Levels Auto levels drawn based on input index (Bars Count )  ---->>> Price Over 50% Fibo line ---> UP TREND ---> BUY when price drop near Support Lines  ---->>> Price Down 50% Fibo line ---> DOWN TREND ---> SELL when price goes up  near Resistance Lines  --->>> The more close price levels ----> the more possibility for price reversals --->>> are you a scalper --> try it on M1 charts with big index like 5000 bars  or
Mood
Gevorg Hakobyan
This indicator is designed for trend trading and it helps in determining the best entry points. To identify the points, it is necessary to follow the signal line. Once the line crosses the zero level upwards - buy, and when it crosses downwards - sell. In addition to the signal line, the indicator also displays the so-called market "mood" in real time in the form of a histogram. The indicator works on all timeframes and with all instruments. The indicator operation required the Moving Average in
Tract
Andriy Sydoruk
Tract - Channel indicator, by which you can place orders like a classic channel indicator. Trading can be carried out inside the channel when the price reaches its borders and turns in the opposite direction from them. In such cases, reversal strategies are used. The channel indicator is designed to work with support and resistance levels and help traders find opportunities to enter the market. Another way to trade a breakout - assumes a situation when the price, upon reaching one or another cha
ImbaTrend Runner - is the trend following manual system for forex/crypto market. It defines medium-term trends and works with it in intraday mode. System shows enter points, profit and loss targets. As a rule profit targets are 2-3 X bigger than loss targets. Indicator is AutoAdaptive and it automatically updates it's settings during trading. Indicator is sensitive to market changes, regular updates helps to stay in relevant trend. Main Indicator's Features Signals are not repaint, late or disap
The arrow indicator without redrawing shows potential entry points into the market in the form of arrows of the appropriate color: the up arrows (usually green) suggest opening a purchase, the red down arrows suggest selling. The appearance of arrows may be accompanied by beeps. It is usually assumed to enter at the next bar after the pointer, but there may be non-standard recommendations. Arrow indicators visually "unload" the price chart and save time for analysis: no signal – no deal, if ther
Robust Filter
Aleksey Ivanov
5 (1)
The Robust filter   indicator is based on the robust filtering algorithm developed by the author using the multi-period averaged moving median. The algorithm for this averaging is shown in the last screenshot.                The indicator calculates and shows: 1. The direction of the trend; 2. Entry and exit points of positions; 3. StopLoss   lines calculated from current price probability distributions and selected probability of closing an order by StopLoss before the trend revers
POWER TO GET WEALTHY TRADING SYSTEMS.  NON REPAINT REVERSAL ARROW AND CHANNEL  Intra-Day trading and Scalping Strategy:   Designed for fast and accurate day trading and short-term trades. Day and Swing Trading Strategy:   Can be used as a reliable tool for day and swing traders who aim for the big moves of the price. Multi Currencies and Markets:   Works on different instruments and markets with its reliable precision. Multi Timeframes:   Can be used on multiple timeframes with good performanc
Crypto Trend Pro
Paulo Martins Barbosa
3 (1)
Concept Crypto Trend  is a system that identify the safest cryptocurrency price trends. This system is focused on a long-term stable growth . It does not need to be constantly updated as it adapts naturally to varied market conditions. No martingale, no grid, no hedge, no other dangerous strategy. Only strict rule-based approach to trading, allowing to maximise return while having risks under control . Get Crypto Trend Pro and never miss the big cryptocurrency movements again. Results Live t
StatChannel
Aleksey Ivanov
5 (1)
The principle of the indicator.               The StatChannel ( SC ) indicator is a development of the Bollinger Bands indicator ( ВВ ).  BB is a moving average, on both sides of which two lines are drawn, separated from it by standard deviations std multiplied by the corresponding coefficient. At the same time, a moving average with an averaging period (2n + 1) bars is always obtained lagging behind n bars.  Sliding std is also lagging behind on n bars, also calculated by (2n + 1) points. Such
Channel FTF
Pavel Verveyko
The Envelopes indicator determines the presence of a trend or flat. It has 3 types of signals, shows the probable retracement levels and levels of the possible targets. The Fibonacci coefficients are used in the indicator's calculations. Signals (generated when touching the lines or rebounding from lines): Trend - the middle line of the Envelopes has a distinct inclination; the lines below the channel's middle line are used for buy trades, the lines above the middle line and the middle line itse
Indicator Candle Direction
Veridiana Adorno Kendrick
Simple indicator that supports decision makers. You will have the candles directions for different timeframes on your screen. That will allowed you to be one more scenario to analyze before you open your orders. In case you would like to have more details, just let me know.. so we can add it to the chart. Multicurrency that in inform you the directions for multi-timeframes!
Reversal Trends
Andriy Sydoruk
Reversal Trend indicator, which recalculates values ​​for a new period without changing the previous ones. According to statistics, more than 85% of traders who prefer aggressive trading suffer losses. The rush and desire to make a profit immediately leads them to frequently open orders at random, much like playing in a casino. The bottom line is disappointing: a few trades, possibly, will bring profits and then losses. To understand the dynamics of the market and use it for profit, you need to
Nice Try Super Diddy Trend – 一款创新的技术分析工具,专为寻求深入理解市场动态的经验丰富交易者而设计。该指标利用复杂的算法计算流动性流动和市场动量,识别潜在的反转点和趋势延续。 独特性与价值 Nice Try Super Diddy Trend 不仅仅是一个信号生成器,它还分析市场的隐藏结构,研究价格波动的幅度和方向,并结合时间周期进行评估。 量子波动性分析 – 确定市场波动强度,帮助过滤虚假突破。 灵活适应市场变化 – 采用基于移动平均线和 RSI 指标计算的动态阈值水平。 适用于多种交易策略 – 既可用于趋势交易,也可用于寻找局部极值点。 如何运作? Nice Try Super Diddy Trend 通过智能算法分析历史数据和当前价格动态,评估市场动量。该指标使用上升和下降标记系统,清晰地可视化市场阶段及潜在入场点。 黄色和红色线条 – 指示潜在上涨或下跌的信号水平。 箭头 – 基于市场动量分析形成的方向标记。 阈值水平 – 动态调整以适应市场结构变化。 指标参数设置 Nice Try Super Diddy Trend 提供高级参
TripleFusion
Rami Fatmi Fernandez
它是一种技术指标,结合了技术分析中最流行的三种振荡指标:MACD、RSI 和随机指标。先进的集成公式结合了各种信号,提供单一、清晰、有效的线路,消除噪音并帮助您快速做出视觉决策。 是什么让这个指标如此独特? 将 MACD、RSI 和随机指标的差异整合为一个组合公式。 像 ATR 一样在单独的窗口中显示结果,使其易于阅读而不会使主图表混乱。 对值进行标准化,使线保持在一致且可比较的范围内。 适合: 剥头皮交易、日内交易或波段交易。 确认进入/退出。 过滤虚假信号。 ️可自定义的参数: RSI 周期。 随机配置(K 和 D)。 MACD 参数(快速、慢速 EMA 和信号)。 建议使用: 将其与您当前的交易系统结合起来以验证信号。当组合线改变方向或跨越某个阈值(例如0)时,可能预示着市场动量的潜在变化。 兼容: MetaTrader 4。 任何时间段的图表。 所有资产(外汇、指数、商品、加密货币)。
Dear traders this is Our new Indicator called Hull Pro MTF Indicator — Precision Multi-Timeframe Trend Visualizer Overview The Hull Pro MTF Indicator is a next-generation Heiken-Ashi-based multi-timeframe visual tool designed for top-down market analysis . It blends the power of Hull Moving Average (HMA) logic and multi-level Heiken-Ashi smoothing to reveal directional bias, volatility ranges, and price symmetry across hourly, daily, weekly, monthly, and yearly structures — all in a single c
Dynamic Levels
Svyatoslav Kucher
Dynamic Levels is a channel indicator of dynamic levels, designed for identification of the price extremums. It allows increasing the efficiency of any strategy due to advanced parameters, which in turn allow customizing it for personal trading style. Dynamic Levels does not change its values, it is suitable for any timeframe and currency pair. Indicator Parameters ChannelPeriod - period for the indicator calculation. ChannelSmoot - smoothing of values. ATRPeriod - volatility calculation period
Gravity Trend
Svyatoslav Kucher
Determining the current trend is one of the most important tasks of a trader, regardless of the trading style. The Gravity Trend indicator will help you do this with a fairly high probability. Gravity Trend is a trend recognition indicator that uses the author's calculation algorithm. The indicator readings do not change under any conditions. The indicator is suitable for any currency pair, any timeframe. Indicator Parameters Main Settings: HistoryBars - the number of bars to display. FirstPe
DMS Fibo
Diogo Mitsunaga Dos Santos
Fibonacci retracements are trend lines drawn between two significant points, usually between absolute lows and absolute highs, plotted on a chart. Intersecting horizontal lines are placed at the Fibonacci levels. Fibonacci retracements are useful tools that help traders identify support and resistance levels. With the information gathered, they can place orders, identify stop-loss levels, and set price targets. Although useful, traders often use other indicators to make more accurate assessments
Octave Fractal Channel — Dynamic Gann-Based Support/Resistance Levels with Auto-Scaling. This indicator plots a dynamic channel based on the fractal structure of price movement. Channel levels adapt to the current symbol and timeframe, making it suitable for use across various financial instruments — from currency pairs to cryptocurrencies and indices. The indicator can be used in combination with other technical tools, such as the RSI oscillator, to provide additional signal filtering. How to
The King of Forex Trend Cloud Indicator is a trend following indicator based on moving averages. The Indicator is meant to Capture both the beginning and the end of a trend. This indicator can be used to predict both short and long terms market trends.  The king of Forex Trend Cloud if paired together with the King of Forex Trend Indicator can give a broad picture in market analysis and forecasts. I have attached images for both the  The king of Forex Trend Cloud on its own and  The king of Fore
该产品的买家也购买
Gann Made Easy
Oleg Rodin
4.83 (149)
Gann Made Easy 是一个专业且易于使用的外汇交易系统,它基于使用先生理论的最佳交易原则。 W.D.江恩。该指标提供准确的买入和卖出信号,包括止损和获利水平。您甚至可以使用推送通知在旅途中进行交易。 购买后请联系我,免费获取交易提示、奖金和 GANN MADE EASY EA 助手! 您可能已经多次听说过江恩交易方法。通常 Gann 的理论不仅对于新手交易者而且对于那些已经有一定交易经验的人来说都是非常复杂的东西。这是因为江恩的交易方法在理论上并不那么容易应用。我花了几年时间来完善这些知识,并将最好的原则应用到我的外汇指标中。 该指标非常易于应用。您所需要的只是将其附加到您的图表并遵循简单的交易建议。该指标不断进行市场分析工作并寻找交易机会。当它检测到一个好的入口点时,它会为您提供一个箭头信号。该指标还显示止损和获利水平。 换句话说,当您像先生一样进行交易时,该指标会为您提供最佳江恩建议。江恩亲自告诉你此时此刻该做什么。但最好的部分是您不需要了解任何有关江恩交易原则的知识,因为该指标会为您完成整个市场分析工作。
M1 Sniper
Oleg Rodin
4.89 (18)
M1 SNIPER 是一款易于使用的交易指标系统。它是一个专为 M1 时间框架设计的箭头指标。该指标可以作为独立的系统在 M1 时间框架下进行剥头皮交易,也可以作为您现有交易系统的一部分使用。虽然该交易系统专为 M1 时间框架交易而设计,但它也可以用于其他时间框架。我最初设计此方法是为了交易 XAUUSD 和 BTCUSD。但我发现这种方法在其他市场交易中也同样有用。 指标信号既可以顺势交易,也可以逆势交易。我教授一种特殊的交易技巧,帮助您利用指标信号进行双向交易。该方法基于使用特殊的动态支撑位和阻力位区域。 购买后,您可以立即下载 M1 SNIPER 箭头指标。此外,我还为所有 M1 SNIPER 工具用户免费提供下方屏幕截图所示的 Apollo Dynamic SR 指标!这两个指标的组合可以帮助您更轻松、更准确地利用 M1 时间框架进行交易。 购买后请联系我,免费获取交易提示和奖励指标! 祝您交易成功!
Game Changer Indicator
Vasiliy Strukov
5 (7)
Game Changer 是一款革命性的趋势指标,适用于任何金融工具,可将您的 MetaTrader 平台升级为强大的趋势分析工具。该指标不会重绘,也不会出现滞后。它适用于任何时间范围,有助于识别趋势,发出潜在反转信号,可用作追踪止损机制,并提供实时警报,以便您快速做出市场反应。无论您是经验丰富的交易员、专业人士,还是寻求优势的初学者,这款工具都能帮助您自信、自律地进行交易,并清晰地了解潜在的趋势动态。 购买后立即联系我,即可获得个人奖励!您可以免费获得我们的强力支撑和趋势扫描指标,请私信我! 请注意,我不在 Telegram 上出售我的 EA 或特殊套件,它们仅适用于 MQL5,我的套件文件也仅在我的博客上提供。 请小心诈骗者 ,不要从其他人那里购买任何套件! 设置 启用趋势变化警报 - 真/假 - 趋势变化时在图表上显示警报 发送推送通知 - 真/假 - 启用手机推送警报通知 发送邮件通知 - 真/假 - 发送趋势变化的邮件通知到电子邮件
目前八折优惠! 对任何新手或专家交易者来说都是最好的解决方案! 这个仪表板软件适用于28种货币对。它基于我们的两个主要指标(高级货币强度28和高级货币冲动)。它对整个外汇市场提供了一个伟大的概述。它显示高级货币强度值,货币运动速度和28个外汇对在所有(9)时间段的信号。想象一下,当你可以使用图表上的单一指标观察整个市场,以确定趋势和或剥头皮的机会时,你的交易将得到改善 我们已经在这个指标中建立了一些功能,使你更容易识别强势和弱势货币,同时识别和确认潜在的交易。该指标以图形方式显示货币的强势或弱势是增加还是减少,以及它在所有时间段的表现。 增加的新功能是动态市场斐波那契水平,它适应当前的市场条件变化,这是一个已经在我们的高级货币强度28和高级货币冲动指标中使用的成熟的加分项。 在交易时,总是将弱势货币和强势货币配对,这个新指标将帮助你做到这一点。 用户手册:点击这里  https://www.mql5.com/en/blogs/post/708783 特点  显示每个时间段的ACS28和GAP-speed(冲动)的货币强度值。 列:颜色代码以7种颜色显示货币强度:强势
Scalper Inside PRO
Alexey Minkov
4.74 (69)
An exclusive indicator that utilizes an innovative algorithm to swiftly and accurately determine the market trend. The indicator automatically calculates opening, closing, and profit levels, providing detailed trading statistics. With these features, you can choose the most appropriate trading instrument for the current market conditions. Additionally, you can easily integrate your own arrow indicators into Scalper Inside Pro to quickly evaluate their statistics and profitability. Scalper Inside
Trend indicator AI
Ramil Minniakhmetov
5 (74)
趋势人工智能指标是一个伟大的工具,将加强交易者的市场分析结合趋势识别与可操作的进入点和逆转警报。 该指标使用户能够自信和精确地驾驭外汇市场的复杂性 除了主要信号,趋势Ai指标识别在回调或回调期间出现的次要入口点,使交易者能够利用既定趋势内的价格修正。 重要优势: *MT4及MT5工程 *明确买入或卖出信号 ·不重绘 *适用于所有资产 小心我不卖EA或设置电报它骗局. 所有设置免费在这里的博客。  重要! 购买后立即与我联系,以获得指示和奖金! 真实的操作监控以及我的其他产品可以在这里找到: https://www.mql5.com/en/users/mechanic/seller&nbsp ; 设置和输入: 建议为所有资源设置默认设置。 第...
Currency Strength Exotics
Bernhard Schweigert
4.88 (33)
目前8折优惠! 对任何新手或专家交易者来说都是最好的解决方案! 这个指标是专门用来显示任何符号的货币强度,如异国货币对、商品、指数或期货。它是同类产品中的第一个,任何符号都可以添加到第9行,以显示黄金、白银、石油、DAX、US30、MXN、TRY、CNH等的真实货币强度。这是一个独特的、高质量的、负担得起的交易工具,因为我们已经纳入了一些专有的功能和一个新的公式。想象一下,你的交易将如何改善,因为你能够准确地确定新趋势或剥头皮机会的触发点? 用户手册:点击这里   https://www.mql5.com/en/blogs/post/708876 它适用于所有时间框架。你将很快能够看到TREND! 根据新的基础算法设计,它使识别和确认潜在交易变得更加容易。这是因为它以图形方式显示了8种主要货币和一种符号的强弱。 该指标显示了8种主要货币(澳元加元瑞士法郎欧元英镑日元新西兰美元)的强弱线,再加上一个符号! 该指标显示了符号的真实价值。例如:对于XAUUSD(黄金):价格以美元报价。如果黄金在上涨,你怎么能知道是黄金的强势还是美元的弱势?只有当黄金走强时,我们才会进行交易。该指
购买此指标即可免费获得我的专业交易管理器。 首先,值得强调的是,这个交易系统是一个非重绘、非重画和非滞后的指标,这使得它非常适合手动和机器人交易。 在线课程,手册和下载预设。 “智能趋势交易系统 MT5”是专为新手和经验丰富的交易者量身定制的综合交易解决方案。它结合了超过 10 个优质指标,具有 7 多个强大的交易策略,使其成为适用于各种市场条件的多功能选择。 趋势跟随策略:提供精确的入场和止损管理,以有效地跟随趋势。 反转策略:识别潜在的趋势反转,使交易者能够利用区域市场的机会。 剃头策略:专为快速准确的日内交易和短期交易而设计。 稳定性:所有指标都不会重绘、不会重画和不会滞后,确保可靠的信号。 定制:支持自定义策略,以满足个人交易偏好。超过 7 种策略和组合可帮助您找到最佳策略。 信号清晰度:提供箭头信号,以指示清晰的入场和退出点。 实时警报:通过交易进出警报使交易者保持了解。 深入分析:提供更高时间框架的趋势分析和实时交易监控。 自适应颜色编码:利用蜡烛颜色编码来显示成交量、趋势和反转蜡烛信号。通过蜡烛颜色分析市场方向。 “智能趋势交易系统 MT5”赋予交易者必要的工具,以便在
Advanced Supply Demand
Bernhard Schweigert
4.91 (296)
现在优惠 33%! 任何新手或专业交易者的最佳解决方案! 该指标是一款独特、高质量、且价格合理的交易工具,因为我们已经整合了许多专有功能和新公式。 依据此更新,您将能够显示双重时间帧区域。 您不仅可以显示一个较高的时间帧,还可以同时显示图表时间帧,加上更高的时间帧:显示嵌套时区。 供需双方所有交易者都会喜欢它。 :) 重要信息披露 高级供需的最大潜力,请访问 https://www.mql5.com/zh/blogs/post/720245   想象您的交易如何得以改善,是因为您能够精准定位入场或目标位吗? 构建于新的底层算法,它可以更轻松地识别出买卖双方之间的潜在失衡。 这是因为它以图形方式展示供需最强劲区域,及其过去的表现(显示旧区域)。 这些功能旨在帮助您更轻松地发现最佳入场区域和价位。 现在您可以针对您的交易品种和时间帧来优化和编辑区域强度! 高级供需指标适用于所有产品和时间帧。 它是一个新的公式,非常新的功能是两个区域强度函数可由用户输入进行调整! 这在交易中是一大优势。 当您学习如何使用专有功能,例如带有价格游离最小 X 因子的区域强度时,您能够判断该区域强劲与否。 供需
Meravith
Ivan Stefanov
5 (1)
该指标从每个点分析成交量,并计算该成交量的市场疲劳水平。 它由三条线组成: 牛市成交量疲劳线 熊市成交量疲劳线 表示市场趋势的线。该线根据市场是熊市还是牛市变化颜色。 您可以从任何选择的起点分析市场。一旦达到成交量疲劳线,确定一个新的起点来开始下一次分析。 您可以分析任何内容——趋势和修正。一个好的方法是每次当它达到趋势线或形成顶部或底部时移动指标。 趋势线与某一成交量疲劳线之间的距离越大,说明该方向的成交量越大。 趋势线可以作为开单的位置,而疲劳线则用于收集利润。 该系统非常独特,但又极其直观。 市场上没有类似的产品。 使用没有限制。可以在所有市场和所有时间框架中应用。 重要提示:在MetaTrader4测试器中检查时,双击紫色线条,然后左右移动它以分析市场。 如有任何问题,请随时联系我。
M1 Arrow
Oleg Rodin
5 (19)
M1 Arrow - 基于市场的两个基本原则的盘中策略。 该算法基于使用附加过滤器对交易量和价格波动的分析。该指标的智能算法仅在两个市场因素合二为一时才会发出信号。该指标使用较高时间框架的数据计算 M1 图表上某个范围的波浪。为了确认波浪,该指标使用了成交量分析。 从理论上讲,该指标可以与其他时间框架一起使用,但您需要考虑到该指标最初是为在 M1 上交易而开发的这一事实。 该指标是一个现成的交易系统。交易者所需要的只是跟随信号。此外,该指标可以成为您自己的交易系统的基础。交易仅在分钟图表上进行。 尽管指标使用 MTF 原理,但指标算法尽可能稳定。 购买后,一定要写信给我!我将与您分享我的交易设置和建议!祝您交易成功!感谢您的关注!
PRO Renko System
Oleg Rodin
5 (29)
PRO Renko Arrow Based System for trading renko charts.  准确的信号交易任何外汇工具. 另外,我将免费提供系统的附加模块! PRO Renko系统是RENKO图表上高度准确的交易系统。该系统是通用的。 该交易系统可应用于各种交易工具。 该系统有效地中和了所谓的市场噪音,打开了获得准确反转信号的通道。 该指标易于使用,只有一个参数负责产生信号。 您可以很容易地使算法适应您感兴趣的交易工具和renko酒吧的大小。 我很乐意通过提供任何咨询支持来帮助所有客户有效地使用该指标。 祝您交易成功!购买后,立即写信给我! 我将与您分享我的建议和我的renko发电机。 另外,我将免费提供系统的附加模块!
FX Power MT4 NG
Daniel Stein
4.95 (20)
FX Power:分析货币强度,助您做出更明智的交易决策 概述 FX Power 是一款专业工具,帮助您全面了解主要货币和黄金在任何市场条件下的真实强度。通过识别强势货币用于买入,弱势货币用于卖出, FX Power 简化了交易决策,并帮助您发现高概率的交易机会。不论您是想跟随趋势还是通过极端的 Delta 值预测反转,这款工具都能完美适应您的交易风格。别再盲目交易——用 FX Power 让您的交易更加智慧。 1. 为什么 FX Power 对交易者极具价值 实时货币和黄金强度分析 • FX Power 实时计算并显示主要货币和黄金的相对强度,助您全面了解市场动态。 • 监控领先或落后资产,轻松识别值得交易的货币对。 全面的多时间框架视图 • 跟踪短期、中期和长期时间框架的货币和黄金强度,以便将您的交易策略与市场趋势保持一致。 • 无论是快进快出的短线交易还是更长期的投资策略, FX Power 都能为您提供所需的信息。 Delta 动态分析用于趋势和反转 • 极端 Delta 值常常预示反转机会,而平缓的 Delta 变化则确认趋势延续。 • 使用 Delta 分析,轻
SMC Easy Signal
Mohamed Hassan
4.73 (15)
3 copies left at $65, next price is $120 SMC Easy Signal was built to remove the confusion around the smart money concept by turning structural shifts like BOS (Break of Structure) and CHoCH (Change of Character) into simple buy and sell trading signals. It simplifies market structure trading by automatically identifying breakouts and reversals as they happen, allowing traders to focus on execution rather than analysis. Whether the market is continuing its trend or preparing to reverse, the i
本指标是实践实战交易完善的波浪自动分析的指标 !  案例... 注: 波浪分级用西方叫法不习惯,因受到缠论(缠中说禅)命名方式习惯的影响,我是将基础波浪命名为 笔 ,将二级波段命名为 段 ,同时具有趋势方向的段命名为 主趋段 (以后笔记中都是这种命名方式,先告知大家),但是算法上和缠论关系不大切勿混淆.反映的是本人分析盘面总结的 千变万化纷繁复杂的运行规律 . 对波段进行了标准化定义,不再是不同人不同的浪  ,   对人为干扰的画法进行了排除,在严格分析进场起到了关键的作用 . 使用这个指标,等于将交易界面提升美感,抛弃最原始的K线交易带你进入新的交易层次.如果不是为了交易,在宣传上也将使客户观感提升层次. 指标内容: 1. 基础波浪 (笔) : 首先我们找出了价格波动过程中的基础波动拐点,当然他的有序性低,为下一步的计算提供基础. 2. 二级波段( 段 ) :在基础波浪的基础上,通过算法分析得到层级更明显的二级波段,二级波段为波浪提供了分析基础 3. 波浪( 浪 ): 有着更清晰的趋势,更清晰直观的方向.分析一个波浪是否延续,需要看二级波段的形态,分析二级的构成,可以得出波浪后
ACB Breakout Arrows
KEENBASE SOFTWARE SOLUTIONS
4.15 (34)
ACB Breakout Arrows 指标通过识别一种特殊的突破形态,为交易者提供关键的入场信号。该指标持续扫描图表中某一方向上趋于稳定的动能,并在主要行情启动之前给出准确的进场信号。  点击此处获取多品种、多周期扫描仪 - ACB Breakout Arrows MT4 专用扫描仪 主要功能 指标自动提供止损和止盈位置。 配备 MTF 多周期扫描仪面板,可跟踪所有时间周期的突破信号。 适用于日内交易者、波段交易者和剥头皮交易者。 采用优化算法,提高信号准确性。 提供特殊目标线,用于设置快速平仓点或无损平移位(Quick Profit Line)。 包括胜率、成功率、平均收益等表现分析指标。 不重绘,信号一旦出现即保持不变。 交易确认 -  建议结合使用 ACB Trade Filter 指标 以过滤低质量信号。 强买入: 上箭头 + 绿色柱状图 + 多头趋势。 强卖出: 下箭头 + 红色柱状图 + 空头趋势。 避免交易 :当柱状图为灰色且趋势为震荡时。 (可选) -  建议使用 KT  支撑与阻力位指标  来避免在关键支撑/阻力区域附近开仓。此类交易可能迅速转为亏损,造成不必
Advanced Currency Strength28 Indicator
Bernhard Schweigert
4.91 (657)
目前26%的折扣 任何新手或专家交易者的最佳解决方案! 这个指标是一个独特的、高质量的、可负担得起的交易工具,因为我们纳入了一些专有的功能和一个新的公式。只需一个图表,你就可以读出28个外汇对的货币强度!想象一下,你的交易将如何得到改善,因为你的交易是在你的手中进行的。想象一下,你的交易将如何改善,因为你能够准确地确定新趋势或剥头皮机会的触发点? 用户手册:点击这里  https://www.mql5.com/en/blogs/post/697384 这是第一本,原版的! 不要买一个毫无价值的崇拜者的克隆品。 特别的 子窗口中的箭头显示强劲的货币势头GAP将指导你的交易! 当基础货币或报价货币处于超卖/超买区域(外盘斐波那契水平)时,在个人图表的主窗口中出现警告信号。 当货币力量从外围区间回落时,回撤/反转警报。 十字星模式的特别警报 可选择多个时间框架,以快速查看趋势! 货币强度线在所有的时间框架中都非常平稳,当使用较高的时间框架来识别总体趋势,然后使用较短的时间框架来确定精确的入口时,效果非常好。你可以根据自己的意愿选择任何时间框架。每个时间框架都由其自身进行了优化。
Looking for a powerful yet lightweight swing detector that accurately identifies market structure turning points? Want clear, reliable buy and sell signals that work across any timeframe and any instrument? Buy Sell Arrow MT Swing is built exactly for that — precision swing detection made simple and effective. This indicator identifies Higher Highs (HH) , Higher Lows (HL) , Lower Highs (LH) , and Lower Lows (LL) with remarkable clarity. It is designed to help traders easily visualize market str
Dynamic Forex28 Navigator
Bernhard Schweigert
4.43 (7)
Dynamic Forex28 Navigator - 下一代外汇交易工具。 当前 49% 折扣。 Dynamic Forex28 Navigator 是我们长期流行的指标的演变,将三种功能合二为一: 高级货币强度 28 指标 (695 条评论)+ 高级货币 IMPULSE 带警报 (520 条评论)+ CS28 组合信号(奖励)。 有关指标的详细信息 https://www.mql5.com/en/blogs/post/758844 下一代强度指标提供什么? 您喜欢的原始指标的一切,现在通过新功能和更高的精度进行了增强。 主要特点: 专有货币强度公式。  所有时间范围内的平滑和准确的强度线。 非常适合识别趋势和精确进入。 动态市场斐波那契水平(市场斐波那契)。  此指标独有的独特功能。 斐波那契应用于货币强度,而不是价格图表。 适应实时市场活动以获得准确的反转区域。 实时市场动量。  第 9 行显示市场是活跃还是被动。 对于定时交易至关重要。 全面的警报和显示。  每种货币最强的买入和卖出动量。 ​​28 对的双重动量买入和卖出。 超买/超卖警告外部范围和止损。 反转
Trend Screener
STE S.S.COMPANY
4.79 (95)
趋势指标,趋势交易和过滤的突破性独特解决方案,所有重要趋势功能都内置在一个工具中! 它是 100% 非重绘多时间框架和多货币指标,可用于所有符号/工具:外汇、商品、加密货币、指数、股票。 限时优惠:支撑和阻力筛选指标仅售 50美元,终身有效。(原价 250 美元)(优惠延长) 趋势筛选器是有效的指标趋势跟踪指标,它在图表中提供带有点的箭头趋势信号。 趋势分析器指标中可用的功能: 1.趋势扫描仪。 2. 具有最大利润分析的趋势线。 3.趋势货币强度计。 4. 带有警报的趋势反转点。 5. 带有警报的强趋势点。 6. 趋势箭头 每日分析示例,每日信号表现...等与我们的趋势筛选指标,可以在这里找到: 点击这里 限时优惠:Trend Screener Indicator 仅售 50 美元且终身可用。原价 125$) 通过访问我们的 MQL5 博客,您可以找到我们所有的高级指标以及分析示例、每日信号表现...等。 : 点击这里 我们的趋势系统由 2 个指标组成: 1. Trend Screener Indicator:显示趋势仪表盘、图表中的趋势线、入场点...等。 2. Trend
Smc Blast Signal
Mohit Dhariwal
5 (1)
SMC Blast Signal with FVG, BOS and trend Breakout The SMC Blast Signal  is a  Precise trading system for Meta Trader 4 that uses Smart Money Concepts (SMC) , including Fair Value Gaps (FVG) and Break of Structure (BOS) , to identify high-probability trades. It incorporates a Trend Filter using a higher timeframe moving average, ensuring trades align with the prevailing market trend. TREND SIGNAL-FVG DETECTION-BOS DETECTION-TRADE CONFIRMED-Precise Signal entries on m15  Best TF-M15 AND ABOVE Be
Day Trader Master
Oleg Rodin
5 (15)
Day Trader Master 是一个完整的日间交易者交易系统。该系统由两个指标组成。一个指标是买入和卖出的箭头信号。这是你得到的箭头指示器。我将免费为您提供第二个指标。第二个指标是专门设计用于与这些箭头结合使用的趋势指标。 指标不重复也不迟到! 使用这个系统非常简单。您只需按照当前趋势方向的箭头信号,显示为双色线。蓝色是买入趋势。红色是一种销售趋势。蓝色箭头是买入信号。红色箭头是卖出信号。您需要箭头的颜色和信号的方向来匹配趋势线的颜色。 箭头指标主要是为 M5 和 M15 时间间隔的日内交易而创建的。但从技术上讲,该系统可以用于其他时间间隔。 指示器配备带有推送消息功能的弹出警报。 购买后一定要写信给我!我将为您提供与系统交易的个人建议,以及我的趋势指标。此外,还有丰厚的奖励等着您!
Market Structure Break Out
Ashkan Hazegh Nikrou
5 (8)
Market Structure Break Out(MSB) 是一款为 MT4 和 MT5 平台 设计的高级工具,帮助交易者以结构的角度观察市场走势。它通过箭头和警报提示,标示出趋势方向和反转方向的关键 交易信号 。 其一大亮点功能是能够绘制 持续的供需区域 ,让交易者清晰了解关键价格区域。此外, 实时回测功能 使用户能够在图表上直接查看该指标在历史中的表现,增强了信号的透明度与可信度。 领取您的免费EA: 获取免费的 Market Structure Breakout EA ,它可以根据突破箭头自动开仓,使用固定手数,并可自定义止损和止盈水平。 如何领取: 点击此处下载 EA 。请注意,此 EA 仅在您已购买 Market Structure Break Out 指标 后才能使用。 MT5 版本的产品在此: https ://www .mql5 .com /en /market /product /124690 该指标正在持续更新。 我们努力提供基于市场结构的高精度进场和出场点。当前版本为1.6,以下是最新的更新内容,欢迎加入我们: 买卖目标: 清晰了解买入和卖出仓位的最佳止
IQ Gold Gann Levels
INTRAQUOTES
5 (4)
Presenting one-of-a-kind Gann Indicator for XAUUSD IQ Gold Gann Levels is a non-repainting, precision tool designed exclusively for XAUUSD/Gold intraday trading. It uses W.D. Gann’s square root method to plot real-time support and resistance levels, helping traders spot high-probability entries with confidence and clarity. William Delbert Gann (W.D. Gann) was an exceptional market analyst whose trading technique was based on a complex blend of mathematics, geometry, astrology, and ancient calcul
Entry Points Pro
Yury Orlov
4.62 (172)
这是一款 MT4 的趋势指标,可提供准确的入场交易信号,且无重绘或延迟。 它可应用在任何金融资产:外汇、加密货币、贵金属、股票、指数。 最好的结果出现在 M15+ 的时间帧内。 指标的 MT5 版本 重要! 购买后请联系我,以便获取详细指南和奖励。 视频 (6:22) - 一个信号赢取的利润等于指标价格的三倍。 视频 (4:44) - 它如何在测试器中工作,我的提示和技巧。 视频 (1:44) - 有关它如何处理加密货币和指数的几句话。 大多数交易者在 Entry Points Pro 指标的帮助下,在第一个交易周内就改善了他们的交易结果。 Entry Points Pro 指标的益处 入场信号无重绘或延迟 如果信号出现,并得到确认(如果信号所在烛条已收盘),则它不会再消失;不像是重绘指标,它会导致重大的财产损失,因为它们可以在显示信号后再将其删除。 无差错开仓 指标算法可令您找到入场交易(买入或卖出资产)的理想时机,从而提高每位交易者的成功率。 Entry Points Pro 可操作任何资产 它允许您在 MT4 平台上交易任何经纪商提供的加密货币、股票、金属、指数、商品
Hidden Cycles
Lev Vladimirovic Marushkin
5 (1)
Black Friday Sale – Limited Time! Grab Hidden Cycles for only $129 (regular price $179 ). This is your chance to boost your strategy with a powerful, easy-to-use cycle-based trading tool. Offer ends soon — don’t miss it! Based on Universal Laws — NOT Some Guy’s Algorithm: Let the market adjust to the Hidden Cycles Geometry — not the other way around. Most indicators are based on a man-made formula. They often lag, fail over time, or need constant re-optimization.  Hidden Cycles is different.
Adaptive Volatility Range
Stanislav Konin
5 (3)
Adaptive Volatility Range [AVR] is a powerful tool for identifying key trend reversal points. AVR accurately reflects the Average True Range (ATR) of volatility, taking into account the Volume-Weighted Average Price (VWAP). The indicator adapts to any market volatility by calculating the average volatility over a specific period, ensuring a stable rate of profitable trades. You receive not just an indicator but a professional automated trading system , AVR-EA . Advantages: Automated Trading Sys
Basic Harmonic Patterns Dashboard
Mehran Sepah Mansoor
5 (3)
该仪表盘显示所选符号的最新可用谐波形态,因此您可以节省时间并提高效率 /  MT5 版本 。 免费指标:  Basic Harmonic Pattern 指标列 Symbol: 显示所选符号 Trend:   看涨或看跌 Pattern:  形态类型(Gartley、蝴蝶、蝙蝠、螃蟹、鲨鱼、Cypher 或 ABCD) Entry:   入口价格 SL: 止损价 TP1: 第一止盈价 TP2: 第二次获利价格 TP3: 第三次获利价格 Current price:  当前价格 Age (in bars): 最后绘制的模式的年龄 主要输入 Symbols : 从 "28 种主要货币对 "或 "选定符号 "中选择。 Selected Symbols : 希望监控的符号,用逗号分隔("EURUSD,GBPUSD,XAUUSD")。如果您的经纪商为货币对设置了后缀或前缀,您必须在以下两个参数中添加(货币对前缀或货币对后缀)。 Max Iteration: 调整模式的最大迭代次数(如果该值越小,则模式越少,性能越快;如果该值越大,则模式越多,性能越慢)。事实上,它的工作原理如下:如果该值
Auto Optimized RSI
Davit Beridze
5 (2)
Auto Optimized RSI 是一款智能且易于使用的箭头指标,旨在实现精准交易。它利用基于历史数据的模拟,自动识别当前品种和时间周期中最有效的 RSI 买入和卖出水平。 该指标既可以作为独立的交易系统使用,也可以结合您的其他交易策略一起使用。尤其适合日内交易者使用。 与传统 RSI 指标使用固定的 70/30 水平不同, Auto Optimized RSI 会根据真实的价格行为和回测结果动态调整水平。它会跟踪胜率、回撤和平均盈亏等关键指标,从而适应市场当前的走势,并基于“实际有效”的逻辑发出信号。 当 RSI 穿越经过优化的关键区域时,指标会在图表上显示 Buy 和 Sell 箭头,帮助交易者找到成功率更高的进场机会。 购买后请务必联系我,以获取额外赠送的工具和专属交易建议! 祝您交易顺利,稳步盈利!
Currency Strength Wizard
Oleg Rodin
4.84 (55)
货币强度向导是一个非常强大的指标,为您提供成功交易的一体化解决方案。该指标使用多个时间范围内所有货币的数据来计算这个或那个外汇对的力量。此数据以易于使用的货币指数和货币电力线的形式表示,您可以使用它们来查看这种或那种货币的力量。 您所需要的只是将指标附加到您要交易的图表上,该指标将向您显示您交易的货币的真实强度。该指标还向您显示买卖量压力的极值,您可以在顺势交易时利用这些压力。该指标还显示了基于斐波那契的可能目标。该指标可用于各种交易时间范围。该指标支持各种货币对的交易。 该指标为您提供所有类型的警报,包括推送通知。 购买后请联系我。我将与您分享我的交易技巧,并免费为您提供丰厚的红利指标! 祝您交易愉快,获利丰厚!
作者的更多信息
Quadro Trend
Valeriy Skachko
The Quadro Trend indicator works stably, correctly, and gives great flexibility when analyzing prices. There are many similar indicators, but Quadro Trend , unlike most of them , gives pretty good signals. A great tool for working inside the day. On charts with a period of less than a day will help you see the daily candle in its usual form. U-turn occurs when an arrow of the corresponding color appears. There is a parameter in the indicator to enable the supply of alerts when the color chang
Star of David
Valeriy Skachko
A trend indicator, the main direction of which is to display the possible direction of price movement. The price reversal occurs with the same patterns on the indicators. The indicator shows the possible direction of price movement. Signals are generated on the previous bar. Red Coogie - the signal is considered unconfirmed. The indicator works best on timeframes H1, H4 and D1. This is one of the few indicators that can signal strength and direction, which makes it a very valuable tool for tra
筛选:
无评论
回复评论