Ratio TP SL MT5

5

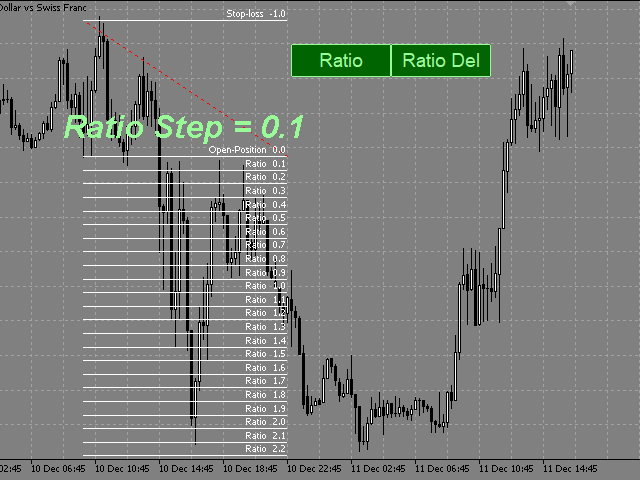
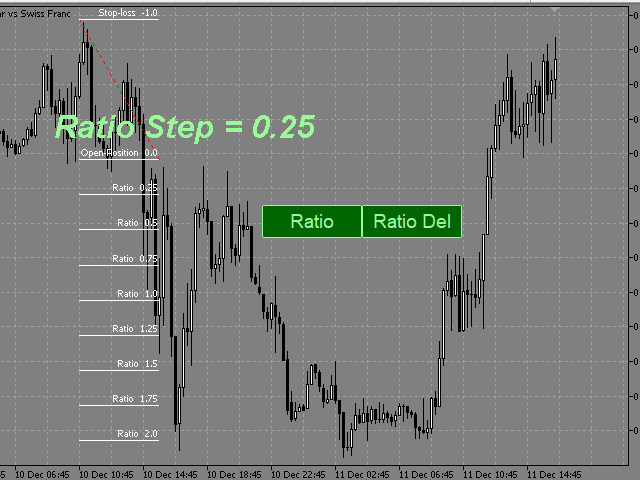
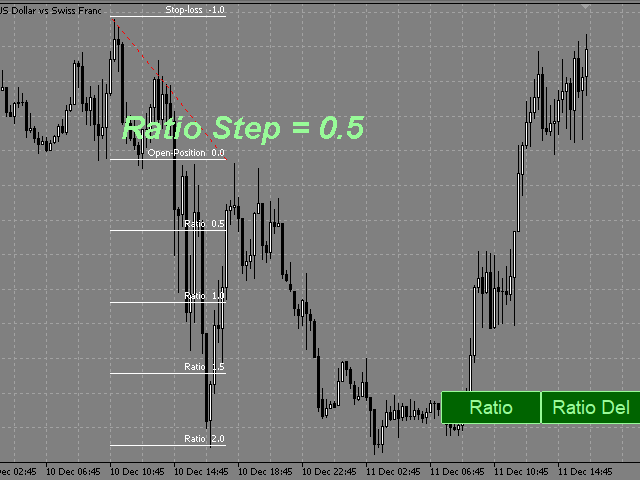
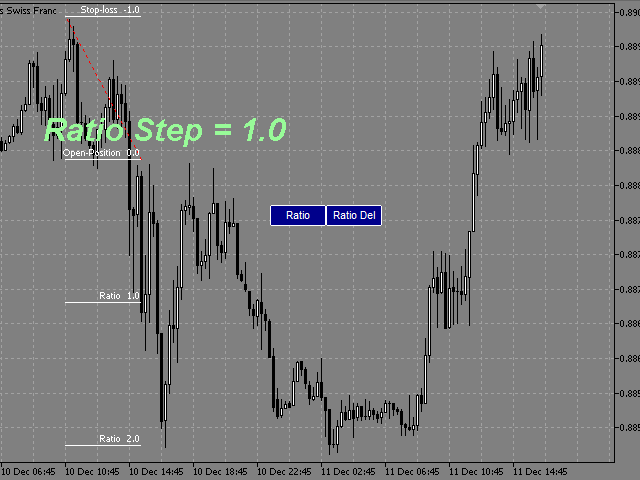
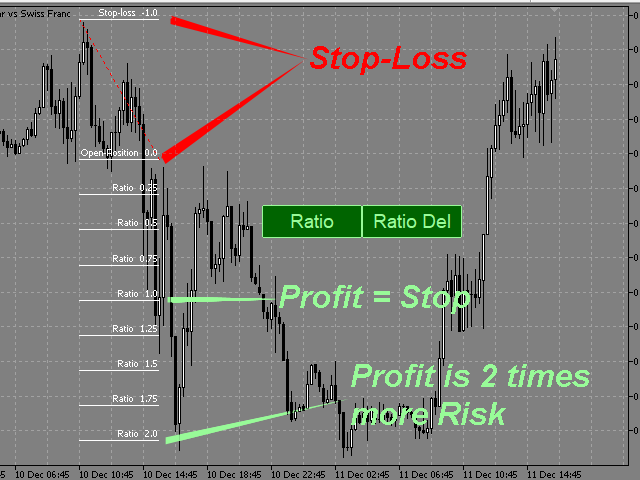
This indicator allows you to measure the profitability of each specific transaction (the ratio of Stop and Profit).

The indicator allows you to adjust the ratio by step size and number of steps.

You can build an unlimited number of ratios to compare the risks from different movements.


Note: the MT5 tester is not designed for full-fledged work with graphic objects, so drawing in the tester is slower than in the real situation.

The ratio selection is performed with 1 mouse click.


Building a line
: click the "Ratio" button and draw a line (mouse click - the first point of the line, where the mouse is released - the second point of the line).  

Changing the Ratio: select a line and drag it with the mouse.

Delete all ratios: click "Ratio_Del". During the number of seconds selected in the "Ratio_Del_Cancel" setting, the "Ratio_Del" button can be clicked to cancel, and the "Ratio_Del" command will be canceled.

The size of the buttons depends on the font in the Button_Font setting and its size in the Button_FontSize setting.
On-screen buttons can be dragged with the mouse.
You can assign keyboard shortcuts to on-screen buttons (a-Z, 0-9). 


    Настройки

    • Ratio_Step - ratio step.
    • Ratio_Maximum - the maximum value of the ratios.
    • Ratio_key -hotkey for drawing the ratio (you can assign (a-Z, 0-9)).
    • Ratio_Del_key - hotkey for deleting all ratios (you can assign (a-Z, 0-9))
    • (ratios are deleted after the pause selected in the Ratio_Del_Cancel setting).
    • Ratio_Del_Cancel - time to cancel the Ratio_Del_key command (in seconds).
    • Button_Color color of text and button borders.
    • Button_Background_Color - buttons background color (if Button_Background_Color=clrNONE, the buttons background is the same as the graph background color).
    • Button_Pressed_Color - color of the text and border of the buttons when pressed.
    • Button FontSize - button font size.
    • Button_Font - the font of the buttons.
    • Line_Color - color of the ratio control line.
    • Line_Style - style of the ratio control line. 
    • Line_Width - the thickness of the ratio control line. 
    • Ratio_Lines_Color - the color of the lines ratio.
    • Ratio_Lines_Style - the style lines of the ratio.
    • Ratio_Lines_Width - the thickness of the lines ratio.
      评分 1
      krisnara123
      2210
      krisnara123 2020.12.17 14:35 
       

      This is a wonderful product for measuring Risk Reward..a welcome addition to Chartist's Toolkit.It supports many configuration options too.

      推荐产品
      PZ Trade Pad MT5
      PZ TRADING SLU
      4.46 (24)
      This simple visual expert advisor allows you to trade easily from the chart. It handles risk management for you and can perform several useful tasks with your existing trades, saving time and making risk-management for each individual trade easier.  [ Installation Guide | Update Guide | Troubleshooting | FAQ | All Products  |  Get Help ] Trade easily from the chart Trade with precise risk management, hassle free Trade pending order with drag and drop price selection Set SL and TP levels with d
      FREE
      ATR Stop Loss Manager— Smarter Risk Awareness for Forex Traders Confident trading begins with clear risk management. The ATR Stop Loss Expert is a powerful utility tool that automatically adjusts your stop-loss levels using ATR (Average True Range) — a proven volatility measure — so your trades are protected by logic, not guesswork. What This Tool Does This EA monitors your open trades and sets a stop-loss based on recent market volatility, calculated from the ATR indicator. It doesn’t place t
      FREE
      Position Sizer PROP
      Lazaro Farias Do Espirito Santo
      Position Sizer PROP Stop putting your challenge at risk because of wrong lot sizing, forgotten limits, or unclear exposure before sending the next order. In PROP Firm challenges, many traders do not fail only because of poor entries. Risk management mistakes also matter: oversized lots, poorly calculated risk, daily drawdown breaches, excessive exposure, or lack of control over account rules. After approval, the challenge continues. Keeping the account active requires discipline, operational co
      Free automatic Fibonacci is an indicator that automatically plots a Fibonacci retracement based on the number of bars you select on the BarsToScan setting in the indicator. The Fibonacci is automatically updated in real time as new highest and lowest values appears amongst the selected bars. You can select which level values to be displayed in the indicator settings. You can also select the color of the levels thus enabling the trader to be able to attach the indicator several times with differe
      FREE
      LT Round Numbers MT5
      Thiago Duarte
      4.86 (21)
      Round numbers (or key levels) is an amazing strategy. These numbers are strong support and resistance levels. So what this indicator does is draw horizontal lines on the chart to help you find these levels. Configurations: Key levels in pips - distance between the lines. Color -   lines color. Style -   lines style. Width -  lines width. Display at background -  draw lines in front or back of candles. Selectable -  turn on or off the option to select the lines. Lines identification -  identifica
      FREE
      Risk Manager – Account Protection Tool Risk Manager is an Expert Advisor for MetaTrader 5 designed to protect your trading account by applying automatic risk management rules. This tool does not open trades . It continuously monitors your account and enforces predefined limits to help prevent excessive losses and maintain disciplined trading. Risk Manager works in the background and can manage positions opened by manual trading or other Expert Advisors. It is particularly useful for: • Manual tr
      FREE
      Pro Spread Monitor Pro Spread Monitor is a specialized, professional-grade utility designed to provide real-time, low-latency monitoring of market spreads directly on your trading chart. In high-volatility environments, sudden spread spikes can significantly impact your execution quality and the integrity of your stop-loss levels. This indicator provides immediate visual feedback, allowing you to identify "danger zones" instantly and avoid trading during periods of unfavorable liquidity. Key Fea
      FREE
      This is a common, simple and easy to use but effective tool to manage trading risks for all traders. It also help trader places stop loss and take profit levels at the same time the order is filled. How to set the expert advisor's parameters to support your trading style? Lots size. Fixed lots size - For traders who prefered to trade with fixed lots size, they can input the lots size in 'User lots' menu in the expert advisor's properties. The input value should be from the 'Minimum Volume' to th
      TradePulseMonitor for MetaTrader 4 & 5 Overview: TradePulseMonitor is a comprehensive, real-time dashboard indicator designed for MetaTrader 4 and MetaTrader 5. It provides traders with an at-a-glance overview of their account's financial health, risk exposure, position metrics, and historical performance. By consolidating critical data into a single, customizable on-chart dashboard, it eliminates the need to constantly check the Terminal window, allowing for faster and more informed trading de
      FREE
      ================================================================ MATRIX CONDITION MONITOR Live Trade Condition Panel for MetaTrader 5 Fully Automatic -- Works with ALL Matrix EAs ================================================================ NEVER MISS A TRADE SETUP AGAIN Matrix Condition Monitor is a free utility that attaches to any chart and automatically checks all 10 trade conditions in real time -- showing you exactly why a trade will or will not open, and alerting you the moment ever
      FREE
      Free one click Stop Loss and Take Profit tool for manual trading on MetaTrader 5. Apply a fixed SL and TP to every open position on the current symbol at once, or move them all to break even, with a single button. It only modifies Stop Loss and Take Profit levels - it never opens or closes a trade. Works on any symbol and any account type: forex, gold and XAUUSD, indices, crypto. Useful on a prop firm or funded account, where an unprotected position is the fastest way to fail a challenge. TWO
      FREE
      Introducing a powerful MetaTrader 5 Expert Advisor designed to enhance your trading strategy – the Auto Breakeven EA! This feature-rich EA is tailored to bring your stop-loss to breakeven, ensuring a risk-free trade once the market moves in your favor up to a specified price. Explore the full potential of the Auto Breakeven EA. Download it for free now, and find the download link at the bottom of our page. Elevate your trading experience and take control of your risk management strategy. Happy
      FREE
      ChartChaos
      Dustin Ricardo Pierenz
      A MetaTrader 5 script that automatically closes all charts except for a specified number to keep open. Simply enter numbers like   1,2,5,10   to keep those corresponding charts open, or a single number (e.g.,   3 ) to keep the first 3 charts open. All other charts are closed in one action, helping you manage multiple open positions with ease. Perfect for decluttering your workspace and focusing on the charts that matter most. Source Code here:  https://github.com/pwn-forex/ChartChaos Youtube T
      FREE
      介绍适用于 MT5 的 NAS100 Auto SL 和 TP Maker: 有了我们的 NAS100 Auto SL 和 TP Maker,再也不会错过止损和止盈的设置,这是交易者在 MetaTrader 5 上浏览纳斯达克 100 市场时不可或缺的助手。该工具专为寻求自动管理止损和止盈水平的无缝解决方案的用户而设计。 主要功能 轻松实现自动化: 自动监控无止损和/或止盈的纳斯达克 100 指数交易。 根据用户配置设置动态调整水平。 订单类型的多样性: 兼容纳斯达克 100 指数的市价订单和挂单。 支持 MetaTrader 5 中的各种订单类型。 定制配置: 用户友好的参数设置允许自定义跟踪偏好和止损/止盈水平。 范围灵活: 可选择为其运行的特定 NAS100 工具或所有交易工具设置止损和止盈。 快速执行: 确保快速设置所需的 StopLoss 和/或 TakeProfit 值,无需等待新的 tick 即可迅速响应。 MetaTrader 5 兼容性: 与 MetaTrader 5 中的所有订单类型兼容,实现无缝集成。 使用 NAS100 Auto SL 和 TP Maker
      FREE
      FiT Panel Pro
      Thonglak Janyakorn
      Overview FiT Panel Pro is a professional-grade trade management panel designed for MetaTrader 5 traders who demand speed, precision, and full control over their trades. Built with a modern dark-theme UI, it combines one-click execution with advanced risk management, visual SL/TP drag lines, automatic Fibonacci-based levels, and comprehensive order management — all in a single, compact panel. Whether you are a scalper, day trader, or swing trader, FiT Panel Pro gives you the edge you need to exec
      FREE
      High Low Open Close
      Alexandre Borela
      4.98 (44)
      如果你象这个项目一样,就有5个饥饿审查。 这项指标采用了既定价格的公开、高、低价和关闭价格 可以对特定时间区加以调整。 许多机构和专业人士都认为这些是重要的。 贸易商可以为你了解他们可能更进一步的地点, 积极。 现有期间为: 前一日。 前一星期。 曾任Month。 曾任。 前一年。 或: 目前日。 目前周。 目前 Month。 目前配额。 今年。
      FREE
      This Expert Advisor provides an advanced on-chart trading panel designed for discretionary traders. It simplifies position sizing, risk management, and trade execution directly from the chart without manual calculations. Key Features  On-chart trading panel  Fixed lot and balance percentage risk mode  Risk-based lot calculation using stop loss  Market and pending order execution  Partial close management  Break-even automation  Trailing stop control  Equity protection system  Daily loss lock  S
      FREE
      Haunted Risk Calculator is a visual risk management panel for MT5 that calculates the correct lot size in real time based on your account balance, risk percentage, and stop-loss distance. HOW IT WORKS Set your risk percentage or dollar amount, drag the SL and TP lines to your desired levels on the chart, and the panel instantly shows the calculated lot size, risk in dollars, reward-to-risk ratio, and expected profit. Execute with one click or a keyboard shortcut. FEATURES Draggable panel — grab
      FREE
      核心功能 智能交易管理 一键开仓平仓操作,支持自定义手数设置. 多种平仓模式:全部平仓、按方向平仓、按盈亏状态平仓. 专业风险控制控制风险 实时监控点差,避免高成本交易环境.可视化控制面板。 直观的图形界面所有功能一键操作. 实时显示仓位信息、盈亏状况、点差状态. 支持面板最小化、锁定功能,防止误操作 . 产品优势 高效便捷无需复杂设置,开箱即用 图形化操作,告别繁琐代码.实时数据更新,决策更及时. ️安全可靠点差监控,避免恶劣市场条件交易. 专业实用支持多种订单类型管理,灵活的手数配置 详细的仓位信息展示. 适用场景 手动交易者:提供专业的方便控制工具 效率追求者:一键式操作,提升交易效率.       如果你用的方便的话,记得分享给你的朋友!
      FREE
      Lot by Risk MT5
      Sergey Vasilev
      4.88 (16)
      风险交易面板是为手动交易而设计的. 这是发送订单的另一种方式。 面板的第一个特点是使用控制线方便地下订单。 第二个特征是在存在止损线的情况下计算给定风险的交易量。 使用热键设置控制行: 获利-默认情况下T键; 价格-默认情况下p键; 止损-默认情况下,S键; 您可以在交易面板的设置中自行配置密钥。 运算算法: 1)-我们把水平在所需的地方(这是没有必要把所有的水平); 2)-指定风险(可选); 3)-点击绿色发送订单按钮; 4)-我们正在等待下订单,或者会出现带有错误消息的警报; 5)-如果我们想关闭当前符号的所有订单,通过魔术链接到专家顾问,然后点击关闭订单按钮。 您不应该多次按下发送订单按钮。 一次就够了。 下单后,按钮将呈现"未按下"状态。 要发送带有风险计算的订单,需要设置止损线并在交易面板的"风险"字段中设置风险。 否则,订单将以当前交易工具的最低手数放置。 风险是从账户余额计算出来的. 由于经纪商对保证金交易细节的限制,不可能承担100%的风险。 在"风险"字段中允许小数(例如,您可以以余额的0.5%的风险进行交易)。 如果指定的风险低于允许
      FREE
      Position Size Tool – Smart Risk Management & Trade Execution Panel The Position Size Tool is a powerful and intuitive MT5 panel that simplifies your trading by combining position sizing , risk calculation , risk/reward visualization , and order placement —all in one place. ️ Clean & Functional Interface The tool features a compact, real-time panel with the following: Balance & Equity display Live Price tracking Customizable Risk % input Auto-calculated Lot Size based on SL and Risk Input for S
      FREE
      As traders, we all know that risk management is the most important aspect of profitable trading. So, we need to determine the lot size, every time we need to open a new trade. The FX lot size calculator is a simple tool that will help you to determine your lot size easily without using any third-party service but you will be able to do that by your MetaTrader terminal. LIMITED TIME OFFER: 30$ FOR 10 ACTIVATION. Inputs: Maximum_Risk_Prc: To determine your preferred risk%. For example, if your ris
      FREE
      Introduction: The RosMaFin Trading Panel is not just a standard order execution tool. It is a comprehensive, professional assistant designed for manual and price-action traders who want to save time, manage risk with mathematical precision, and maintain full market awareness. Say goodbye to manual lot size calculations and tedious Stop Loss adjustments. This panel streamlines your entire trading workflow from analysis to trade exit. KEY FEATURES & BENEFITS: Advanced Risk Management & Exec
      FREE
      Fibo Shortcut
      Gustavo Biaobock
      U sing keyboard shortcuts to draw Fibonacci levels and rectangles quickly and efficiently. Press   F   to create a   Fibonacci   retracement. Click with mouse (2x):  -once on the chart to set the starting point and - again to set the ending point. The Fibonacci levels are drawn automatically using the configured ratios, colors, and styles. Press   T   to instantly draw a pre defined   rectangle  at   the closest highest or lowest price (based on trend). All levels, colors, sizes, and styles ca
      FREE
      Equity monitor This is a simple means change informer. I wrote it for myself, maybe someone will need it... 1. Displays the change in funds for the day. Every day, when the terminal is first launched, it remembers the current funds and monitors changes throughout the day. 2. The first day of the month, well remembers the money and, within months, to monitor changes. 3. Well, it displays the profit of the open position. To work, you need to create 4 global variables: gvarEqityDay , gvarEq
      FREE
      MultiTimeframe Info Feed (MIF) Indicator Description: MultiTimeframe Info Feed (MIF) is a smart MQL5 indicator that displays a dynamic, real-time info panel directly on your chart, offering powerful insight into current market conditions. Key features include: Real-time display of Open, High, Low, Close, and live Tick price Tick Rate (ticks per second) for assessing market activity Auto-calculated Entry Price on new candle formation Signal direction detection (BUY / SELL) Price action pattern re
      FREE
      Advanced Account Dashboard & Risk Monitor (MT5) This script provides a real-time on-chart dashboard for monitoring account performance, risk exposure, and execution conditions in MetaTrader 5. It is designed for traders who want clear visibility of account health and risk awareness during live trading or VPS operation. The script does not open trades and does not interfere with any strategy logic . Key Features Account Metrics Live equity, balance, and floating profit/loss Open position count an
      FREE
      ZumikoFx Trading Stats
      Michal Piotr Kochanski
      ZumikoFX Trading Stats - Professional Account Dashboard Overview ZumikoFX Trading Stats is a comprehensive, real-time account monitoring dashboard designed for serious traders who need complete visibility of their trading performance. This indicator displays all crucial trading statistics in an elegant, easy-to-read panel positioned in the top-right corner of your chart. Key Features Complete Account Monitoring Balance & Equity - Real-time account status with current balance and equity includ
      FREE
      Robot Manual Order Manager is a tool that allows you to automatically include Stop Loss, Breakeven, Take Profit and partials in open trades. Be it a market order or a limit order. Besides, it automatically conducts your trade, moving your stop or ending trades, according to the parameters you choose. To make your operations more effective, the Manual Orders Manager Robot has several indicators that can be configured to work on your trade. Among the options you can count on the features: Conducti
      Advanced PolyLines
      Felipe Monteiro Rodrigues
      如果您喜欢本产品,请不要忘记留下评论和评分! Advanced PolyLines 是一款专业的图形工具,简化了直接在图表上创建连接线的过程。您无需绘制多条独立的线,而是可以构建一个单一的连续结构,从而使技术分析更容易,并让您的图表更加整洁有序。 它是为了消除 MetaTrader 5 传统绘图工具 lines 的局限性 & 约束而开发的。借助它,您可以快速创建复杂的图形结构,保持图表井井有条,并极大地方便未来的编辑。无需单独调整多条线,整个结构保持连接,提供更高效的用户体验。 主要功能与优势 极简浮动界面 (UI): 直接集成到图表中的优雅工具抽屉。通过直观的触控按钮,您只需一键即可激活绘制模式 ()、折叠菜单 () 或清除所有创建的折线 ()。 智能磁力吸附 (Magnetic Snap): 无需再为了将线与烛台影线对齐而无限放大图表。该工具会自动检测鼠标的临近度,并以手术般的精准度将线“吸附”到烛台的 OHLC(开盘价、最高价、最低价、收盘价)点上。 高级节点移动 (Joint Dragging): 如果您需要调整结构的顶部或底部,只需拖动连接节点(顶点)即可。连接到
      FREE
      该产品的买家也购买
      Trade Assistant MT5
      Evgeniy Kravchenko
      4.41 (215)
      它有助于计算每笔交易的风险,容易安装新的订单,具有部分关闭功能的订单管理, 7 种类型的追踪止损和其他有用的功能。   附加材料和说明 安装说明   -   应用程序说明   -   模拟账户应用程序的试用版 线条功能  - 在图表上显示开仓线、止损线、止盈线。 有了这个功能,就可以很容易地设置一个新的订单,并在开仓前看到它的附加特性。   风险管理  - 风险计算功能在考虑到设定的风险和止损单的大小的情况下,计算新订单的成交量。它允许你设置任何大小的止损,同时观察设定的风险。 批量计算按钮 - 启用 / 禁用风险计算。 在 " 风险 " 一栏中设置必要的风险值,从 0 到 100 的百分比或存款的货币。 在 " 设置 " 选项卡上选择风险计算的变量: $ 货币, % 余额, % 资产, % 自由保证金, % 自定义, %AB 前一天, %AB 前一周, %AB 前一个月。   R/TP 和 R/SL - 设置止盈和止损的关系。 这允许你设置相对于损失的利润大小。 例如, 1 : 1 - 这决定了 TP = SL 的大小。 2 : 1 - 这意味着 TP 是 SL 的两倍。 RR -
      欢迎来到 Trade Manager EA——这是一个终极风险管理工具,旨在使交易变得更直观、精准和高效。它不仅仅是一个下单工具,而是一个用于无缝交易计划、仓位管理和风险控制的全面解决方案。不论您是新手交易员、资深交易员,还是需要快速执行的剥头皮交易员,Trade Manager EA 都可以满足您的需求,适用于外汇、指数、大宗商品、加密货币等各种市场。 借助 Trade Manager EA,复杂的计算已成过去。只需分析市场,在图表上用水平线标记入场、止损和止盈,设置您的风险水平,Trade Manager 就会立即计算出理想的头寸规模,并实时显示以点、账户货币计价的止损和止盈。每笔交易都得以轻松管理。 主要功能: 头寸规模计算器 :根据定义的风险瞬间确定交易规模。 简单的交易计划 :在图表上用可拖动的水平线直接计划交易,设置入场、止损和止盈。 实时显示 SL 和 TP :以账户货币、点或分显示止损和止盈,便于分析。 高级保护工具 盈亏平衡选项 : 基本盈亏平衡 :当您的交易达到设定水平时自动保护利润。 多级盈亏平衡 :设置多达 4 个级别以逐步保护利润。 尾随止损选项 : 基本尾随
      ================================================================================ POC BREAKOUT - V20.72. Full Professional Grade Toolkit ================================================================================ POC Breakout is a full MetaTrader 5 trading dashboard for discretionary traders who want breakout signals, Point of Control (POC) context, volume profiles, order flow, market structure, news, alerts, and advanced trade planning in one professional workspace. Attached directly to you
      TradePanel MT5
      Alfiya Fazylova
      4.88 (166)
      交易面板是一款多功能交易助手。该应用包含超过50种手动交易功能,并允许您自动执行大多数交易任务。 在购买之前,您可以在演示账户上测试演示版本。下载用于演示账户的试用版应用程序: https://www.mql5.com/zh/blogs/post/762579 。 完整说明 这里 。 贸易. 只需单击一下即可执行交易操作: 打開掛單和頭寸,並自動計算風險。 一鍵打開多個訂單和頭寸。 打開訂單網格。 按組別關閉掛單和頭寸。 反轉頭寸方向(關閉買入>打開賣出,關閉賣出>打開買入)。 鎖定頭寸(通過開啟缺少的頭寸,使買入和賣出頭寸的數量相等)。 一鍵部分關閉所有頭寸。 將所有頭寸的止盈和止損設置在同一價格水平。 將所有頭寸的止損設置在盈虧平衡水平。 開倉時,可使用以下功能: 在多個訂單或倉位之間分配計算出的數量(在單擊一次時開啟多個訂單和倉位)。 在開啟訂單前在圖表上可視化交易水平。 僅在當前點差不超過設定值時才開啟倉位。 止盈和止損之間的自動比例。 虛擬止損和止盈。 自動將止損和止盈的大小增加為當前點差的大小。 基於ATR指標讀數計算止盈和止損。 設置掛單的到期日期。 為掛單設置追蹤(掛單
      测试版发布 Telegram to MT5 Signal Trader 即将进入正式的 Alpha 版本。一些功能仍在开发中,您可能会遇到一些小错误。如果您遇到问题,请反馈,您的意见将帮助我们改进软件。 Telegram to MT5 Signal Trader 是一款强大的工具,能够将 Telegram 频道或群组的交易信号自动复制到您的 MetaTrader 5 账户。 支持公开和私人频道,可将多个信号提供者连接至一个或多个 MT5 账户。软件优化、高效、稳定,精准控制每笔复制交易。 界面简洁,仪表盘美观,图表交互性佳,导航直观。您可以管理多个信号账户,自定义每个提供者的设置,并实时监控所有操作。 系统需求 由于 MQL 限制,EA 需要配合 PC 端应用与 Telegram 通信。 安装程序可通过官方 安装指南 获取。 核心功能 多提供者支持: 从多渠道复制信号至多个 MT5 帐户 高级信号识别: 关键词、模式和标签全面自定义 逐提供者控制: 可启用/禁用特定信号类型、平仓策略等 灵活风险管理: 固定手数、固定金额、余额/权益百分比、部分平仓设置 可定制 SL/TP: 覆盖信号
      Farmed Hedge Yield Farming | All Markets (Manual - Hybrid - Semi/Automated EA) MULTI-ASSET SUPPORT Trade any asset available on your broker - Forex: Major, Minor, Exotic pairs - Crypto: BTC, ETH, XRP, SOL, BNB - Stocks: Apple, Tesla, Amazon, Google, etc. - Commodities: Gold, Silver, Oil, Gas - Indices: US30, NAS100, SPX500, DAX40 - Any CFD your broker offers VERIFIED TRADING RESULTS - Farmed Hedge Yield Axi Copy:  https://www.mql5.com/en/signals/2356376 - Farmed Hedge Yield Exn Copy:   https:/
      Telegram to MT5 Multi-Channel Copier 可自动将您 Telegram 频道中的交易信号直接复制到 MetaTrader 5。无需机器人,无需浏览器扩展,无需手动复制。您在 Telegram 上收到信号,EA 会在几秒钟内在您的终端上开仓。 本产品包含两个组件:一个监听您 Telegram 频道的 Windows 应用程序,以及在您的 MT5 终端上执行信号的 EA。同时也提供 MT4 版本。 设置指南和应用程序下载: https://www.mql5.com/en/blogs/post/768988 工作原理 Windows 应用程序使用您自己的 API 凭据连接到 Telegram,而不是机器人。这意味着它可以读取您订阅的任何频道、群组或话题,包括私人和 VIP 频道。检测到信号后,它会进行解析并发送给 EA。EA 根据您的经纪商解析交易品种名称,基于您的风险设置计算手数,然后开仓。 整个过程都是自动的。您无需守在电脑前。 打开应用程序并登录 Telegram(仅第一次)。 选择要监听的频道或话题。 按下 Start。EA 会处理其余的一切。 支持的
      Exp COPYLOT CLIENT for MT5
      Vladislav Andruschenko
      3.97 (35)
      适用于 MetaTrader 5 的专业交易复制器 快速、专业、稳定可靠的 交易复制器 ,适用于 MetaTrader 。 COPYLOT 可在 MT4 和 MT5 终端之间复制 Forex 交易,并支持 Hedge 和 Netting 账户。 COPYLOT 的 MT5 版本支持: - MT5 Hedge → MT5 Hedge - MT5 Hedge → MT5 Netting - MT5 Netting → MT5 Hedge - MT5 Netting → MT5 Netting - MT4 → MT5 Hedge - MT4 → MT5 Netting MT4 版本 完整说明 + DEMO + PDF 如何购买 如何安装 如何获取日志文件 如何测试和优化 Expforex 的所有产品 您也可以将交易复制到 MT4 终端(MT4 → MT4,MT5 → MT4): COPYLOT CLIENT for MT4 COPYLOT 是一款专业的交易和持仓复制器,可同时与 2、3 甚至 10 个终端协同工作。 支持从 模拟账户和投资者账户 复制,也支持同时在多个终端上运行。 您可以使
      Premium Trade Manager - 内置交易导师的图表面板 Premium Trade Manager 将一位交易导师嵌入您的图表,并在其下搭载完整的执行引擎。像往常一样建立交易,然后让您的 AI 交易导师 Max 读取这笔具体的交易,结合您的实时账户给出直接判断,再由您决定是否下单:止损是否符合纪律化交易的要求、风险规模是否合理、高影响新闻事件是否即将发布、您是否接近资金盘限额。其下是完整的执行引擎,负责点击之后的一切:一键按风险下单、您在图表上拖动规划且交易进行中仍可随时调整的计划、最多四个分批止盈级别、七种移动止损方式、实时资金盘合规检查、新闻屏蔽保护,以及对自身成本进行评级的点差功能。决策由您做出。Max 给出第二次审视。面板负责此后的一切。 购买前先亲手体验。 直接在浏览器中点击实时面板,这是在购买前感受其工作方式的最快途径。 stein.investments/products/premium-trade-manager Max 是您的一对一 AI 交易导师,他直接内置于面板之中。  他了解您的账户、您的设置和您的规则,用您自己的语言回答,并在每笔交易下单前进
      Footprint Chart Pro — Professional OrderFlow EA for MetaTrader 5 Version 6.34 | Professional tool for real traders | Institutional-Grade Visualization DEMO USERS - PLEASE SELECT EVERY TICK / REAL TICK WHEN TESTING AND YOU HAVE DOWNLOADED HISTORICAL DATA. IF YOU SEE A WAITING SCREEN AND IT IS NOT DOWNLOADING, IT MEANS YOU HAVE LOW HISTORICAL DATA. TRY 1 MIN AND 5 MIN FIRST ON 1 DAY DATA. ONE DAY DATA SHOULD BE THE NEWEST AND MOST CURRENT DATE. PLEASE WAIT UNTIL THE MARKET HAS ROLLED OVER PERIOD.
      Anchor Trade Manager
      Kalinskie Gilliam
      5 (6)
      Anchor: The EA Manager Your EAs manage their own trades. Anchor manages the account around them. Anchor gives you one place to control your EAs, manage risk and decide when trading is allowed. Any EA, any vendor, any broker or symbol. No source-code changes required. The Problem Most EAs only know what they are doing. They cannot see when another EA is already trading, when several EAs open and are stacking risk or when the account has reached your loss limit. Even using just one EA, it may not
      Adam FTMO MT5
      Vyacheslav Izvarin
      5 (2)
      ADAM EA Special Version for FTMO Please use ShowInfo= false for backtesting ! Our 1st EA created using ChatGPT technology Trade only GOOD and checked PROP FIRMS  Default parameters for Challenge $100,000 Tested on EURUSD and GBPUSD only  Use 15MIN Time Frame Close all deals and Auto-trading  before Weekend at 12:00 GMT+3  Friday For Prop Firms MUST use special Protector  https://www.mql5.com/en/market/product/94362 --------------------------------------------------------------------------------
      YuClusters
      Yury Kulikov
      4.93 (43)
      Attention: You can view the program operation in the free version  YuClusters DEMO .  YuClusters is a professional market analysis system. The trader has unique opportunities to analyze the flow of orders, trade volumes, price movements using various charts, profiles, indicators, and graphical objects. YuClusters operates on data based on Time&Sales or ticks information, depending on what is available in the quotes of a financial instrument. YuClusters allows you to build graphs by combining da
      Power Candles 策略扫描器——自优化多符号设置查找器 Power Candles策略扫描器 采用与Power Candles指标相同的自优化引擎,可同时扫描您“市场观察”中的所有交易品种。一个面板即可显示当前哪些品种在统计上具备交易价值、每种策略的最佳应用方向、最优止损/止盈组合,并在新信号触发时立即向您发送提醒。 本工具是 Stein Investments 生态系统的一部分 - 18+ 款工具,加上 Max,您的一对一 AI 交易导师。  随时在线,深入了解每一款指标,在您需要梳理思路的那一刻就在那里。  立即认识他: https://stein.investments 您的全面市场监控。每个交易品种超过3,000次自动优化。2种警报类型。一键切换图表并采取行动。 为何您需要此工具 大多数多标的扫描器仅展示价格 波动 。每只股票的波动率、百分比变化、RSI。您仍需自行摸索正确的策略、合适的止损位以及理想的入场阈值。Power Candles策略扫描器针对每只股票自动解答这些问题,仅在数学验证过的交易设置中触发实际入场信号时才会向您发出提示。这就是全部卖点。 自动
      The product will copy all telegram signal to MT5 ( which you are member) , also it can work as remote copier.  Easy to set up, copy order instant, can work with almost signal formats, image signal,  s upport to translate other language to English Work with all type of channel or group, even channel have "Restrict Saving Content", work with  multi channel, multi MT5 Work as remote copier: with signal have ticket number, it will copy exactly via ticket number. Support to backtest signal. How to s
      Welcome to ENTRY IN THE ZONE WITH SMC MULTI TIMEFRAME Entry In The Zone and SMC Multi Timeframe is a real-time market analysis tool based on Smart Money Concepts (SMC), designed to analyze market structure, price direction, and key trading zones. It supports both Single-Timeframe Analysis and Multi-Timeframe Analysis, providing a clearer view of the overall market structure across multiple timeframes, with real-time BUY / SELL signals that do not repaint. It is designed to help filter trading op
      MetaTrader 5 专业交易面板 —— 图表与键盘一键交易的高效控制中心 一款面向主动交易者的专业 Trading Panel,可让您比标准 MetaTrader 操作方式更快、更直观地完成开仓、平仓、修改、管理与控制。 这不是一个普通的小工具,而是一个为高频手动操作、仓位管理、挂单控制与利润管理而设计的完整交易工作台。 通过这套面板,您可以直接在图表上一键执行交易,通过键盘快速触发核心操作,并借助自动参数计算、图形提示、信息标签以及可视化管理功能,大幅减少重复性操作,让整个交易流程更加流畅、高效且专业。 使用我们的交易面板,您可以直接从图表上一键下单,执行交易操作的速度可比标准 MetaTrader 控件快约 30 倍。 全新高级版本现已推出: 使用 VirtualTradePad PRO SE 升级您的交易流程 — 适用于 MetaTrader 5 和 MetaTrader 4 的新一代专业交易面板。 MT4 版本 | 完整说明 + DEMO + PDF | 如何购买 | 如何安装 | 如何获取日志文件 | 如何测试与优化 | Expforex 的所有产品 为什么交易者会
      EA Auditor
      Stephen J Martret
      5 (4)
      EA Auditor is an independent analysis tool for traders evaluating Expert Advisors and trading signals on MetaTrader 5. It audits backtest reports, reviews posted developer signals, and cross-verifies the two against each other to help traders assess strategies before committing capital. The MQL5 market offers a wide range of Expert Advisors from many developers, with varying approaches, quality, and transparency. EA Auditor provides a consistent, data-driven framework for reviewing them, answer
      Timeless Charts
      Samuel Manoel De Souza
      5 (7)
      Timeless Charts is an all-in-one trading utility for professional traders. It combines custom chart types such as Seconds Charts and Renko with advanced order flow analysis using Footprints , Clusters , Volume Profiles , VWAP studies, and anchored analysis tools for deeper market insight. Trading and position management are handled directly from the chart through an integrated trade management panel , while Market Replay and Virtual Accounts provide environments for practicing trading skills and
      Trade Manager DaneTrades
      Levi Dane Benjamin
      4.23 (30)
      交易管理器可帮助您快速进入和退出交易,同时自动计算风险。 包括帮助您防止过度交易、报复性交易和情绪化交易的功能。 交易可以自动管理,账户绩效指标可以在图表中可视化。 这些功能使该面板成为所有手动交易者的理想选择,并有助于增强 MetaTrader 5 平台。多语言支持。 MT4版本  |  用户指南+演示 交易经理在策略测试器中不起作用。 如需演示,请参阅用户指南 风险管理 根据%或$自动调整风险 可选择使用固定手数或根据交易量和点自动计算手数 使用 RR、点数或价格设置盈亏平衡止损 追踪止损设置 最大每日损失百分比,在达到目标时自动平仓所有交易。 保护账户免遭过多提款并阻止您过度交易 最大每日损失(以美元为单位)在达到目标时自动关闭所有交易。 保护账户免遭过多提款并阻止您过度交易 一键实现所有交易的盈亏平衡 自动计算从手机/电话发送的交易的风险 OCO 在设置中可用 交易和头寸管理 通过设置每月、每周、每天、每小时或每分钟的最大交易次数,停止过度交易和报复性交易。 高级挂单管理。 调整何时关闭挂单的规则 追踪挂单 支持市价订单和挂单 每日最大利润目标(以美元为单位)以确保头寸并停止
      The News Filter MT5
      Leolouiski Gan
      4.78 (23)
      这个产品在新闻时间过滤所有的专家顾问和手动图表,因此您不必担心突然的价格波动会破坏您的手动交易设置或其他专家顾问输入的交易。此产品还带有完整的订单管理系统,可在任何新闻发布前处理您的持仓和挂单。一旦您购买了   The News Filter ,您将不再需要依赖以后的专家顾问内置的新闻过滤器,因为这个产品可以从此过滤它们所有。 新闻选择 新闻来源于Forex Factory的经济日历。 选择可以基于任何一种货币,如USD,EUR,GBP,JPY,AUD,CAD,CHF,NZD和CNY等。 选择也可以基于关键识别,例如Non-Farm (NFP),FOMC,CPI等。 能够选择新闻影响级别的筛选,从低、中、到高影响。 自动模式只选择与图表相关的新闻。 新闻来源每小时自动刷新,以确保最新的新闻数据。 为每个新闻影响级别提供单独的输入,以确定您要过滤掉的新闻发布前后的分钟数。 订单管理选项 在新闻发布前关闭未平仓头寸的选项,并在新闻发布后恢复它们。 在新闻发布前删除挂单的选项,并在新闻发布后恢复它们。 在新闻发布前移除止损和止盈水平的选项,并在新闻发布后恢复它们。 在新闻发布前移动止损和
      用我们先进的 Telegram Bridge EA 提升您的交易信号 是时候用专业且视觉上吸引人的实时交易更新来吸引您的受众了。 联系我查看演示并获取试用版本 我们在用户友好功能上进行了大量投资,为客户和提供商创造独特的体验。  SIGNAL BRIDGE 能够为所有业务场景提供 100% 复制器友好的信号,即使在其他 EA 挣扎的情况下也能绕过 Metatrader 逻辑! 我们的 Telegram Bridge EA 自动将信号、图表截图和详细的绩效报告直接发送到您的 Telegram 群组——无需您动一根手指。 查看 功能输入详细说明手册点击这里! 主要功能和优势 全面的交易数据 决定在每条消息中显示什么:点数、入场价格、止损、止盈、手数,甚至风险和风险回报比。让您的追随者完全透明。 发送新订单、更新止损止盈、从设置中自定义保本点,发送 100% 复制器友好的部分平仓  超酷图表附件功能 包含每笔交易的截图,显示您的入场点、止损/止盈和整体市场背景。非常适合在每次更新中建立信任和清晰度。 选择图表模板,自定义交易颜色,决定缩放  决定附加位置:所有交易、仅挂单、仅市价单
      Quant AI Agents
      Ho Tuan Thang
      5 (1)
      Quant AI Agents are independent trading Expert Advisors. Instead of trading using a fixed strategy like other conventional EAs, Quant AI Agents   is a   multi-agent AI trading framework   that turns natural-language strategy prompts into live.  WANT THE SAME RESULTS AS MY LIVE SIGNAL?   Use the exact same brokers I do:   IC MARKETS , IC TRADING   .  Unlike the centralized stock market, Forex has no single, unified price feed.  Every broker sources liquidity from different providers, creating un
      VirtualTradePad PRO SE MT5 — MetaTrader 5 专业交易控制中心 VirtualTradePad PRO SE 是一款基于图表的高级交易面板,也是适用于 MetaTrader 5 的交易管理工作区。它专为希望获得更快执行、更清晰持仓控制、结构化交易管理、可视化价位规划,以及直接在图表上完成专业交易流程的交易者而设计。 这不仅仅是一个 BUY / SELL 面板。PRO SE 将手动交易、挂单、持仓管理、部分平仓、篮子利润/亏损控制、加仓均价层级、ATM 规则、信号监控、实时市场信息、策略测试器 (Strategy Tester) 流程以及面向 VPS 的运行方式整合到一个互相关联的界面中。 MT4 版本 | 完整说明和截图 | 如何购买 | 如何安装 | 如何获取日志文件 | 如何测试与优化 | Expforex 的所有产品 为什么交易者会选择这套面板 图表一键交易 ,并支持键盘快速操作 快速完成开仓、平仓、修改、反转、锁仓与部分平仓 深度控制仓位、挂单、总利润与风控逻辑 自动参数计算,减少手动输入与重复劳动 为什么 PRO SE 比标准手动交易更高
      Trade Assistant 38 in 1
      Makarii Gubaydullin
      4.91 (23)
      多功能工具:手数计算器,网格订单,风险回报比,交易管理器,供求区域,价格行为等等 演示版本   |   用户手册 交易助手   不能在策略测试器中工作 :您可以下载   此处的演示版本  来测试此 工具 。 联系我   如有任何问题  / 改进建议 / 发现错误 如需MT4版本,请访问 此处 简化、加速并自动化您的交易   流程 。通过此   仪表板 扩展标准终端功能。 交易面板  适用于任何交易品种:外汇、股票、指数、加密货币等。 1. 开立新交易 :手数 / 风险 / 风险回报比计算 :手动交易的风险管理 手数计算器(根据风险大小计算交易量) 风险计算器(根据手数大小计算风险金额) 风险回报   比率 网格订单:  + 动态距离选项,及拆分手数选项 订单激活触发器,+ 买入止损限价 / 卖出止损限价 虚拟止损,虚拟止盈(隐藏止损,隐藏止盈:经纪商不可见) 智能止损 / 入场价位:若K线收盘突破则避免虚假触发 隐藏订单(虚拟挂单) 计划订单:即使市场休市也可挂单交易(周末计划器) 额外多级止盈价位 具有不同ID的OCO(一单取消另一单)订单 图表上的交易可视化 + 调整 止损 /
      KT Equity Protector MT5
      KEENBASE SOFTWARE SOLUTIONS
      3.6 (5)
      每一位 MetaTrader 交易者都应该运行,却很多人还没有使用的一款 EA。 大多数账户爆仓,并不是因为策略本身错了。真正的原因往往是在某个糟糕的时刻,交易者让亏损继续扩大、加仓硬扛、把订单留到周末、把一整周的盈利还给市场,或者因为一次错误点击而忘记了 prop firm 的每日亏损限制。 KT Equity Protector 就是那个不会让这种事情发生的自动账户守护者。 把它安装在任意一个图表上。通过清晰易懂的引导式设置向导,一次性设定你的规则:每日亏损、最大回撤、盈利目标、净值追踪止盈、周末前平仓。从那一刻开始,这款 EA 会实时监控你的整个 MetaTrader 账户。每一笔持仓。每一个交易品种。每一个 tick。当某条红线被触发时,它会立即执行你选择的动作:提醒、关闭亏损订单、关闭盈利订单、关闭全部订单,或者关闭全部订单并从终端中移除所有其他 EA,防止任何程序重新开仓。 没有情绪。没有延迟。没有犹豫。只有你每天都希望自己能够严格遵守的自动化纪律规则。 KT Equity Protector 实际上做什么 KT Equity Protector 不是交易机器人。它不会开
      Trader Evolution
      Siarhei Vashchylka
      5 (7)
      " Trader Evolution " - A utility designed for traders who use wave and technical analysis in their work. One tab of the utility is capable of money management and opening orders, and the other can help in making Elliott wave and technical analysis. Manual (Be sure to read before purchasing) | Version for MT4 Advantages 1. Trading in a few clicks. Immediate and pending orders are available in the panel 2. Money management. The program automatically selects the appropriate lot size 3. Simplifies
      Patrex pro
      Chioma Obunadike
      5 (2)
      Patrex Pro: Maximize Your Trading Potential Patrex Pro is an advanced trading bot designed to help traders optimize their trading strategies and maximize their potential returns. With its cutting-edge technology and user-friendly interface, Patrex Pro is the ultimate tool for traders seeking to elevate their trading game. Get MT4 Version Key Features: 1. Position Hedging: Patrex Pro allows users to hedge their positions based on their individual risk tolerance and market analysis. 2. Advanced R
      Custom Alerts:监控多个市场,绝不错过关键交易信号 概述 Custom Alerts 是一款动态工具,专为希望集中监控多个交易品种潜在机会的交易者设计。通过整合我们旗舰工具(如 FX Power、FX Volume、FX Dynamic、FX Levels 和 IX Power)提供的数据, Custom Alerts 可自动通知您关键的市场变化,无需频繁切换图表,也不会错过交易良机。现在,它支持您的经纪商提供的所有资产类别,只需在设置中选择相应的资产类别即可,无需手动输入任何品种名称。 1. 为什么 Custom Alerts 对交易者非常有帮助 一体化市场监控 • Custom Alerts 收集并整合来自外汇、贵金属、加密货币、指数,甚至(若经纪商支持)股票市场的信号。 • 无需频繁切换图表,一切通知集中呈现。 根据策略定制提醒 • 精准设置提醒条件。无论是追踪成交量激增、强度突破,还是极端价格波动, Custom Alerts 都能确保您不会错过任何关键信号。 • 可与 Stein Investments 工具无缝集成,助您更深入分析与优化交易决策。 节省时
      MT5 to Telegram Signal Provider 是一个易于使用且完全可自定义的工具,它允许向 Telegram 的聊天室、频道或群组发送 指定 的信号,将您的账户变为一个 信号提供商 。 与大多数竞争产品不同,它不使用 DLL 导入。 [ 演示 ] [ 手册 ] [ MT4 版本 ] [ Discord 版本 ] [ Telegram 频道 ]  New: [ Telegram To MT5 ] 设置 提供了逐步的 用户指南 。 不需要了解 Telegram API;开发者提供了您所需的一切。 关键特性 能够自定义发送给订阅者的订单详情 您可以创建分层的订阅模型,例如铜、银、金。其中金订阅获得所有信号等。 通过 id、符号或评论过滤订单 包括执行订单的图表截图 在发送的截图上绘制已关闭的订单,以便额外核实 延迟发送新订单消息的可能性,以便在发送前对位置进行调整 订单详情完全透明: 新的市场订单*带截图 订单修改(止损、获利) 已关闭的订单*带截图 部分关闭的订单** 新的挂单 修改的挂单(进场价格) 挂单激活(作为新的市场订单附加) 已删除的挂单 历史订单报告
      作者的更多信息
      Running along Lines MT5
      Pavel Verveyko
      5 (1)
      The indicator draws support and resistance lines on an important part of the chart for making decisions. After the trend line appears, you can trade for a breakout or rebound from it, as well as place orders near it. Outdated trend lines are deleted automatically. Thus, we always deal with the most up-to-date lines. The indicator is not redrawn . Settings: Size_History  - the size of the calculated history. Num_Candles_extremum  - the number of candles on each side of the extremum. Type_Arrow
      Turn
      Pavel Verveyko
      The indicator shows the market turning points (entry points). Reversals allow you to track rebound/breakout/testing from the reverse side of the lines of graphical analysis or indicators. Reversals can be an independent signal. The indicator allows you to determine reversals taking into account the trend and without it. You can choose a different period for the movement preceding the reversal, as well as the volatility coefficient. When plotting reversals, the indicator takes into account volati
      Length Movement
      Pavel Verveyko
      5 (1)
      Measures the length of the selected movement in points, shows the duration of the movement, as well as the speed of movement.   Outputs the average value of each dimension. It is designed to calculate the expected target based on typical market movements. The intended goal will provide information about the ratio of the stop size to the possible profit and will allow you not to open positions with a small expected profit. It will also help you determine the point at which it is more logical to c
      The indicator allows you to quickly switch from one instrument to another, from one time period to another using the keyboard or buttons on the monitor. Each command can be assigned a hot key from 0-9, a-Z (case-insensitive) and VK_OEM_COMMA ("<" on the keyboard) and VK_OEM_PERIOD (">" on the keyboard). This can help you to operate the maximum number of instruments that are available at your broker, analyze more instruments/periods in less time. This product cannot be tested in the tester , beca
      Ratio TP SL
      Pavel Verveyko
      5 (1)
      This indicator allows you to measure the profitability of each specific transaction (the ratio of Stop and Profit). The indicator allows you to adjust the ratio by step size and number of steps. You can build an unlimited number of ratios to compare the risks from different movements. Note: in MT4, the number of horizontal lines in a single ratio cannot exceed 32. Building a line : click the " Ratio " button and draw a line (mouse click - the first point of the line, where the mouse is release
      Corporate Report
      Pavel Verveyko
      5 (1)
      The script displays info about the share's corporate reports and dividends. The data is downloaded from   investing.com : Report date Profit per share (EPS) Revenue Market capitalization Amount of dividends Date of payment of dividends Dividend income The product cannot be tested in the tester (since it is not possible to receive data from the Internet). Before launching:  Add 2   URL   https://ru.investing.com/earnings-calendar/Service/getCalendarFilteredData  and   https://ru.investing.com/di
      Channel FTF
      Pavel Verveyko
      The Envelopes indicator determines the presence of a trend or flat. It has 3 types of signals, shows the probable retracement levels and levels of the possible targets. The Fibonacci coefficients are used in the indicator's calculations. Signals (generated when touching the lines or rebounding from lines): Trend - the middle line of the Envelopes has a distinct inclination; the lines below the channel's middle line are used for buy trades, the lines above the middle line and the middle line itse
      Mr Big
      Pavel Verveyko
      The indicator shows and highlights the chart candles, which are formed as a result of large players entering the market in large volumes. Such candles can also be formed after achieving a certainty on the market, when most of the participants hold positions in the same direction. The movement is likely to continue in that direction after such candles. The indicator highlights the significant candles from the existing ones on the chart; The indicator allows identifying the trends based on candles
      Splash
      Pavel Verveyko
      The indicator identifies the most suitable moment for entering the market in terms of market volatility, when the market has the strength to move (the signal is indicated by an arrow under the candle). For each of the signals, the presence of trends on the current and higher timeframes is determined, so that the signal is in the direction of the majority of positions opened on the market (denoted near the signal by abbreviations of timeframes with a trend present). The signal appears after the c
      The indicator displays the key support and resistance levels on the chart. The significance of these levels lies in that the price may reverse or strengthen the movement when passing such levels, since they are formed as a consequence of the natural reaction of market participants to the price movement, depending on which positions they occupied or did not have time to occupy. The psychology of the level occurrence: there always those who bought, sold, hesitated to enter or exited early. If the
      This indicator is a multitimeframe trading strategy. It has the levels for stop loss, take profit and entry point. The order level can also be set manually. The indicator uses the regularity of the market, which manifests itself on all instruments, and does not require adjustment of the parameters. The strategy uses a proprietary approach to determining: trend, volatility, hierarchy of timeframe significance, the size of the history period (the number of candles), which is important for making a
      Trend Sync
      Pavel Verveyko
      5 (1)
      The indicator shows the trend of 3 timeframes: higher timeframe; medium timeframe; smaller (current) timeframe, where the indicator is running. The indicator should be launched on a chart with a timeframe smaller than the higher and medium ones. The idea is to use the trend strength when opening positions. Combination of 3 timeframes (smaller, medium, higher) allows the trend to be followed at all levels of the instrument. The higher timeframes are used for calculations. Therefore, sudden change
      The indicator detects important peaks and troughs (extremes) on the chart. These points can be used to plot support/resistance levels and trend lines, as well as any other graphical analysis. These points can serve as reference points for setting trading orders. The indicator does not redraw . Settings: Size_History  - the size of the calculated history. Num_Candles_Right  - number of candles to the right of the peak or trough. Num_Candles_Left  - number of candles to the left of the peak or
      Running along Lines
      Pavel Verveyko
      3 (2)
      The indicator draws support and resistance lines on an important part of the chart for making decisions. After the trend line appears, you can trade for a breakout or rebound from it, as well as place orders near it. Outdated trend lines are deleted automatically. Thus, we always deal with the most up-to-date lines. The indicator is not redrawn . Settings: Size_History  - the size of the calculated history. Num_Candles_extremum  - the number of candles on each side of the extremum. Type_Arrow
      Key Volumes
      Pavel Verveyko
      1 (1)
      The indicator shows key volumes confirmed by the price movement. The indicator allows you to analyze volumes in the direction, frequency of occurrence, and their value. There are 2 modes of operation: taking into account the trend and not taking into account the trend (if the parameter Period_Trend = 0, then the trend is not taken into account; if the parameter Period_Trend is greater than zero, then the trend is taken into account in volumes). The indicator does not redraw . Settings History_S
      Catch Impulse
      Pavel Verveyko
      This trading system is based on market impulses of varying complexity.   To generate a signal, the indicator uses the moments when the direction of the pulse and the necessary section of the trend coincide. The indicator also takes into account the current market volatility. Stop_loss tags can be set with the parameter "0" or "1", then Stop_Loss will take into account market volatility.   Take_Profit tags can be set with the parameter "0", then Take_Profit will take into account market volatil
      Indexes
      Pavel Verveyko
      The stocks that make up the index are one of the drivers of the movement. Analyzing the financial performance of all elements of the index, we can assume further development of the situation. The program (script) displays corporate reports of shares that are part of the index selected in the settings.   "Indexes" cannot be tested in the tester (since there is no way to get information from the Internet). Information is downloaded from the site investing.com: Report Date Earnings per share (E
      Fibo World
      Pavel Verveyko
      The indicator builds a graphical analysis based on the Fibonacci theory. Fibo Fan is used for the analysis of the impulses and corrections of the movement. Reversal lines (2 lines at the base of the Fibonacci fan) are used to analyze the direction of movements. The indicator displays the of 4 the target line in each direction. The indicator takes into account market volatility. If the price is above the reversal lines, it makes sense to consider buying, if lower, then selling. You can open posi
      The indicator determines the state of the market: trend or flat. The state of the market is determined by taking into account volatility. The flat (trading corridor)is displayed in yellow. The green color shows the upward trend. The red color shows the downward trend. The height of the label corresponds to the volatility in the market. The indicator does not redraw . Settings History_Size   - the amount of history for calculation. Period_Candles  - the number of candles to calculate the indicat
      The indicator plots flexible support and resistance levels (dots). A special phase of movement is used for construction. Levels are formed dynamically, that is, each new candle can continue the level or complete it. The level can provide resistance or support to the price even where it is no longer there. Also, support and resistance levels can change roles. The importance of levels is affected by: the amount of time the level is formed and the number of touches. The significance of these lev
      The indicator is a trading system for short-term trading. Scalper Assistant helps to determine the direction of the transaction, and also shows the entry and exit points. The indicator draws two lines (possible points for opening positions). At the moment of the breakdown of the upper line up (and when all trading conditions are met), an up arrow appears (a buy signal), as well as 2 goals. At the moment of the breakdown of the lower line down (and when all trading conditions are met), a down ar
      Gold n XAU
      Pavel Verveyko
      The trading system is designed to work with gold on time periods: 30M, 1H. The indicator allows you to adjust to the market situation. Parameters for 1H :   PERIOD=9F ,   FILTER=300 .   Parameters for  30M :   PERIOD=22B ,   FILTER=450 .   A small adjustment to a specific broker is allowed .   If you change the amount of history displayed, you may also need to adjust the parameters. The indicator is not redrawn.     "Gold n XAU" uses different rules for entering a trade and different rules fo
      The indicator builds "psychological levels": levels of round numbers and intermediate levels of round numbers. Round numbers play an important role in forming support and resistance levels. There is a pattern in which the decline or growth of the price can stop at round numbers. The level whose price ends at 0 is the level of a round number of the first order. Intermediate level, this is the level between two round levels, for example, between 10 and 20 this is level 15. In the " Num_Zeros "
      Ichimoku Map
      Pavel Verveyko
      Ichimoku Map (instant look at the markets) - built on the basis of the legendary Ichimoku Kinko Hyo indicator. The task of the Ichimoku Map is to provide information about the market strength on the selected time periods and instruments, from the point of view of the Ichimoku indicator. The indicator displays 7 degrees of buy signal strength and 7 degrees of sell signal strength. The stronger the trend, the brighter the signal rectangle in the table. The table can be dragged with the mouse. The
      The indicator displays a stock chart of a non-standard type, in which the price and time have the same value. The usual chart of Japanese candlesticks does not take into account all the information that the time analysis can give. Renko charts do not use all the information that price can give in relation to time. The "Chart Price and Time" indicator takes into account price and time equally and shows the predominance of price or time. Taking into account price and time equally gives an idea
      The indicator tracks sharp volatility (moments when the market has shown increased activity and movement may occur), on the selected instruments and time periods. The information is displayed as colored rectangles. Thus, it is possible to assess at a glance which tool should be given priority attention. The indicator will be useful for scalpers when they need a quick reaction or for traders working with a large number of instruments. The indicator does not redraw. The indicator displays 8 degree
      Alert Creator
      Pavel Verveyko
      The Alert Creator indicator is designed to create alerts for selected conditions. You can select one or several indicators for the notification. If several conditions are selected, the alert is triggered when all the selected conditions are met. The signals can be configured separately for buying and separately for selling. Example, a buy alert: the closing price is above the moving average, the RSI is below 20. (In this example, 2 indicators are used to generate an alert: MA and RSI) At the
      Trend Arithmetic
      Pavel Verveyko
      The indicator determines the strength of the trend and its possible reversal points, based on the author's arithmetic approach . Each new peak or trough is a trend development. Such peaks and troughs are numbered so that the strength of the trend development can be seen. Attempts to change the trend are also numbered. This gives an understanding of a possible change in the direction of the trend. Indicator signals are generated when trying to change the trend . In the settings, it is possible
      Level Predictor
      Pavel Verveyko
      该指标绘制可能成为未来显着支撑位和阻力位的潜在水平。 该线越长,在该水平击穿后价格反转或价格变动增加的可能性就越高。 随着电平形成概率的降低,线的长度减小。 该指标不需要调整。 在设置中,您可以更改指示器的设计。 " Line_Length "按钮放置在图表上以调整线的长度(为了便于感知指标)。 所选的" Line_Length "设置将为每个时间段和仪器保存。 " Line_Length "按钮可以用鼠标拖动。 当悬停在按钮的左边缘时,它会用选定的颜色突出显示,按下时,数字会减少,指示线会缩短。 当您将鼠标悬停在按钮的右边缘时,它会以选定的颜色突出显示,按下时,数字会增加,指示线会延长。 _________________
      Jumping along Levels is dedicated to the most important aspect of trading: support and resistance levels. This indicator is built using a unique technology based on proprietary development and testing algorithms. The indicator has a built-in intelligent market situation assessment system. It can automatically adjust to varying market volatility. Jumping along Levels simultaneously displays levels from different time periods on the current chart. It has a graphical table for working with comple
      筛选:
      krisnara123
      2210
      krisnara123 2020.12.17 14:35 
       

      This is a wonderful product for measuring Risk Reward..a welcome addition to Chartist's Toolkit.It supports many configuration options too.

      回复评论