Affine Chart

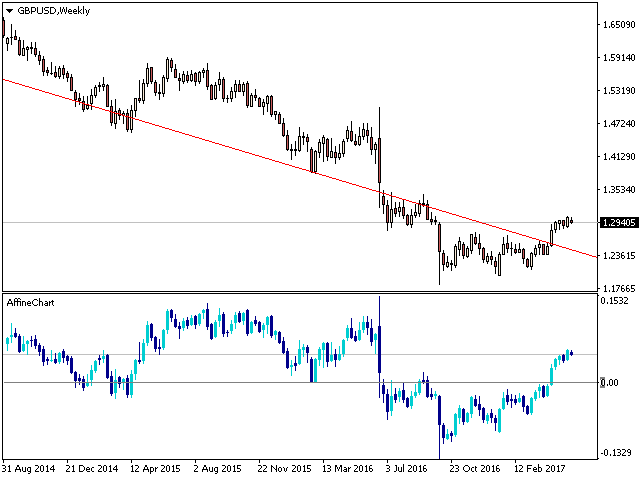
The indicator plots an affine chart for the current instrument by subtracting the trend component from the price. When launched, creates a trend line in the main window. Position this line in the desired direction. The indicator plots an affine chart according to the specified trend.


Input parameters

  • Maximum number of pictured bars - the maximum number of displayed bars.
  • Trend line name - name of the trend line.
  • Trend line color - color of the trend line.
  • Black candle color - color of a bullish candle.
  • White candle color - color of a bearish candle.
推荐产品
Keltner Channel MT4
Muhammad Robith
4.71 (7)
Keltner Channel is a well known indicator that not in MT4's indicators default lineup (You can get this from your broker somehow). This indicator helps you to define trend and sometimes overbought/oversold prices during flat trend. Input Description: EMAperiod: Moving Average period used for indicator. Must be higher than 1. ATRperiod: Average True Range period used for indicator. Must be higher than 1. multiplier: Multiplier used for determine channel's wide. Must be higher than 0 but may not b
FREE
FFx RVI
Eric Venturi-Bloxs
5 (1)
The purpose of this new version of the MT4 standard indicator provided in your platform is to display in a sub-window multiple timeframes of the same indicator. See the example shown in the picture below. But the display isn’t like a simple MTF indicator. This is the real display of the indicator on its timeframe. Here's the options available in the FFx indicator: Select the timeframes to be displayed (M1 to Monthly) Define the width (number of bars) for each timeframe box Alert pop up/sound/ema
FREE
Master the market rhythm with the Advanced Market Sessions indicator. Timing is everything in trading. Knowing exactly when major financial centers open and close is the key to understanding market volatility, liquidity, and directional bias. This indicator gives you crystal-clear visibility into the three major trading sessions: Asia, London, and New York. By automatically mapping the exact High and Low of each session in real-time, this tool empowers you to trade with true institutional contex
FREE
Market Dashboard FREE
Christian Opperskalski
Market Dashboard FREE Indicator gives you advanced information’s about your selected Symbols in MarketWatch Features Daily Price Movements (M1 – D1) RSI Values with Highlight Function for your current Timeframe & H1 & H4 Profit per Symbol and traded lots (buy & sell) EMA 5 – 100 based on selected period Swap Information (which direction is positive) FIBO Info & Tracking (highlighted FIBO Levels close to current price – based on selected period) One Click ChartOpen this Version is limited to 2
FREE
TradingSessions
Mikhail Nazarenko
Индикатор отображает различными цветами на фоне графика три торговые сессии. Открытие - закрытие Лондон, Нью Йорк, Токио по умолчанию. Применение Для успешной торговли важно знать начало и конец торговых сессий с наибольшей ликвидностью, так как именно в это время цена делает самые большие движения. Особенности Настройки по умолчанию - торговые сессии по Лондону, Нью Йорку, Токио. Возможность выставить свои рамки тоговых сессий Алерт при открытии сессии Показ открытия дня по GMT Настройки для
FREE
Advanced Trade Information Dashboard –  MT4 Everything I need to know about my account and open positions, right on the chart. I got tired of clicking between the terminal, the trade tab, and the calculator just to check my margin, pip value, or total profit in pips. So I built this dashboard to put it all in one place. What It Shows Total P&L – Real profit/loss from the positions I care about (filter by symbol, magic number, or include swap/commission). Margin Level – The one number that k
FREE
Sm Ichimoku Scanner
Steeve Christian Martol
5 (5)
Multi Time Frame Indicator acts as a Scanner based on the Ichimoku Trading System. The outcome is displayed on a board. This helps you to make "at a glance" a mental picture of the System without having to open the chart. Up to 10 Currencies can be watched. Scanned elements And Legend "KUMO Futur" - Green : The Kumo Futur is Bullish. "KUMO Futur" - Red : The Kumo Futur is Bearish. "PRICE Cross KJ" - Green : The Price is Above the Kijun Sen.  "PRICE Cross KJ" - Red : The Price is Below the Kijun
FREE
Shadow Flare MT4
Kestutis Balciunas
Shadow Flare 指标是一款适用于 MetaTrader 4 的 非重绘型趋势与流动性工具 。它基于可配置的移动平均基线(可选 HMA、EMA、SMA 或 RMA),在其外侧包裹一层平均真实波幅(ATR)通道,只在价格收盘有效突破上/下包络带时才切换“黏性”趋势状态。同一套趋势引擎还驱动自动供需区模块,用于检测枢轴高点和枢轴低点,在其周围绘制彩色矩形,并在价格收盘穿透该区域时立即将该区域标记为失效并移除。 买卖信号在趋势状态翻转的那一根 K 线上触发,可选的成交量与 RSI 过滤器帮助交易者屏蔽弱势或逆动能的入场。内置仪表盘会实时显示趋势偏向(Trend Bias)、动能(基于 RSI)以及成交量状态。完整的提醒组件——弹窗、声音、手机推送和电子邮件——在每次信号出现时于收盘触发一次,从而确保实盘交易与回测的信号数量完全一致。 MT5 版本请查看:  Shadow Flare MT5 更多作者产品:   查看所有产 品 想查看实盘示例和最新工具,请访问我的个人主页并发送好友请求,以免错过更新! 工作原理 自适应趋势引擎 指标首先根据用户选择的方法(HMA、EMA、SMA 或
FREE
FFx Stochastic
Eric Venturi-Bloxs
4.6 (5)
在您的平台上提供新版 MT4 标准指标的目的,是在子窗口里显示多时间帧的相同指标。参看下面例中的图片。 但是它的显示不像简单的多时间帧指标。它是指标在其时间帧的实际显示。 在 FFx 指标里提供了一些选项: 选择显示的时间帧 (M1 至 每月) 定义每个时间帧箱体的宽度 (柱线数量) 弹出提示/声音/邮件/推送 (随即振荡器与信号线交叉 和/或 随即振荡器 进入/离开 OBOS 区域) 直接在图表上激活/停用提示 修改所有颜色 ... 当然还有所有标准指标的常用设置 如何设置提示: 在弹出的参数设置 : 选择您希望的提示和模式 (弹出、声音、邮件或推送通知) 之后在图表上 : 选择铃铛图标 (双击) 然后将其拖拽到任意位置。在下一个报价来临,它将恢复它的原始位置,但用不同颜色信号改变它的状态。红到绿意为它现在已激活 … 绿到红意为它现在未激活。
FREE
Line Heiken Ashi
Andrei Gerasimenko
3.4 (5)
This is an unconventional version of the Heiken Ashi Smoothed indicator implemented as lines rather than a histogram. Unlike a usual histogram, the indicator draws the readings of the two moving averages in the form of colored lines. Example If the candle crosses two indicator lines upwards, a trend is assumed to be changing from bearish to bullish. If the candle crosses two indicator lines downwards, a trend is assumed to be changing from bullish to bearish. The indicator is good at displaying
FREE
Stat Monitor 4
Sergei Linskii
Stat Monitor is a good information indicator. Benefits of the indicator: The indicator provides useful information - the current spread, the cost of one lot of the symbol, trading leverage and the recommended lot size for trading. You can use the indicator on the MetaTrader 4 trading platform of any broker. The indicator provides useful information. Version of the Stat Monitor indicator for MetaTrader 5 I wish you all good luck in trading and stable profit!
FREE
SC MTF Rsi MT4
Krisztian Kenedi
5 (1)
具有多时间框架支持、可自定义视觉信号和可配置警报系统的相对强弱指数(RSI)指标。 自由职业编程服务、更新和其他TrueTL产品可在我的 MQL5主页 获取。 非常欢迎您的反馈和评价! 什么是RSI? 相对强弱指数(RSI)是一种动量振荡器,用于测量价格变化的速度和幅度。该指标在0到100之间振荡,比较在指定期间内近期涨幅与近期跌幅的大小。 RSI主要用于识别超买和超卖状态。高读数表示超买状态,而低读数表示超卖状态。交易者还会关注RSI与价格走势之间的背离,这可能预示着潜在的趋势反转。 功能特点: 带箭头和垂直线的视觉信号标记 三个独立信号缓冲区,带可配置触发器(方向变化、水平交叉、峰值/谷值、极端区域) 具有时间范围过滤的可配置警报功能(电子邮件、推送、声音、弹窗) 带插值方法的多时间框架(MTF)功能 多种绘图和颜色模式(直方图/线条,简单/方向/水平基础着色) 带可选中间水平的可调超买/超卖水平 用于Expert Advisor(EA)集成的自定义指标调用(iCustom)缓冲区访问 输入参数: 基本设置: RSI参数: 周期(默认:14)、应用价格、K线位移偏移量。 多时
FREE
The Magic SMA indicator is of great help in determining trend direction. It can be an excellent addition to your existing strategy or the basis of a new one. We humans can make better decisions when we see better visually. So we designed it to show a different color for rising and falling trends. Everyone can customize this in the way that suits them best. By setting the Trend Period, we can optimize it for longer or shorter trends for our strategy. It is great for all time frames. IF YOU NEED
FREE
Tmcd
Shaheen Hassanali
The Tmcd is a very smooth oscillator and a good indicator of trend. It has a noise filter built in which shows sideways markets and it can also show the beginning of a trend. It works on any symbol from Forex to commodities as well as crypto currencies. It does not require a change of settings. The default settings are fine. The use of it can be varied and I recommend it is be used in conjunction with other indicators. The indicator is free for use and your review will be appreciated. Join my T
FREE
TrailingStop MA 4
Andrej Nikitin
4 (1)
本指标绘制两条 简单移动均线 ,使用最高价和最低价。 MA_High 线当均线指向下行时显示。它可以用于设置空头订单的止损位。 MA_Low 线当均线指向上行时显示。它可以用于设置多头订单的止损位。 本指标用于 TrailingStop EA。 参数 Period - 移动均线的计算周期。 Deviation - 线间聚合/离散率。 缓存区索引: 0 - MA_High, 1 - MA_Low。
FREE
This indicator is designed for calculating the value of points for the specified lot sizes. The MT5 version is here  https://www.mql5.com/en/market/product/29230 Description by lines Line 1 - deposit currency. Line 2 - lot size (10 input parameters) . All further values are calculated into columns below each lot size. Line 3 - calculation of value for one point. Line 4 - calculation of value for spread. All subsequent lines - calculation of value for points (20 input parameters) . All you need t
FREE
FFx Awesome Oscillator
Eric Venturi-Bloxs
4 (1)
The purpose of this new version of the MT4 standard indicator provided in your platform is to display in a sub-window multiple timeframes of the same indicator. See the example shown in the picture below. But the display isn’t like a simple MTF indicator. This is the real display of the indicator on its timeframe. Here's the options available in the FFx indicator: Select the timeframes to be displayed (M1 to Monthly) Define the width (number of bars) for each timeframe box Alert pop up/sound/ema
FREE
Pivot Mean Oscillator
Marco Calabrese
4 (1)
Pivot Mean Oscillator (PMO) is a unbounded zero-centered oscillator that provides a quick and normalized measure of divergence between two spreads. Detailed description of the mathematical formulation along with some comments and experiments can be found in this article .  Trading aspects This version of PMO is tuned on spreads relative to Close and Open price signals against their cumulative moving average (CMA). Positive PMO(m,n) values means that last (normalized) m Close prices are higher t
FREE
APriceChannel is a modification of the standard Price_Channel indicator. The EA draws 2 levels - the upper level shows the price High for the specified period of time, the lower level shows the price Low for the same period. In addition to the period, you can set vertical offset in points to widen the channel up and down. This prevents false breakouts of current support/resistance levels. Inputs Period - time period in bars - the number of bars to calculate the price High/Low. Offset up and dow
FREE
Basic Supply Demand
Mehran Sepah Mansoor
4.33 (3)
基本供求指标是 一款功能强大的工具,旨在加强您的市场分析,帮助您在任何图表上识别关键机会区域。这款免费的 Metatrader 指标拥有直观易用的界面,能让您清楚地了解供需区域,从而做出更明智、更准确的交易决策/ 免费 MT5 版本 该指标的仪表盘扫描器: ( Basic Supply Demand Dashboard ) 功能特点 该指标可自动扫描图表中的供需区,无需进行繁琐的手动分析 图形显示距离最近的供应区和需求区的剩余距离 供应区以一种独特的颜色突出显示,而需求区则以另一种颜色显示,便于快速准确地进行解读 该指标会自动计算最近的供应区或需求区与图表上当前价格之间的距离(以点为单位),为您提供清晰、可量化的参考。以点数为单位的距离会清晰地显示在图表上,让您可以快速识别与当前价格有较大或较小距离的区域 在接近或突破供需区时发出警报 适用于任何时间框架 可选择深色或浅色主题,自定义图表显示效果 如何使用 建议使用 M1 和 M5 时间框架。观看下面的视频,了解其工作原理。
FREE
YKLotSize
Peechanat Chatsermsak
5 (1)
The YK-LOT-SIZE is an indicator that displays the total Lot Size and profit/loss of all trade orders for the current symbol on the price chart. It has the following features: Shows the total Lot Size of buy orders (BUY) and sell orders (SELL) on separate lines. Displays the profit/loss of buy orders (BUY) and sell orders (SELL) by calculating the sum of profit, commission, and swap. Users can customize the color of the displayed text through the input parameter. The information is displayed at t
FREE
这个小脚本会照亮你的生活。 下面是它的代码,你可以将它插入到任何机器人的 OnInit 中。 或更改颜色和比例以适合您的口味 #property copyright "V.Temchenko Skype:vasily.temchenko" #property link        " Mailto:tvp.prog.96 @gmail.com" #property version    "1.00" #property strict #property description    "Have questions? Skype: vasily.temchenko Viber: +38098 800-6-800" ; #property description    "If the voice - only Russian, Ukrainian or Belarusian" ; #property description    "And you can write in English, Russian, Ukrainian" ; #property description    "
FREE
FFx Fractals
Eric Venturi-Bloxs
4.5 (2)
The purpose of this new version of the MT4 standard indicator provided in your platform is to display in a sub-window multiple timeframes of the same indicator. See the example shown in the picture below. But the display isn’t like a simple MTF indicator. This is the real display of the indicator on its timeframe. Here's the options available in the FFx indicator: Select the timeframes to be displayed (M1 to Monthly) Define the width (number of bars) for each timeframe box Alert pop up/sound/ema
FREE
Currency Strength Multimeter
Sameer Shariff
4.57 (7)
貨幣強度萬用表指示器顯示以下每種貨幣的強度,方向和等級: AUD CAD CHF EUR GBP JPY NZD USD 此外,它還顯示以下每種貨幣對的強度,方向和等級: AUDCAD AUDCHF AUDJPY AUDNZD AUDUSD CADCHF CADJPY CHFJPY EURAUD EURCAD EURCHF EURGBP EURJPY EURNZD EURUSD GBPAUD GBPCAD GBPCHF GBPJPY GBPNZD GBPUSD NZDCAD NZDCHF NZDJPY NZDUSD USDCAD USDCHF USDJPY 該指標適用於任何圖表和任何時間範圍。每個貨幣和貨幣對的強度,方向和排名數據都可以通過指標緩衝區訪問。您可以將指標拖放到圖表上以顯示所有信息,也可以將指標配置為僅顯示其所在特定圖表的貨幣和貨幣對。 數據顯示為貨幣和貨幣對的水平條形圖。它還顯示僅針對貨幣的連續折線圖 指標輸入和默認值如下: BarsLimit = 60-計算中使用的條數。 Hours = 1-計算中使用的小時數。 ShowAllCurrencyPairs = t
FREE
Trade Progress
Georgi Gaydarov
Simple indicator that shows your history in pips and profit. You can use it to follow your progress on the positions. It shows you the trade progress only for the symbol that the indicator is on and only for your trade history. Label text is updated when order is closed. The text can be displayed on each corner, it is in the parameters. Basic input parameters: Label color Font size Conrner position Anchor position Note: corner and anchor have to be the same position.
FREE
FFx ATR
Eric Venturi-Bloxs
5 (1)
The purpose of this new version of the MT4 standard indicator provided in your platform is to display in a sub-window multiple timeframes of the same indicator. See the example shown in the picture below. But the display isn’t like a simple MTF indicator. This is the real display of the indicator on its timeframe. Here's the options available in the FFx indicator: Select the timeframes to be displayed (M1 to Monthly) Define the width (number of bars) for each timeframe box Alert pop up/sound/ema
FREE
GS spread
Aleksander Gladkov
The indicator calculates the current spread for each tick using the formula Spread=(ASK-BID)/Point. Schedule of changes in the boundaries spread over the timeframe displayed in a separate window from the date of accession of the indicator. Two lines corresponding to the minimum and maximum spread values are displayed. The indicator window is self-adjusted according to the minimum and maximum values from the moment of launch. The minimum and maximum values for the entire period of the indicator o
FREE
Moving Averages OnOff MT4
Fabrizio Malavasi
5 (2)
The Moving Averages On-Off  let you  control the indicator  using  the keyboard  or a  button . You can choose if you want the indicator always shown or always hided while switching among different time frames or financial instruments . --->  This indicator is part of Combo Indicator OnOff It's possible to use three Moving Averages , defined as  Short ,  Medium ,  Long or Raimbow MA 5,10,20,50,100,200. Input MOVING AVERAGES You can customize the price type used for calculation : close, open
FREE
Free automatic fibonacci
Tonny Obare
4.67 (49)
Free automatic Fibonacci is an indicator that automatically plots a Fibonacci retracement based on the number of bars you select on the BarsToScan setting in the indicator. The Fibonacci is automatically updated in real time as new highest and lowest values appears amongst the selected bars. You can select which level values to be displayed in the indicator settings. You can also select the color of the levels thus enabling the trader to be able to attach the indicator several times with differe
FREE
Currency Index Project GBP
Simone Guidarini
1 (1)
GBP INDEX The Currency Index Project is ONE part of a thorough Forex study. Many people do not know the theoretical basis that drives currency exchange rates to move on the market. With this set of tools you will be able to have a more complete view of the entire market by analyzing not only the single currency of an exchange, but all the exchange rates that make up that currency by looking at a single window! The indicator faithfully represents the real index of a single currency present in a
FREE
该产品的买家也购买
Neuro Poseidon MT4
Daria Rezueva
4.95 (37)
Neuro Poseidon is a new indicator by Daria Rezueva. It combines precise trading signals with adaptive TP/SL levels - creating best possible trades as a result! Message me and get  Neuro Poseidon Assistant  as a gift to automize your trading process! What makes it stand out? 1. Proven profitability on all assets and timeframes 2. Only confirmed BUY and SELL signals present on the chart 3. Adaptive TP & SL levels generated by the software for each trade 4. Easy to understand - suitable for all
Gann Made Easy
Oleg Rodin
4.84 (165)
Gann Made Easy 是一个专业且易于使用的外汇交易系统,它基于使用先生理论的最佳交易原则。 W.D.江恩。该指标提供准确的买入和卖出信号,包括止损和获利水平。您甚至可以使用推送通知在旅途中进行交易。 购买后请联系我,即可免费获得交易指导和超棒的额外指标! 您可能已经多次听说过江恩交易方法。通常 Gann 的理论不仅对于新手交易者而且对于那些已经有一定交易经验的人来说都是非常复杂的东西。这是因为江恩的交易方法在理论上并不那么容易应用。我花了几年时间来完善这些知识,并将最好的原则应用到我的外汇指标中。 该指标非常易于应用。您所需要的只是将其附加到您的图表并遵循简单的交易建议。该指标不断进行市场分析工作并寻找交易机会。当它检测到一个好的入口点时,它会为您提供一个箭头信号。该指标还显示止损和获利水平。 换句话说,当您像先生一样进行交易时,该指标会为您提供最佳江恩建议。江恩亲自告诉你此时此刻该做什么。但最好的部分是您不需要了解任何有关江恩交易原则的知识,因为该指标会为您完成整个市场分析工作。
Trend Catcher ind
Ramil Minniakhmetov
5 (3)
趨勢捕捉指標 趨勢捕捉指標結合了作者獨有的客製化自適應趨勢分析指標,用於分析市場價格趨勢。它透過過濾掉短期噪音,並專注於潛在的動能強度、波動性擴張和價格結構行為,來識別真實的市場方向。此外,它還結合了平滑和趨勢過濾等客製化指標,例如移動平均線、相對強弱指標 (RSI) 和波動率過濾器。 您可以在這裡查看實際運行情況以及我的其他產品: https://www.mql5.com/en/users/mechanic/seller 請注意,我不會在 Telegram 上出售 EA 或任何設置,那是騙局。所有設定都可以在我的部落格上免費取得。 重要提示!購買後請立即聯繫我,以獲取使用說明和額外獎勵! 請注意,我不會在 Telegram 上出售 EA 或任何設置,那是騙局。所有設定都可以在我的部落格上免費取得。
Dynamic Forex28 Navigator
Bernhard Schweigert
4.43 (7)
Dynamic Forex28 Navigator - 下一代外汇交易工具。 当前 49% 折扣。 Dynamic Forex28 Navigator 是我们长期流行的指标的演变,将三种功能合二为一: 高级货币强度 28 指标 (695 条评论)+ 高级货币 IMPULSE 带警报 (520 条评论)+ CS28 组合信号(奖励)。 有关指标的详细信息 https://www.mql5.com/en/blogs/post/758844 下一代强度指标提供什么? 您喜欢的原始指标的一切,现在通过新功能和更高的精度进行了增强。 主要特点: 专有货币强度公式。  所有时间范围内的平滑和准确的强度线。 非常适合识别趋势和精确进入。 动态市场斐波那契水平(市场斐波那契)。  此指标独有的独特功能。 斐波那契应用于货币强度,而不是价格图表。 适应实时市场活动以获得准确的反转区域。 实时市场动量。  第 9 行显示市场是活跃还是被动。 对于定时交易至关重要。 全面的警报和显示。  每种货币最强的买入和卖出动量。 ​​28 对的双重动量买入和卖出。 超买/超卖警告外部范围和止损。 反转
M1 Sniper
Oleg Rodin
5 (24)
M1 SNIPER 是一款易于使用的交易指标系统。它是一个专为 M1 时间框架设计的箭头指标。该指标可以作为独立的系统在 M1 时间框架下进行剥头皮交易,也可以作为您现有交易系统的一部分使用。虽然该交易系统专为 M1 时间框架交易而设计,但它也可以用于其他时间框架。我最初设计此方法是为了交易 XAUUSD 和 BTCUSD。但我发现这种方法在其他市场交易中也同样有用。 指标信号既可以顺势交易,也可以逆势交易。我教授一种特殊的交易技巧,帮助您利用指标信号进行双向交易。该方法基于使用特殊的动态支撑位和阻力位区域。 购买后,您可以立即下载 M1 SNIPER 箭头指标。此外,我还为所有 M1 SNIPER 工具用户免费提供下方屏幕截图所示的 Apollo Dynamic SR 指标!这两个指标的组合可以帮助您更轻松、更准确地利用 M1 时间框架进行交易。 购买后请联系我,免费获取交易提示和奖励指标! 祝您交易成功!
MetaBands M4
Vahidreza Heidar Gholami
3.5 (6)
MetaBands使用强大且独特的算法绘制通道并检测趋势,以便为交易者提供进出交易的潜在点。它是一个通道指标和强大的趋势指标。它包括不同类型的通道,可以通过使用输入参数简单地合并以创建新通道。MetaBands使用所有类型的警报通知用户市场事件。 功能 支持大多数通道算法 强大的趋势检测算法 能够合并不同类型的通道 多时间帧和多货币(信号矩阵) 所有类型的警报功能(声音、屏幕闪烁、推送通知、电子邮件、弹出窗口、箭头) 它永远不会重绘 趋势检测 MetaBands使用在通道内振荡的蓝色线来检测趋势。当该线遇到通道的上界时,表明开始下跌趋势,当它遇到下界时,表明开始上涨趋势。如果蓝线接近中线,则市场处于整理期。 该指标使用独特的方法来检测趋势。一开始可能看起来有些复杂,但如果您观看视频教程,您就会意识到它是多么强大且易于使用。 入场和出场信号 当趋势变化或价格穿过上下通道时,MetaBands会立即通过不同的方法提醒交易者,这些方法可以在指标设置中启用。 信号矩阵 要监视来自不同时间框架的多个符号并在一个地方查看信号,请单击右上角按钮或按键盘上的M键以打开信号矩阵。该矩阵可以快速概览
Advanced Supply Demand
Bernhard Schweigert
4.91 (300)
现在优惠 30%! 任何新手或专业交易者的最佳解决方案! 该指标是一款独特、高质量、且价格合理的交易工具,因为我们已经整合了许多专有功能和新公式。 依据此更新,您将能够显示双重时间帧区域。 您不仅可以显示一个较高的时间帧,还可以同时显示图表时间帧,加上更高的时间帧:显示嵌套时区。 供需双方所有交易者都会喜欢它。 :) 重要信息披露 高级供需的最大潜力,请访问 https://www.mql5.com/zh/blogs/post/720245   想象您的交易如何得以改善,是因为您能够精准定位入场或目标位吗? 构建于新的底层算法,它可以更轻松地识别出买卖双方之间的潜在失衡。 这是因为它以图形方式展示供需最强劲区域,及其过去的表现(显示旧区域)。 这些功能旨在帮助您更轻松地发现最佳入场区域和价位。 现在您可以针对您的交易品种和时间帧来优化和编辑区域强度! 高级供需指标适用于所有产品和时间帧。 它是一个新的公式,非常新的功能是两个区域强度函数可由用户输入进行调整! 这在交易中是一大优势。 当您学习如何使用专有功能,例如带有价格游离最小 X 因子的区域强度时,您能够判断该区域强劲与否。 供需
Scalper Inside PRO
Alexey Minkov
4.68 (69)
Scalper Inside PRO Scalper Inside PRO 是一款日内趋势与剥头皮指标,采用独家的内置算法来评估市场方向和关键目标位。该指标会自动计算进场点、出场点以及多个止盈目标位,并显示详细的绩效统计数据,让您能够看到不同品种和策略在历史数据上的表现。这有助于您选择符合当前市场状况的交易品种。您还可以将自己的箭头指标连接到 Scalper Inside PRO,并快速查看它们的统计数据和历史信号。 Scalper Inside PRO 使用手册及参数说明: 点击阅读 该指标适用于任何品种和时间周期(日内交易推荐使用 M5),并包含多种内置策略。它既可作为独立的剥头皮工具使用,也可作为您交易系统的分析组件。 主要功能 基于独家的新一代趋势检测算法 Next-Generation Trend Detection Algorithm (NG TDA) 进行趋势识别。 自动计算进场点和出场点,并提供多级止盈目标(TP1、TP2、TP3)。 三种内置策略和一个优化器,用于将信号适配到当前品种和时间周期(仅在实时模式下可用)。 提供品种和策略在历史数据上的详细绩效统计。 提
Genesis Matrix Pro is a professional multi-timeframe trend detection indicator designed to help traders identify high-quality market alignment with clarity and structure. It combines 12 different technical indicators into one visual alignment matrix, allowing traders to quickly see when market conditions are bullish, bearish, or neutral. A signal is generated only when the selected strategies are aligned, helping reduce noise and improve decision-making. PLEASE CONTACT ME AFTER PURCHASE TO GET
Gann 方块指标是一种强大的市场分析工具,基于 W.D. Gann 在其“市场预测数学公式”一文中介绍的数学概念。该指标融合了与平方数(如 144、90 和 52)有关的 Gann 技术,以及平方 9。此外,它还融入了  关于如何将平方 9 与通道和星形图案结合使用的方法。 用户手册和使用方式: 在使用该指标之前,我们建议您阅读用户手册,并与我们联系以获得任何澄清。您可以在我们的网站上找到完整的用户手册。 该指标提供了 MT5 的完整版本供购买,也提供了 MT4 的免费版本供测试。提供了两个版本的链接供您方便使用。 主要特点和功能: Gann 方块指标为您的交易环境提供了全套工具,使您能够基于几何图案和 Gann 的概念做出明智的决策。以下是主要特点: 平方 9 分析: 该指标可以绘制与平方 9 有关的各种元素,包括水平线、星形图案、网格、Gann 扇形等。这在您的图表上提供了 Gann 的几何概念的视觉表示。 Gann 方块: 该指标绘制了 Gann 方块 52、90 和 144,使您能够可视化和分析它们与价格走势的关系。 自由 Gann 星形图案: 该指标使您能够直接在图表上绘制
Breakout Arrows Mt4
Michael Oko Oboh
5 (1)
Trend Breakout Arrows Indicator The Trend Breakout Arrows Indicator is a momentum-based signal tool designed to identify potential bullish and bearish breakout opportunities. It displays clear arrow signals directly on the price chart, helping traders quickly recognize possible trend changes and continuation setups. Up Arrow (Buy Signal) A magenta up arrow appears below a candle when bullish momentum begins to strengthen. This signal indicates that buying pressure may be overtaking selling press
Neo Wave PRO
Nikolay Raykov
5 (1)
Price & Time Market Structure Indicator A professional market structure tool that analyzes waves through both price and time — not price alone. Main Description NeoWave PRO is a professional market structure indicator for MetaTrader 4 designed for traders who want to move beyond traditional one-dimensional wave tools such as ZigZag, swing indicators, and basic high/low systems. Most wave indicators analyze only one thing: Price. But a real market wave is not only a price movement. A true wave de
本产品已针对 2026 年市场进行更新,并针对最新 MT5 版本进行了优化。 价格更新通知: Smart Trend Trading System 目前价格为 $99 。 接下来的 30 次购买 后,价格将上涨至 $199 。 特别优惠: 购买 Smart Trend Trading System 后,请发送私信给我,即可免费领取 Smart Universal EA ,并将您的 Smart Trend 信号转换为自动交易。 Smart Trend Trading System 是一套完整的交易系统,具备不重绘、不回绘、不延迟的特点,专为希望获得更清晰信号、更准确趋势方向以及更有组织交易方式的交易者打造。 Online course , manual and download presets . 它将 10 多种交易工具 整合到一个系统中,包括趋势检测、反转区域、Smart Cloud、移动止损逻辑、支撑与阻力、K线着色、提醒以及多周期分析。 该系统旨在帮助您应对不同的市场环境: 趋势市场: 识别主要趋势,发现回调,跟随动能,并通过止损指导和移动止损选项寻找更清晰的入场机会。 震荡
BTMM State Engine Pro MT4
Garry James Goodchild
BTMM State Engine Pro is a MetaTrader 4 indicator for traders who use the Beat The Market Maker approach: Asian session context, kill zone timing, level progression, peak formation detection, and a multi-pair scanner from a single chart. It combines cycle state logic with a built-in scanner dashboard so you do not need the same tool on many charts at once. What it does Draws the Asian session range; session times can follow broker server offset or be set in inputs. Tracks level progression (L
IQ FX Gann Levels
INTRAQUOTES
5 (2)
IQ FX Gann Levels a precision trading indicator based on W.D. Gann’s square root methods . It plots real-time, non-repainting support and resistance levels to help traders confidently spot intraday and scalping opportunities with high accuracy. William Delbert Gann (W.D. Gann) was an exceptional market analyst, whose trading technique was based on a complex blend of mathematics, geometry, astrology, and ancient mathematics which proved to be extremely accurate. Setup & Guide:  Download  MT5 Ver
PRO Renko System
Oleg Rodin
5 (30)
PRO Renko Arrow Based System for trading renko charts.  准确的信号交易任何外汇工具. 另外,我将免费提供系统的附加模块! PRO Renko系统是RENKO图表上高度准确的交易系统。该系统是通用的。 该交易系统可应用于各种交易工具。 该系统有效地中和了所谓的市场噪音,打开了获得准确反转信号的通道。 该指标易于使用,只有一个参数负责产生信号。 您可以很容易地使算法适应您感兴趣的交易工具和renko酒吧的大小。 我很乐意通过提供任何咨询支持来帮助所有客户有效地使用该指标。 祝您交易成功!购买后,立即写信给我! 我将与您分享我的建议和我的renko发电机。 另外,我将免费提供系统的附加模块!
GOLD Impulse with Alert
Bernhard Schweigert
4.67 (12)
这个指标是我们2个产品 Advanced Currency IMPULSE with ALERT  +   Currency Strength Exotics 的一个超级组合。 它适用于所有时间框架,并以图形方式显示8种主要货币和一种符号的强势或弱势冲动! 该指标专门用于显示任何符号的货币强度加速,如黄金、异国货币对、商品、指数或期货。这是它的第一个指标,任何符号都可以被添加到第9行,以显示黄金、白银、石油、DAX、US30、MXN、TRY、CNH等的真实货币强度加速(冲动或速度)。 建立在新的基础算法上,它使识别和确认潜在的交易更加容易。这是因为它以图形方式显示了一种货币的强势或弱势是否正在加速,并测量了这种加速的速度--把它想象成你汽车中的速度表。当你加速时,事情显然会发生得更快,这在外汇市场上也是一样的,即如果你配对的货币正在向相反的方向加速,你就会发现一个潜在的有利可图的交易。 动态市场斐波那契28水平被用作警报触发器,将适应市场活动。如果冲动击中黄色触发线,你将收到警报。然后你就知道作为一个交易员应该做什么。货币对和方向已经给出。只需点击警报按钮,就可以切换到该货
Advanced Currency Strength28 Indicator
Bernhard Schweigert
4.91 (657)
目前40%的折扣 任何新手或专家交易者的最佳解决方案! 这个指标是一个独特的、高质量的、可负担得起的交易工具,因为我们纳入了一些专有的功能和一个新的公式。只需一个图表,你就可以读出28个外汇对的货币强度!想象一下,你的交易将如何得到改善,因为你的交易是在你的手中进行的。想象一下,你的交易将如何改善,因为你能够准确地确定新趋势或剥头皮机会的触发点? 用户手册:点击这里  https://www.mql5.com/en/blogs/post/697384 这是第一本,原版的! 不要买一个毫无价值的崇拜者的克隆品。 特别的 子窗口中的箭头显示强劲的货币势头GAP将指导你的交易! 当基础货币或报价货币处于超卖/超买区域(外盘斐波那契水平)时,在个人图表的主窗口中出现警告信号。 当货币力量从外围区间回落时,回撤/反转警报。 十字星模式的特别警报 可选择多个时间框架,以快速查看趋势! 货币强度线在所有的时间框架中都非常平稳,当使用较高的时间框架来识别总体趋势,然后使用较短的时间框架来确定精确的入口时,效果非常好。你可以根据自己的意愿选择任何时间框架。每个时间框架都由其自身进行了优化。
The indicator scans for Dinapoli thrust pattern in multiple timeframes for the all markets filtered and shows the results on Dashboard. Key Features Dashboard can be used for all markets It can scan for thrust pattern on MN1, W1, D1, H4, H1, M30, M15 ,M5, M1 timeframes Ability to choose number of bars required above/below displaced moving average to define thrust Parameters UseMarketWatch: Set true to copy all symbols available in market watch MarketWatchCount : Set the number of symbols that
Enigmera
Ivan Stefanov
5 (8)
ENIGMERA: 市场的核心 重要提示:MQL5.com 演示版本在策略测试器中运行,可能无法完全反映 Enigmera 的功能。请查看描述、截图和视频了解详细信息。如有任何问题,请随时联系我! 该指标的代码已完全重写。版本 3.0 增加了新功能并修复了自指标发布以来积累的错误。 简介 这个指标和交易系统是金融市场的一种独特方法。ENIGMERA 使用分形周期来精确计算支撑和阻力水平。它展示了真实的积累阶段,并提供了方向和目标。无论是在趋势中还是在修正中,这个系统都能工作。 它是如何工作的 指标的大部分功能通过图表左侧的按钮控制,使得能够快速响应不同的市场情况。 按钮 ON/OFF – 显示或隐藏整个指标。 Channel – 激活支撑通道,显示可接受的偏差范围。 Dev1 (第一偏差) – 指示价格在支撑偏差内的波动,信号表示市场正在整合或积累力量。 Dev2 (第二偏差) – 显示价格在偏差之间的波动,表示趋势形成和方向。 Dev3 (第三偏差) – 表示趋势的显著加速和高波动性。 45deg (45度) – 显示市场的节奏和相对于 45 度线的运动稳定性。 Tgt1/2
本指标是实践实战交易完善的波浪自动分析的指标 !  案例... 注: 波浪分级用西方叫法不习惯,因受到缠论(缠中说禅)命名方式习惯的影响,我是将基础波浪命名为 笔 ,将二级波段命名为 段 ,同时具有趋势方向的段命名为 主趋段 (以后笔记中都是这种命名方式,先告知大家),但是算法上和缠论关系不大切勿混淆.反映的是本人分析盘面总结的 千变万化纷繁复杂的运行规律 . 对波段进行了标准化定义,不再是不同人不同的浪  ,    对人为干扰的画法进行了排除,在严格分析进场起到了关键的作用 . 使用这个指标,等于将交易界面提升美感,抛弃最原始的K线交易带你进入新的交易层次.如果不是为了交易,在宣传上也将使客户观感提升层次. 指标内容: 1. 基础波浪 (笔) : 首先我们找出了价格波动过程中的基础波动拐点,当然他的有序性低,为下一步的计算提供基础. 2. 二级波段( 段 ) :在基础波浪的基础上,通过算法分析得到层级更明显的二级波段,二级波段为波浪提供了分析基础 3. 波浪( 浪 ): 有着更清晰的趋势,更清晰直观的方向.分析一个波浪是否延续,需要看二级波段的形态,分析二级的构成,可以得出波浪
Harmonic Pattern Plus MT4
Young Ho Seo
4.44 (18)
Introduction Harmonic Patterns are best used to predict potential turning point. Traditionally, Harmonic Pattern was identified manually connecting peaks and troughs points in the chart. Manual harmonic pattern detection is painfully tedious and not suitable for everyone. You are often exposed under subjective pattern identification with manual pattern detection. To avoid these limitations, Harmonic Pattern Plus was designed to automate your harmonic pattern detection process. The functionality
Current event:  https://c.mql5.com/1/326/A2SR2025_NoMusic.gif A. 什么是 A2SR ?   * 这是一个领先的技术指标(没有重绘,没有滞后)。  -  指导 : -- 在  https://www.mql5.com/en/blogs/post/734748/page4#comment_16532516 -- 和  https://www.mql5.com/en/users/yohana/blog A2SR 在确定支撑(需求)和阻力(供应)水平方面有一种特殊的技术。 与我们在网上看到的普通方式不同,A2SR 在确定实际 SR 级别时有一个独创的概念。 原技术不是从网上拿来的,也没有在网上公开过。 A2SR 将根据您的交易风格自动选择 SR 级别。 即使您正在更改时间范围,但 SR 级别仍将保留在其位置上。 因为实际的 SR 不是从你使用的时间范围内获得的。 A2SR 拥有完整的交易工具 。 实际支持(需求)和阻力(供应)的真正概念。 新闻事件和央行讲话的市场情绪。 新闻事件和趋势的主要货币强度 (MCS) 的真正概念
KT Alpha Hunter Arrows MT4
KEENBASE SOFTWARE SOLUTIONS
大多数箭头指标只给你一个信号,然后把剩下的判断全部留给你自己。KT Alpha Hunter Arrows 给你的,是一套完整的交易计划。 每一个信号箭头出现时,图表上都会同时绘制完整计划:入场线、止损位、四个止盈目标,以及实时 Edge 结论,告诉你当前品种和时间周期是否值得交易。套装中还包含 Trade Manager EA,在你手动入场后负责后续执行,让你在市场波动和情绪干扰下依然保持纪律。非重绘。只在K线收盘后给出信号。适用于 Forex、黄金、指数,以及你交易的其他任何品种。 核心功能 非重绘买入和卖出箭头,只在K线收盘后出现。 每个信号都带有入场线、结构性止损和四个止盈目标。 Edge Dashboard 会分别评估当前图表上的买入和卖出机会。 结论系统:No Edge、Marginal、Tradeable、Good 或 Strong。 一键 Auto Optimize 按钮,可根据当前品种和时间周期自动调整设置。 完整套装包含 Trade Manager EA,并内置五种专为本指标设计的交易管理方案。 Prop Firm Risk Panel 可在图表上实时追踪日内回撤
Market Structure Patterns MT4
Samuel Manoel De Souza
5 (18)
Market Structure Patterns   is an indicator based on   smart money concepts   that displays   SMC/ICT   elements that can take your trading decisions to the next level. Take advantage of the   alerts ,   push notifications   and   email messages   to keep informed from when an element is formed on the chart, the price crosses a level and/or enters in a box/zone. Developers can access the values of the elements of the indicator using the   global variables  what allows the automation of trading d
PZ ABCD Retracement
PZ TRADING SLU
4 (5)
该指标找到AB = CD回撤形态。 AB = CD回调模式是一种4点价格结构,其中初始价格区间被部分回调,然后与回调完成后等距移动,这是所有谐波模式的基本基础。 [ 安装指南 | 更新指南 | 故障排除 | 常见问题 | 所有产品 ] 可定制的图案尺寸 可定制的AC和BD比率 可定制的突破时间 可定制的线条,颜色和大小 它根据CD纤维水平显示SL和TP水平 视觉/声音/推送/邮件警报,用于模式和突破 AB = CD Retracements可以扩展和重新绘制很多内容。为了使事情变得更容易,该指标实施了一个转折:它在向交易发出信号之前等待正确方向的Donchian突破。最终结果是带有非常可靠的交易信号的重新粉刷指示器。输入donchian突破时段作为输入。 看涨回撤是蓝色的 空头回撤是红色的 请注意,价格模式(例如AB = CD)可以扩展,指标必须重新绘制以跟随该模式的扩展。如果图案重涂超出了参数中输入的AC / BD / AB = CD比率,则该图案将消失,因为它将不再有效。要交易这些模式,请求助于donchian突破信号。 输入参数 幅度:AB = CD模式的大小 突围
Trend Lines PRO
Roman Podpora
5 (1)
TREND LINES PRO 帮助您了解市场真正的方向转变点。该指标显示真实的趋势反转点以及主要参与者重新入场的时机。 您可以看到 BOS线、 趋势变化和更高时间框架的关键水平——无需复杂的设置或不必要的干扰。信号不会重绘,并在K线收盘后仍然保留在图表上。 VERSION MT 5    -   与……搭配使用时,可发挥其最大潜力   RFI LEVELS PRO 指示器 该指标显示的内容: 实际变化 趋势(BOS 线) 一旦信号出现,它就始终有效!这与会重绘的指标有着重要的区别,后者可能会发出信号后又改变信号,从而导致资金损失。现在,您可以更精准、更准确地进入市场。此外,还有一个功能,会在箭头出现后为K线着色,直到达到目标价位(止盈)或出现反转信号为止。 重复条目   以及主要玩家的充值 为了提高寻找入场点时的视觉清晰度,我们创建了一个模块,该模块首先显示买入/卖出区域,并在该区域内寻找最佳入场点。此外,我们还加入了智能逻辑来管理止损位,该逻辑会随着时间的推移逐步降低止损位的大小,从而降低入场交易时的初始风险(移动止损位)。 信号强度水平(BOS) 该指标采用三个显著性等级来衡量
The Propfolio Master Suite is the ultimate all-in-one analytical workstation for professional traders. Combining the power of the Beat The Market Maker (BTMM) methodology, Smart Money Concepts (SND/Liquidity), and Advanced Volume Profile, this suite replaces multiple different indicators with one optimized engine. Monitor up to 14 pairs simultaneously from a single chart, instantly identify market cycles, and seamlessly map institutional footprints with the click of a button. The Command Center
Legacy of Gann
Pavel Zamoshnikov
4.83 (12)
The indicator very accurately determines the levels of the possible end of the trend and profit fixing. The method of determining levels is based on the ideas of W.D.Gann, using an algorithm developed by his follower Kirill Borovsky. Extremely high reliability of reaching levels (according to K. Borovsky  - 80-90%) Indispensable for any trading strategy – every trader needs to determine the exit point from the market! Precisely determines targets on any timeframes and any instruments (forex, met
RFI levels PRO
Roman Podpora
5 (1)
该指标能够准确显示反转点和价格回落区域。     行业领军人物 。您能洞察新趋势的形成,并以最高的精准度做出决策,掌控每一笔交易。 与……结合时,展现其最大潜力     趋势线专业版   指标  VERSION MT5 该指标显示的内容: 新趋势开始时的反转结构和反转水平及其激活。 显示屏   获利了结   和   止损   风险回报比最低的水平     RR 1:2       。 具有智能减值逻辑的止损。 显示指定指标中两种趋势类型的反转形态。 指标: 根据     趋势线     (全球趋势变化) 潮流专业版     (趋势快速变化) 简单有效   扫描器   实时趋势(新增)。 多时间框架工具筛选。 展示   利润   在 LOGIC AI 信号之后。 以下列出今日走势积极的金融工具。(RB键) 能够为终端启用通知(警报)功能,并向移动设备推送通知。 逻辑人工智能     — 利用人工智能寻找最佳切入点。 只有在启用 MTF(多时间框架分析)模式时,该功能才可用。 兼容性。 当与趋势线指标结合使用时,该指标能发挥其最大潜力。 这     RFI LEVELS PRO    
作者的更多信息
Price Velocity
Oleg Pechenezhskiy
5 (2)
The indicator calculates the average price velocity over the specified time period. It is known that the trading time flows unevenly, in bursts. It either goes faster, or slows down. This indicator will tell if the trading time has accelerated and it is necessary to go to the smaller timeframes to search for trade signals. Usage Alert is generated when the price velocity exceeds the specified threshold. The threshold value can be modified using the buttons on the information panel. A .wav file
FREE
This utility allows you to check and improve your binary options trading skills. This is an indicator, not an Expert Advisor. Therefore, you do not need to remove your active EA from the chart. Inputs Expiry, min - option expiration time; InfoPanel background color - info panel background color; InfoPanel text color - info panel text color; InfoPanel text fontsize - info panel font size.
FREE
Индикатор выводит первые производные двух MACD. По умолчанию, желтая MACD является более быстрой, чем синяя MACD. В настройках можно задать подходящие вам параметры для каждой из MACD. Одновременное изменение знака производных может являться дополнительным сигналом разворота. Входные параметры Yellow MACD fast EMA period Yellow MACD slow EMA period Blue MACD fast EMA period Blue MACD slow EMA period
FREE
Pairs Trade
Oleg Pechenezhskiy
The Pairs Trade indicator is a utility for semi-automatic pair trading. It allows combining the charts of two arbitrary instruments, even if the schedules of their trading sessions are different. It displays a spread chart in the form of a histogram with an overlaying moving average. It calculates the swap that will be charged for the synthetic position (in the deposit currency). It is possible to set a level for automatic opening of a synthetic position on the spread chart (analogous to the 'se
Aggregate Position
Oleg Pechenezhskiy
This indicator calculates the aggregate position of all long positions and the aggregate position of all short positions on the current symbol. The aggregate position is displayed on the chart as a horizontal line. When the line is hovered, a tooltip with the volume of the aggregate position appears. If the total number of positions in the terminal changes, the aggregate position is recalculated. Input parameters BuyLine color - line color of the aggregate long position; BuyLine width - line wi
Trading Lines
Oleg Pechenezhskiy
This utility is an Expert Advisor for semi-automatic trading within a price channel. It enters the market when the price crosses the channel boundary. Trend lines with a special type of description should mark the boundaries of the price channel. Trader is responsible for creating and aligning such trade lines on the required chart. The lines should be placed according to the same rules the "buy limit" and "sell limit" pending orders are placed. A trend line with a description of type "buy x" (w
Colored Channels
Oleg Pechenezhskiy
This program is for traders who plot price channels on charts. You just need to specify the width of the channel in the description of the trend line. Enter the "Description" field in the trend line properties and type  canal: xxxxx  without a space, where xxxxx is the width of the channel in pips. Channel color is set automatically depending on the channel width. The middle line of the channel is also automatically drawn. If the channel width is set to a positive number, the channel is drawn ab
С этим драйвером вы можете превратить трендовую линию в линию Ганна, поместив значение угла в виде NxM в ее описании, например 4x1, где N - это количество поинтов, а M - количество таймфреймов на текущем графике. Драйвер автоматически отображает значение угла в виде метки у правого конца линии. По умолчанию, размер поинта равен размеру пипса, но в настройках вы можете сами указать подходящий вам размер поинта. Вы можете комбинировать этот индикатор с индикатором  Colored Channels , разделяя проб
Profit Meter
Oleg Pechenezhskiy
5 (1)
Эта утилита поможет вам рассчитать прибыль в валюте депозита, если цена пройдет от своего текущего значения к значению, указанному горизонтальной линией ProfitMeter. При запуске индикатора эта линия автоматически создается на уровне текущего значения цены. Линию следует выбрать и переместить на нужный вам уровень. Расчетное значение прибыли при входе в рынок минимально возможным лотом отображается в правом нижнем углу окна графика. Входные параметры Style of ProfitMeter Color of ProfitMeter Widt
Quantized Trend
Oleg Pechenezhskiy
This utility automatically draws the trend channel on the price chart. For the time interval from the specified date to the current bar, the drawn channel is almost optimal. Placing the beginning of the channel at a more distant historical price extremum, you get a visualization of a longer-term trend. Channel slope is not a continuous value, but takes one of discrete values (in AxB format, where A is the number of price points (points), and B is the number of timeframes). This program works ONL
筛选:
无评论
回复评论