Gartley Harmonic lim

Gartley Harmonic Free 

Introduzione

Benvenuti al Gartley Harmonic Free  , lo strumento definitivo per il trading armonico su MetaTrader 4. Questo indicatore è progettato per identificare automaticamente il classico pattern Gartley (sia rialzista che ribassista) in tempo reale con estrema precisione.

Che siate trader esperti o principianti, questo strumento vi aiuta ad individuare istantaneamente le Zone di Potenziale Inversione (PRZ) ad alta probabilità, eliminando la necessità di complessi disegni manuali sui grafici.

Come funziona

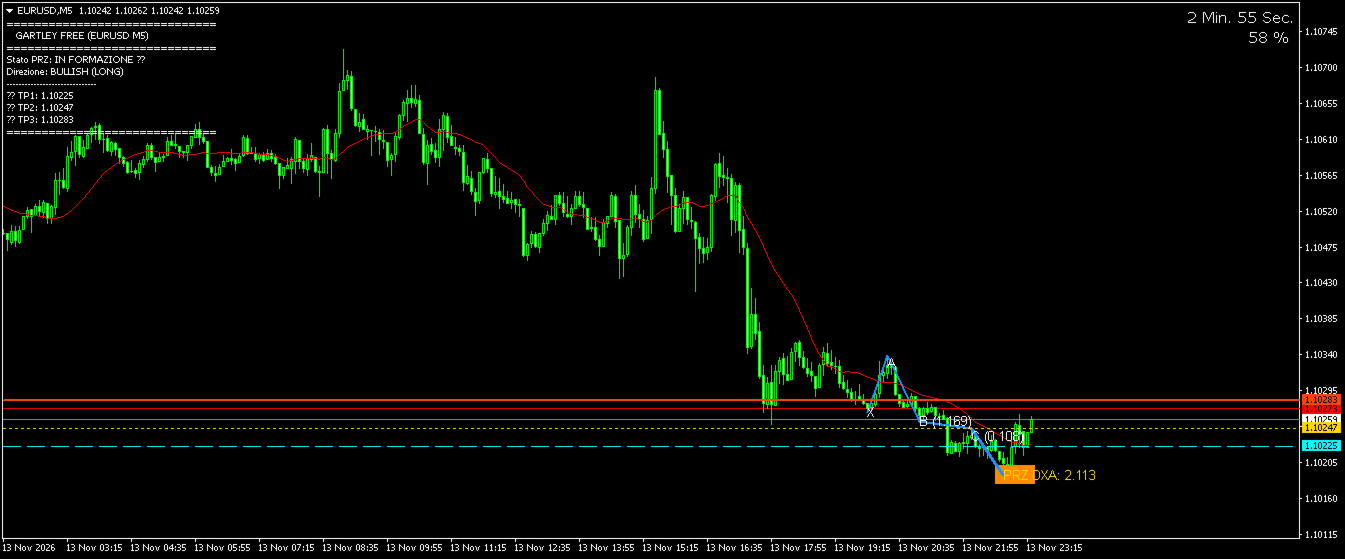
L'indicatore analizza continuamente l'andamento dei prezzi utilizzando un algoritmo ZigZag sottostante per individuare i punti pivot strutturali. Una volta individuata una struttura valida che rispettivi i classici rapporti aurei di Fibonacci del pattern Gartley, traccia automaticamente le gambe armoniche XABCD sul grafico.

Caratteristiche principali

  • Riconoscimento automatico del modello: niente più disegni manuali. L'indicatore individua automaticamente i punti X, A, B, C e D.

  • Evidenziazione della PRZ: un riquadro arancione evidenzia la Zona di Potenziale Inversione (Punto D) in cui si prevede un'inversione del mercato.

  • Livelli di Take Profit dinamici: traccia automaticamente tre linee di Take Profit (TP1, TP2, TP3) calcolate tramite estensioni CD di Fibonacci.

  • Rapporti di Fibonacci sullo schermo: visualizza le percentuali di ritracciamento chiave (ad esempio, AB = 61,8% di XA) direttamente sui lati del modello per una rapida verifica visiva.

  • Sistema di allerta PRZ: non perdere mai un'opportunità di trading. L'indicatore attiva un avviso a schermo e, facoltativamente, una notifica push sul cellulare non appena il prezzo entra nella zona PRZ.

  • Pannello informativo chiaro: un'elegante casella di commento in alto a sinistra mostra lo stato del pattern (Valido / In formazione), la direzione (Lungo / Corto) ei prezzi Take Profit esatti.

Confronto tra razze

Caratteristica Versione GRATUITA Versione PRO (completa)
Simboli / Risorse Solo EURUSD TUTTO (Forex, Indici, Criptovalute, Azioni)
Tempistiche Solo M5 TUTTI (M1, M15, H1, D1, ecc.)
quantificazione Gartley ✅ Sì ✅ Sì
Casella di zona PRZ ✅ Sì ✅ Sì
Livelli di Take Profit ✅ Sì ✅ Sì
Avvisi sullo schermo ✅ Sì ✅ Sì
Notifiche push per dispositivi mobili ✅ Sì ✅ Sì

Istruzioni di installazione

  1. Scarica il file .ex4 dell'indicatore.

  2. Apri MetaTrader 4 e vai a File -> Apri cartella dati .

  3. Vai a MQL5 -> Indicators .

  4. Incolla il file dell'indicatore in questa cartella.

  5. Riavvia MetaTrader 4 oppure fai clic con il pulsante destro del mouse sull'elenco "Indicatori" nella finestra Navigatore e seleziona "Aggiorna".

  6. Trascina e rilascia l'indicatore sul grafico.

Nota importante per gli utenti della versione GRATUITA: l'indicatore verrà caricato solo se il grafico è impostato esclusivamente su EURUSD con timeframe M5 (5 minuti) . Se applicato a qualsiasi altra risorsa o intervallo di tempo, l'esecuzione verrà bloccata e verrà visualizzato un avviso.

Design degli uffici

  • Barra di pivot sinistra/destra: impostazioni di sensibilità per il motore di rilevamento del pivot ZigZag. I valori predefiniti (5,5) sono standard per i pattern armonici.

  • Mostra i rapporti di Fibonacci: abilita o disabilita le etichette dei rapporti sulle gambe del modello.

  • Evidenzia la casella PRZ: attiva/disattiva il rettangolo arancione della zona di inversione.

  • Estensioni Take Profit: Regola i rapporti moltiplicatori per TP1, TP2 e TP3 (ad esempio, 0,618, 1,000, 1,618).

  • Avvisi e notifiche push: attiva o disattiva gli avvisi sonori e le notifiche per dispositivi mobili.

推荐产品
Multi Timeframe ZigZag Indicator
Salman A A A T Bakhash
5 (2)
Description: This indicator draw ZigZag Line in multiple time frame also search for Harmonic patterns before completion of the pattern. Features: Five instances of ZigZag indicators can be configured to any desired timeframe and inputs. Draw Harmonic pattern before pattern completion. Display Fibonacci retracement ratios. Configurable Fibonacci retracement ratios. Draw AB=CD based on Fibonacci retracement you define. You can define margin of error allowed in Harmonic or Fibonacci calculations
FREE
PZ Penta O MT4
PZ TRADING SLU
2.33 (3)
The Penta-O is a 6-point retracement harmonacci pattern which usually precedes big market movements. Penta-O patterns can expand and repaint quite a bit. To make things easier this indicator implements a twist: it waits for a donchian breakout in the right direction before signaling the trade. The end result is an otherwise repainting indicator with a very reliable trading signal. The donchian breakout period is entered as an input. [ Installation Guide | Update Guide | Troubleshooting | FAQ | A
FREE
Bitcoin 999
Ahmed Ragab Ramadan Abdelfattah
Bitcoin 999  - is a trend indicator that automatically analyzes the market and provides information about the trend and each of its changes, as well as giving signals for entering trades without redrawing! The indicator uses each candle, analyzing them separately. referring to different impulses - up or down impulse. Exact entry points into transactions for currencies, crypto, metals, stocks, indices!  Main functions: Accurate entry signals WITHOUT REPAINTING! Once a signal appears, it remains
FREE
Major Support and Resistance Indicator
Ahmad Ar Abedalaziz Alazaizeh
This indicator filters the Zigzag indicator to calculate the main support and resistance levels. Variables minimum gap between peaks : is the distance (GAP) between the peaks of the Zigzag peaks sensitivity : Minimum number of nearby peaks look back: it means that it has to test the last 50 peaks in the Zigzag object name perfix: a prefix for level’s line name on chart
FREE
Pivot Pro MT4
Samil Bozuyuk
5 (3)
Draws Daily, Weekly and Monthly pivots and the respective supports and resistances levels (S1, S2, S3, R1, R2, R3). Ideal for placing stop losses and/or using as a break-out strategy. Features Unlike other pivot indicators in market you get very clean charts. Pivot levels are plotted irrespective of timeframe, on which you trade, i.e. M1, M5, M15, M30, H1,H4 or Daily timeframes. Pivot levels do not change when you change timeframe. Fully customizable options.    If you are looking at Fibonacci
FREE
SMC Structure Gap Monitor 是一款用于 MetaTrader 4 的指标,专门用于显示 SMC 风格的市场结构, 重点关注 BOS、CHoCH、摆动结构点以及 Fair Value Gaps。 核心思路: 该指标通过 HH、HL、LH、LL 结构标签,结合完整与不完整 FVG、可选内部结构以及可供 Data Window 和 Expert Advisor 读取的缓冲区,帮助交易者更清晰地理解结构流动。 快速概览 产品类型 MetaTrader 4 指标 主要用途 结构流、BOS、CHoCH 与 Fair Value Gap 监控 使用方式 主观图表分析、复盘,以及供 EA 读取缓冲区 周期选项 可配置结构分析周期与 FVG 检测周期 外部 DLL 不需要 主要功能 标记 HH 、 HL 、 LH 和 LL 摆动结构。 在图表上高亮显示 BOS 和 CHoCH 事件。 可显示内部结构,便于更细致地分析。 显示价格尚未触及的 完整 FVG 。 显示价格已触及但尚未完全回补的 不完整 FVG 。 包含可选的 swing Order Blocks。 支持配置分析周期和
FREE
Best SAR
Ashkan Hazegh Nikrou
5 (3)
加入  考拉交易解决方案频道  在MQL5社群中,获取有关所有考拉产品的最新信号和新闻,加入链接如下: https://www.mql5.com/en/channels/koalatradingsolution 描述 :  我们很高兴推出基于外汇市场 (PSAR) 中专业和流行指标之一的新免费指标 该指标是对原始抛物线 SAR 指标的新修改,在专业 SAR 指标中,您可以看到点和价格图表之间的交叉,这交叉不是信号,而是谈论运动结束的可能性,您可以从新的蓝点开始买入,并在第一个蓝点之前设置止损,最后您可以在点交叉价格图表时退出。 如何打开买入或卖出信号? 通过第一个蓝点打开买入交易并通过第一个红点打开卖出交易 正确的止损在哪里? 安全止损可以在第一个点上,(在第一个蓝点的买入情况下和在第一个红点的卖出情况下) 正确的止盈在哪里? 止盈可以根据止损距离和RR进行调整,所以我的建议是2 RR,是止损的2倍 如果我们盈利但仍未达到 tp,那么退出点在哪里? 第一个退出警报可以在点和价格图表之间交叉。 该指标何时释放警报? 一旦新的点出现在新的方向,指标就会释放警报 我们如何
FREE
Harmonic Signal Alerts MT4 is a free indicator for MetaTrader 4 that finds ABCD, Gartley and Bat patterns on the chart. When price reaches a pattern's potential reversal zone, it draws the XABCD lines, the zone and an arrow. It can also alert you. It works only from swings that are already confirmed and from closed bars. A pattern is drawn on the bar where it became known. It is never moved or removed afterwards. MetaTrader 4 edition: the same calculation and the same arrows as the MetaTrader 5
FREE
Donchian Trend Histogram
Mariusz Piotr Rodacki
Donchian channels are a tool in technical analysis used to determine the relative volatility of a market and the potential for price breakouts. Can help identify potential breakouts and reversals in price, which are the moments when traders are called on to make strategic decisions. These strategies can help you capitalize on price trends while having pre-defined entry and exit points to secure gains or limit losses. Using the Donchian channel can thus be part of a disciplined approach to managi
FREE
Variable Index Dynamic Average (VIDYA) is an original method of calculating the Exponential Moving Average (EMA) with the dynamically changing period of averaging, developed by Tushar Chande. The length of period in VIDYA depends on market volatility as indicated by the Chande Momentum Oscillator (CMO). Typical Signals VIDYA generates buy and sell signals when the price crosses over and under the bands: When the price crosses over the upper band of VIDYA, this can be interpreted as a signal to
FREE
Strength Graph
Zi Feng Ding
5 (1)
这个指标可以用来衡量主要货币的相对强弱。在设定的时间周期内,相对较强的货币分值较高,相对较弱的货币分值较低。 指标的设置选项 Strength Period - 更改Strength Period(力度计算周期)会影响到计算的蜡烛数量,从而影响计算结果。较高的值让指标表示的线条较为平滑,而且指标的结果会表现出各个货币更长时间里的相对强度,而不是最近的强度。 Display Options - 设置视觉呈现的偏好(show strength/weakness/kebab) "show strength" 模式,越强的货币分值越高,最弱的货币是0分。 "show weakness" 模式,越弱的货币分值越低,最强的货币是0分。 "show kebab"模式,越强的货币分值越高,平均强度分值为50分。 参照这个指标,你不仅可以用它交易主要货币对,也可以用来交易各种不同的交叉对。 基本上扫一眼能大略看懂目前各种货币的相对强弱。 如果指标没有正确载入,可以多次切换不同周期来刷新。 默认状态下指标的固定最大值和最小值是可以更改的。可以根据喜好改变指标里每种货币表示的线型和颜色。
FREE
免费 — ZigZag 摆动枢轴点加上移动平均趋势过滤器,绘制在同一图表上。它显示枢轴突破系统所依据的枢轴水平和趋势背景。针对黄金(XAUUSD)调校。 完全免费,无任何限制。如果它在您的图表上派上用场,一条简短的评价对我们帮助最大——只需30秒,这也是其他交易者发现这款工具的唯一途径。 平台: MetaTrader 4(本页面)。 枢轴突破只有在顺应更大趋势的方向时才有意义。本指标标记每一个确认的摆动枢轴,并绘制一条趋势移动平均线,让你一眼就能看出上一个枢轴的突破是顺势还是逆势。 === 它绘制什么 === - 已确认的 ZigZag 摆动高点和低点(圆点)——突破系统所响应的枢轴。 - 趋势移动平均线(默认 MA 50)。 === 已确认枢轴不重绘 === 只有当一个枢轴被确认为其窗口内的局部极值后才会绘制出来。已确认的枢轴不会移动。(与所有 ZigZag 一样,最近仍在形成的那一段是临时的,直到出现新的极值加以确认——这是摆动检测的固有特性,而非缺陷。) === 设置 === - ZZDepth(默认 12)、ZZDev(默认 5)、ZZBackstep(默认 3):
FREE
RelicusRoad Trading Sessions 是适用于 MetaTrader 4 和 MetaTrader 5 的交易时段指标,在 M1、M5 与 M15 图表上以垂直点线标出东京、伦敦与纽约时段的开盘时间。 每个时段的开盘都以一条线、一个旋转显示的小名称标签,以及一个事件标记来呈现,颜色为该时段自己的颜色,覆盖当前交易日与此前的若干工作日。将鼠标悬停在其上会显示时段名称与开盘时间。本指标只标记开盘:不会填充时段区间、重叠或收盘时间。 工作原理 指标加载时会读取经纪商服务器时间与 UTC 之间的差值,四舍五入到整小时,再减去一小时。随后它会把东京开盘设在 UTC 23:00、伦敦开盘设在 UTC 07:00、纽约开盘设在 UTC 12:00,换算为服务器时间,并从当前 UTC 日期向前逐个工作日标出。周六与周日会被跳过。 Tokyo:默认橙色,位于 UTC 23:00,即东京时间 08:00。 London:默认绿色,位于 UTC 07:00,即夏令时下的伦敦开盘时间。 New York:默认红色,位于 UTC 12:00,即夏令时下的纽约开盘时间。 指标不做夏令时调整。这
FREE
Daily Range Forecast 显示今天的波动幅度大概有多大、其中已经走完了多少,以及当天超过哪两个价格就比平常更大。在黄金上,它使用在黄金历史上经过测试的内置模型;在任何其他图表上,它会按该品种自身的历史进行拟合。 显示内容 图表上今天的区间带:从今天的最高价减去可能幅度,到今天的最低价加上该幅度。它只在创出新高或新低时收窄;越过任一边缘,当天就比平常大。可能幅度在当天第一根K线时确定,全天不变。 历史:最多 120 个过去的交易日,以柔和的区间带显示在K线后面;当天保持在其幅度之内为绿色,超出时为琥珀色。没有箭头,也没有文字标签。 一个小面板:今天的可能幅度,以美元(货币对为点数 pips)和百分比表示,一条显示已走完多少的进度条,以及两个价格。 黄金的美国数据发布日(CPI、非农就业、美联储决议):面板注明当天、倒计时到发布时间,并上调幅度。 Markets:一个小按钮可打开表格,以您经纪商的名称显示 7 个主要外汇货币对、US30、US500、US100 和 BTCUSD 今天的可能幅度和已走完的比例,还可加入您自己的品种(标注为未经测试),按最"新鲜"的排在前面。
FREE
RSI Bands MT4
Pierce Vallieres
RSI Bands is a powerful indicator which displays an upper and lower band corresponding to the RSI overbought and oversold levels. The band shows what price must be reached during that specific candle in order for the RSI overbought/oversold level to be reached. This is an extremely useful tool for spotting when a trend has begun and when a trend is about to end. The indicator provides buffers, allowing you to use it in your own Expert Advisor. Please message me if you have any questions. CURREN
FREE
The XR Gartley Pattern MT4 is an indicator which displays and alerts Gartley pattern detected on the candlestick chart. It also displays potential trade with calculated Take Profit and Stop Loss, Timeframe H1. After purchasing XR Gartley Pattern, you can immediately download this indicator from the MT4-MT5 Market and start using it because all features are set to default, is not necessary to change any parameter. List of all our available tools for Traders:   https://www.mql5.com/en/users/mqlblu
FREE
Price Deviation
Mikhail Pisarev
A very simple and intuitive indicator that shows the deviations from the moving average in percent. The default is a 50-day moving average. Just throw on the chart and the indicator build in a separate window under the graph. This can be very convenient if your strategy implies a certain deviation in percentage of the moving average. It is not very convenient to calculate it manually. The method of averaging, the period of the moving average and at what prices to build all this is selected in t
FREE
Trend Finding Channels
Muhammed Emin Ugur
4 (1)
The   Trend Finding Channels   indicator was developed to help you determine the trend direction by drawing channels on the graphical screen. It draws all channels that can be trending autonomously. It helps you determine the direction of your trend. This indicator makes it easy for you to implement your strategies. The indicator has Down trend lines and Up trend lines. You can determine the price direction according to the multiplicity of the trend lines. For example , if the Down trend lines s
FREE
The indicator uses the Chester W. Keltner's channel calculation method, modified by the well-known trader Linda Raschke. Due to the modification, the calculated channel contains a much more complete overview of the price movements, which allows increasing the probability of an accurate prediction of the upcoming price movement. Unlike the classic Keltner method, the base line of the channel is plotted based on the Exponential Moving Average, and the Average True Range is used to calculate the up
FREE
MT4 DeThrust StatsMood
Salvatore Colombo
5 (2)
DeThrust StatsMood — Impulse Exhaustion Detector for D1 DeThrust StatsMood is a MetaTrader 4 indicator optimized for the Daily (D1) timeframe, designed to identify potential exhaustion points following exceptionally strong directional moves in the Forex market. How it works The indicator detects when price experiences a statistically abnormal acceleration compared to the symbol’s historical behavior and signals the potential exhaustion of that impulse. This is not a conventional trend reversal i
FREE
AI Channels MT4
Duc Hoan Nguyen
5 (1)
免费获取我所有的 MT4 和 MT5 指标 — 点击这里了解方法 新工具   售价   $30   限于   首周   或   前 3 次购买 !  MQL5 Trading Tools 频道 : 加入我的 MQL5 频道,获取我的最新动态 AI Channels 指标利用 滚动K均值聚类 ——一种在聚类分析中强大的机器学习技术——实时提供基础价格趋势的见解。该指标根据聚类价格数据创建自适应通道,使交易者能够做出有关趋势方向和市场状况的明智决策。 该指标还包括一个 跟踪止损选项 ,提供了更灵活的风险管理方法。 查看更多MT5版本: AI Channels MT5 查看更多产品:     所有产品 如何使用AI Channels指标 每个通道的极端值为确定趋势方向提供了宝贵的见解: 上通道极端值: 价格突破此水平可能表明上升趋势。 下通道极端值: 价格跌破此水平可能表明下降趋势。 调整 窗口大小 (用于聚类的最近价格范围)可以提供高值的长期视角或低值的短期视角。 通过“群集”设置调整聚类 群集 设置允许用户控制价格突破通道极端值的难易程度。较高的群集值将极端值放置得远离价格,反映出更
FREE
We Trade Live Trend Levels
Ian Andrew Nicholson
5 (1)
We Trade Live Trend Levels  This indicator is a fantastic addition to the We Trade Live Trend Max this helps filter out noise and helps with better entries into a trade this add on is a must have and we use it all the time along side We Trade Live Trend Max this is a fantastic tool to help with entering a trade and exiting a trade,  This indicator Calculates  Volume strength  indicating levels of support and resistance for a trade, measures momentum in a market making buying or selling into the
FREE
即使是经验丰富的交易者,也可能错过高质量的背离信号。True RSI Divergence 能够自动检测新的背离,并第一时间发出通知,同时更加关注信号质量,而不是单纯增加信号数量。 RSI 背离是技术分析中最常用的信号之一,广泛用于识别潜在的趋势反转和趋势延续机会。然而,同时手动监控多个交易品种和多个时间周期几乎是不可能的。当您正在分析一个图表时,另一个图表上可能已经形成了一个高质量的背离信号。 True RSI Divergence 持续扫描市场,并在检测到新的背离时自动发送通知。即使您不在交易终端前,也不会错过重要的交易机会。 然而,只有当检测到的信号真正值得关注时,及时的通知才具有实际价值。 许多背离指标几乎会连接所有局部高点和低点,从而产生大量质量较低、意义不大的信号。结果不仅图表充满了各种连线,频繁的提醒也让真正值得关注的交易机会淹没在市场噪音之中。 True RSI Divergence 采用了不同的方法。 该指标首先识别具有实际意义的市场摆动高点和低点,然后才分析价格与 RSI 之间是否存在背离。这样的设计能够显著减少弱信号和低质量背离,仅保留更符合真实市场结构的重要信号
FREE
MT4 Squeeze detector FREE
Grzegorz Korycki
4.5 (4)
什么是挤压? 在肯特纳通道内,若布林带收缩,反映了行情正在调整和巩固,且通常被视作后续定向行情或大的振荡行情的潜在领先指标。当布林通道离开肯特纳通道,这意味着行情从低波动切换至高波,这是所有交易者都在寻找的。 差异 免费版挤压 挤压 挤压专业版 有多少不同时间帧 1 5 10 定制每个时间帧的 KC 和 BB 设置 - NO YES 激活数量 - 5 12 手机提醒 1 个,限制到 4 小时 YES YES
FREE
HZZ
Nikolay Likhovid
3.5 (2)
这是一款快速,非重绘的之字折线; 它支持从当前极值,以指定距离突破价位后切换线段。MinBars 参数设置指标绘制的历史深度; 0 意为绘制整个历史。SaveData 参数允许将极值写入一个文件 (时间为 datatime 格式以及价格)。 一些基本之字折线统计计算按照注释形式显示。
FREE
KeltnerChannelIndicator
Todd Terence Bates
3 (2)
The Keltner Channel is a volatility-based technical indicator composed of three separate lines. The middle line is an exponential moving average (EMA) of the price. Additional lines are placed above and below the EMA. The upper band is typically set two times the Average True Range (ATR) above the EMA, and the lower band is typically set two times the ATR below the EMA. The bands expand and contract as volatility (measured by ATR) expands and contracts. Since most price action will be encompasse
FREE
Extremum Reverse Bar
Yurij Izyumov
2.8 (5)
This indicator has been created for finding the probable reversal points of the symbol price. A small candlestick reversal pattern is used it its operation in conjunction with a filter of extremums. The indicator is not redrawn! If the extremum filter is disabled, the indicator shows all points that have a pattern. If the extremum filter is enabled, the condition works – if the history Previous bars 1 candles back contains higher candles and they are farther than the Previous bars 2 candle, such
FREE
Head and Shoulders Pattern Indicator - Your Key to Recognizing Trend Reversals Unlock the power of pattern recognition with the "Head and Shoulders Pattern Indicator." This cutting-edge tool, designed for MetaTrader, is your trusted ally in identifying one of the most powerful chart patterns in technical analysis. Whether you're a novice or an experienced trader, this indicator simplifies the process of spotting the Head and Shoulders pattern, allowing you to make informed trading decisions. Key
FREE
OsMA Arrow
Pavel Shutovskiy
3.83 (6)
The indicator displays crossing zero level by Moving Average of Oscillator (OsMA) in the form of arrows. The indicator notifies about a signal by means of a pop-up Alert window, or sending notification to e-mail. Parameters Fast EMA Period - fast EMA. This is an exponential moving average from a price with a short period. Slow EMA Period - slow EMA. This is also an exponential moving average of a market price but with a longer period. Signal SMA Period - MACD SMA. This is a signal line which is
FREE
UPD1 D Levels
Vitaliy Kuznetsov
5 (3)
水平指标基于前一天的数据。 数学公式决定进场和出场水平。 交易建议。 在欧洲交易时段开始时,当波动出现时进行 Levels 交易。 在波动不足的情况下,使用一半的止盈位出场。 如果价格在一半止盈位反转,则在反转时也在一半止盈位寻找目标。 如果价格从进场水平反弹,那么在反方向上价格可以达到第二个止盈。 不应总是在突破时进场。建议等待回测(突破水平并从反方向测试)。 如果市场上有几个最低成交量水平,则回测效果很好。请参阅 UPD1 剖面水平指标。 输入参数 。 Start Hour - 一天从几点开始。 00 - 默认 。 Visual Button - 按钮显示(启用/禁用) 。 Corner - 按钮锚定角度   。 X indent - 以像素为单位的水平填充   。 Y indent - 以像素为单位的垂直填充   。 Label Visual - 显示级别标签   。 Label Font Size   - 字体大小   。 Label Shift Bars   - 在酒吧的铭文的缩进   。 Label Tooltip   - 在关卡上方的光标下显示文本   。
FREE
该产品的买家也购买
Trend SniperX MT4
Sarvarbek Abduvoxobov
5 (5)
Trend Sniper X 是一款用于 MetaTrader 5 的多周期趋势追踪指标,旨在帮助交易者清晰、精准地识别趋势方向及潜在的反转点。 适用于 MT5: https://www.mql5.com/en/market/product/181101 价格信息: 当前价格为促销价,随着后续更新和新功能的推出,价格可能会发生变动。 Code2Profit 频道 通过多周期分析掌控市场! 如何使用 Trend Sniper X 最大化胜率:关键规则与交易时段技巧 技术规格 交易平台 MetaTrader 5 指标类型 多周期趋势指标 运行时间周期 任意图表周期,支持独立选择更高周期(M1–MN1) 主要交易品种 外汇、黄金 (XAUUSD) 及其他 CFD 差价合约 推荐账户 任何账户类型 可视化呈现 彩色趋势 K 线(买入/卖出/弱势/转变)+ 买入/卖出信号箭头 附加模块 市场交易时段框(悉尼、东京、伦敦、纽约) 核心功能 多周期趋势分析: 将更高周期的趋势方向直接投影到当前图表上,提供清晰的宏观视角。 弱势/不确定 K 线检测: 高亮显示趋势状况不明确的 K 线,帮助交易者远离震
Currency Strength Wizard
Oleg Rodin
4.85 (61)
货币强度向导是一个非常强大的指标,为您提供成功交易的一体化解决方案。该指标使用多个时间范围内所有货币的数据来计算这个或那个外汇对的力量。此数据以易于使用的货币指数和货币电力线的形式表示,您可以使用它们来查看这种或那种货币的力量。 您所需要的只是将指标附加到您要交易的图表上,该指标将向您显示您交易的货币的真实强度。该指标还向您显示买卖量压力的极值,您可以在顺势交易时利用这些压力。该指标还显示了基于斐波那契的可能目标。该指标可用于各种交易时间范围。该指标支持各种货币对的交易。 该指标为您提供所有类型的警报,包括推送通知。 购买后请联系我。我将与您分享我的交易技巧,并免费为您提供丰厚的红利指标! 祝您交易愉快,获利丰厚!
Scalper Vault
Oleg Rodin
5 (40)
Scalper Vault 是一套功能强大且配置完善的交易系统,专为追求日内交易稳定性的交易者而设计。 作为一套完整且独立的交易系统,该高精度指标能够为外汇和二元期权交易者提供机构级的市场分析。 购买后请联系我,获取我的独家交易技巧以及一份超值赠品! Scalper Vault 能够消除凭感觉交易和复杂的各种手动分析,让您只需专注于执行交易,并运用简单易行的交易技巧进行操作。 精准的顺势交易信号:其核心算法通过分析市场结构,仅在市场主导趋势的方向上提供高胜率信号,从而大幅减少错误的入场操作。 精确的顶部与底部探测:系统能够识别市场动能耗尽的状态,从而锁定潜在的反转区域。 基于江恩(Gann)理论的买卖区域:系统会自动绘制江恩数学市场点位,让您能清晰洞察大型机构交易者在何处寻求买入或卖出。 100% 不会重绘(Non-Repainting):一旦K线收盘,生成的信号便会永久固定在图表上。绝无动态偏移,绝无虚假信号——您在历史数据中所见,即为该指标的真实表现。 广泛的市场适用性:适用于各类货币对、黄金、指数以及加密货币交易。
目前八折优惠! 对任何新手或专家交易者来说都是最好的解决方案! 这个仪表板软件适用于28种货币对。它基于我们的两个主要指标(高级货币强度28和高级货币冲动)。它对整个外汇市场提供了一个伟大的概述。它显示高级货币强度值,货币运动速度和28个外汇对在所有(9)时间段的信号。想象一下,当你可以使用图表上的单一指标观察整个市场,以确定趋势和或剥头皮的机会时,你的交易将得到改善 我们已经在这个指标中建立了一些功能,使你更容易识别强势和弱势货币,同时识别和确认潜在的交易。该指标以图形方式显示货币的强势或弱势是增加还是减少,以及它在所有时间段的表现。 增加的新功能是动态市场斐波那契水平,它适应当前的市场条件变化,这是一个已经在我们的高级货币强度28和高级货币冲动指标中使用的成熟的加分项。 在交易时,总是将弱势货币和强势货币配对,这个新指标将帮助你做到这一点。 用户手册:点击这里  https://www.mql5.com/en/blogs/post/708783 特点  显示每个时间段的ACS28和GAP-speed(冲动)的货币强度值。 列:颜色代码以7种颜色显示货币强度:强势
Zoryk Gold mt4
Reda El Koutbane
5 (3)
折扣将在 24 小时后结束——下一价格为 69 美元 联系我获取推荐设置 首发名额有限 ZORYK — MetaTrader 4 专业 XAUUSD 黄金信号与交易计划系统 你一定经历过这种感觉。 你花时间分析黄金,等待入场,终于打开交易后,价格却立即向相反方向移动。你过早平仓,移动止损,或者因为犹豫几秒而错过机会。随后市场在没有你的情况下,准确到达你最初预期的目标。 问题并不总是方向错误。 真正的问题是不确定性。 你不知道真正的入场位置在哪里,不知道交易逻辑在什么位置失效,也不知道应该先保护较小的利润,还是继续等待更大的行情。你甚至不知道当前信号是否足够强,还是自己只是在勉强寻找一笔交易。 黄金移动速度非常快。没有明确计划的正确判断,也可能在几秒钟内变成错误决定。 ZORYK 正是为了解决这个问题而开发。 什么是 ZORYK ZORYK 是一套专门为 MetaTrader 4 和 XAUUSD M5 周期开发的完整黄金信号与交易计划系统。 它不是一个只显示 BUY 或 SELL 箭头,然后让你独自处理所有后续决定的普通指标。 每个确认信号都可以在图表上显示
PZ Turning Points MT4
PZ TRADING SLU
1 (1)
该指标检查不同时期分形的价格结构,以确定市场中可能的反转点,从而为已经具有基本或技术估值模型的仓位交易者提供时机。与它的弟弟 Reversal Fractals不同 ,该指标不会因为所选时期而错过反转,并且会以之字形方式找到反转分形,而忽略那些没有足够动量来引发持续价格波动的反转。 [ 安装指南 | 更新指南 | 故障排除 | 常见问题 | 所有产品 ] 转折点可以开始长期趋势 指示器不重涂 它实现了各种警报 可自定义的颜色和尺寸 该指示符是无功或滞后信号,因为分形是奇数个条形的地层,是中间地带中最高或最低的条形,并且指示符在分形中的所有条形都闭合时绘制。但是,具有预先设定的方向偏差的交易者会发现该指标非常有用,可以提早进入切入点。 该指标既不是下探信号指标,也不是完整的交易系统。请不要这样评价或审查它。 输入参数 最小分形数:分形上的最小条形数。必须为奇数,例如3、5、7、9、11、13,... 最大分形:分形上的最大条形数量。必须为奇数,例如3、5、7、9、11、13 ... 最大历史柱数:指标加载时评估的过去柱数。 颜色:自定义箭头和线条的颜色和大小。 警报:启用或禁用各
Trend Lines PRO
Roman Podpora
5 (2)
TREND LINES PRO 帮助您了解市场真正的方向转变点。该指标显示真实的趋势反转点以及主要参与者重新入场的时机。 您可以看到 BOS线、 趋势变化和更高时间框架的关键水平——无需复杂的设置或不必要的干扰。信号不会重绘,并在K线收盘后仍然保留在图表上。 VERSION MT 5    -   与……搭配使用时,可发挥其最大潜力   RFI LEVELS PRO 指示器 该指标显示的内容: 实际变化 趋势(BOS 线) 一旦信号出现,它就始终有效!这与会重绘的指标有着重要的区别,后者可能会发出信号后又改变信号,从而导致资金损失。现在,您可以更精准、更准确地进入市场。此外,还有一个功能,会在箭头出现后为K线着色,直到达到目标价位(止盈)或出现反转信号为止。 重复条目   以及主要玩家的充值 为了提高寻找入场点时的视觉清晰度,我们创建了一个模块,该模块首先显示买入/卖出区域,并在该区域内寻找最佳入场点。此外,我们还加入了智能逻辑来管理止损位,该逻辑会随着时间的推移逐步降低止损位的大小,从而降低入场交易时的初始风险(移动止损位)。 信号强度水平(BOS) 该指标采用三个显著性等级来衡量
Smart Trend Trading System
Issam Kassas
4.8 (10)
Smart Trend Trading System 是适用于 MetaTrader 4 的图表指标,将趋势信息、入场和出场信号以及价格水平集中呈现在同一图表上。 它将 10 多种交易工具 整合到一个系统中,包括趋势检测、反转区域、Smart Cloud、移动止损逻辑、支撑与阻力、K线着色、提醒以及多周期分析。 该系统旨在帮助您应对不同的市场环境: 趋势市场: 识别主要趋势,发现回调,跟随动能,并通过止损指导和移动止损选项寻找更清晰的入场机会。 震荡市场: 识别区间震荡状态,寻找价格反应区域,并在价格触及重要水平时获得更清晰的信号。 剥头皮和日内交易: 使用快速信号、K线颜色、提醒和多周期确认,辅助短线交易决策。 主要功能: • 10 多个指标整合为一个交易系统 • 7 多种策略和信号组合 • 趋势跟随、反转、剥头皮、日内交易和波段交易模式 • 入场和出场箭头 • Smart Cloud • Smart Reversal Zones • 支撑和阻力水平 • Smart Trailing Stop • 多周期趋势分析 • 成交量、趋势和反转K线着色 • 手机、电子邮件和终端提醒 •
SR Liquidity
Oleg Rodin
5 (2)
SR Liquidity 是一款旨在揭示市场流动性高度集中且价格反应最剧烈的隐蔽区域的交易指标。这些特殊的流动性区域充当着强有力的支撑位与阻力位,为您清晰呈现市场最可能发生反转的位置。 SR Liquidity 指标并非简单地绘制常规的支撑/阻力线,而是通过分析实际的价格行为,识别买卖压力积聚的区域。这些区域实际上是推动市场真实波动的流动性池。通过在图表上直观呈现这些区域,该指标能助您在价格反应发生前预判走势——这意味着它实际上能够预测价格方向可能发生的变化。它将原始的价格行为转化为清晰且具实操价值的市场蓝图,标示出那些可能成为市场转折点的关键价位。 该指标适用于任何交易品种和时间周期——包括外汇、指数、金属、加密货币等。支持任意时间周期。 购买后请联系我,以获取交易指南及免费赠送的优质附加指标!
AW Prime Oscillator
AW Trading Software Limited
5 (1)
两个振荡器的组合。第一个显示入场点,第二个显示当前趋势。该指标可以通过两种模式的箭头显示振荡信号,所有快速振荡信号或仅在当前趋势方向的信号。它具有多时间范围面板和三种类型的信号通知。 好处: 适合当日交易和倒卖交易 趋势过滤 简单而灵敏的设置 多时间框架面板 适合融入顾问。 适用于任何交易品种和任何时间范围 三种类型的通知 MT5 version ->  HERE  / Problem solving ->  HERE 指标策略 该指标由两个不同的振荡器组成: 慢趋势线(粗) - 当指标的最高水平从上到下交叉时,它是下降趋势的指标,当较低的水平水平(指标的低水平)从下到上交叉时,它是下降趋势的指标上升趋势。此外,在较低区域找到一条慢线表明当前趋势是下降趋势,反之亦然,在上方区域找到一条慢线表明当前趋势是上升趋势。这就是该指标确定当前市场趋势的方式。 快速入场线(细):识别从下到上与下线相交处的入场点,这是买入信号,在从上到下穿越上线时,这是卖出信号。除了振荡线之外,调整指标线也很重要,因为这会影响信号的数量和准确性。 本产品使用不同的振荡器来显示慢线和快线,每个振荡器必须单独调整。 为
PRO Renko System
Oleg Rodin
5 (31)
PRO Renko Arrow Based System for trading renko charts.  准确的信号交易任何外汇工具. 另外,我将免费提供系统的附加模块! PRO Renko系统是RENKO图表上高度准确的交易系统。该系统是通用的。 该交易系统可应用于各种交易工具。 该系统有效地中和了所谓的市场噪音,打开了获得准确反转信号的通道。 该指标易于使用,只有一个参数负责产生信号。 您可以很容易地使算法适应您感兴趣的交易工具和renko酒吧的大小。 我很乐意通过提供任何咨询支持来帮助所有客户有效地使用该指标。 祝您交易成功!购买后,立即写信给我! 我将与您分享我的建议和我的renko发电机。 另外,我将免费提供系统的附加模块!
M1 Sniper
Oleg Rodin
4.97 (30)
M1 SNIPER 是一款易于使用的交易指标系统。它是一个专为 M1 时间框架设计的箭头指标。该指标可以作为独立的系统在 M1 时间框架下进行剥头皮交易,也可以作为您现有交易系统的一部分使用。虽然该交易系统专为 M1 时间框架交易而设计,但它也可以用于其他时间框架。我最初设计此方法是为了交易 XAUUSD 和 BTCUSD。但我发现这种方法在其他市场交易中也同样有用。 指标信号既可以顺势交易,也可以逆势交易。我教授一种特殊的交易技巧,帮助您利用指标信号进行双向交易。该方法基于使用特殊的动态支撑位和阻力位区域。 购买后,您可以立即下载 M1 SNIPER 箭头指标。此外,我还为所有 M1 SNIPER 工具用户免费提供下方屏幕截图所示的 Apollo Dynamic SR 指标!这两个指标的组合可以帮助您更轻松、更准确地利用 M1 时间框架进行交易。 购买后请联系我,免费获取交易提示和奖励指标! 祝您交易成功!
SIO Oscillator:自优化半方差失衡振荡器 购买指标,即可免费获得基于该指标的智能交易系统(EA)。 大多数振荡器对所有价格波动一视同仁。SIO 将上行压力与下行压力分开,并衡量两者之间的失衡程度,清楚显示究竟是买方还是卖方在真正掌控市场。当失衡达到极值时,SIO 会给出明确的信号,并附带入场价、止损(Stop Loss)和止盈(Take Profit)水平。 SIO 的独特之处在于它不依赖固定参数。内置的自优化器会持续寻找适合当前品种和周期的参数,并在使用之前对其进行验证。 两种信号模式 均值回归(Mean Reversion):在失衡极值处交易,预期价格回归平衡。 趋势跟随(Trend Following):顺着持续、占主导地位的失衡方向交易。 自动模式:由优化器根据近期数据选择表现更好的模式。 具备真实验证的自优化器 滚动前推优化(Walk-forward):参数只用历史数据选出,然后应用于之后的K线。 真正的样本外保留期(Hold-out):结果会在优化器从未训练过的数据上得到确认。 平台图(Plateau map):所有测试参数的可视化热力图。SIO 优先选择结果稳
Neo Wave PRO
Nikolay Raykov
5 (1)
Price & Time Market Structure Indicator A professional market structure tool that analyzes waves through both price and time — not price alone. Main Description NeoWave PRO is a professional market structure indicator for MetaTrader 4 designed for traders who want to move beyond traditional one-dimensional wave tools such as ZigZag, swing indicators, and basic high/low systems. Most wave indicators analyze only one thing: Price. But a real market wave is not only a price movement. A true wave de
Gann Time Clusters
Martin Eshleman
2.5 (2)
Gann Time Clusters Indicator This indicator is based on W. D. Gann's Square of 9 method for the time axis. It uses past market reversal points and applies the mathematical formula for Gann's Square of 9 and then makes projections into the future. A date/time where future projections line up is called a 'time cluster'. These time clusters are drawn as vertical lines on the right side of the chart where the market has not advanced to yet. A time cluster will result in a market reversal point (ex.
CRT Candle Range Theory HTF MT4 - Ultimate CRT Indicator: 高级ICT概念与马来西亚SnR交易系统 使用最先进的 Candle Range Theory 指标掌握做市商的足迹。释放 Smart Money Concepts (SMC) 的真正力量,并使用 Ultimate CRT Indicator 像机构一样精确交易。该指标专为严肃的交易者打造,自动化了高效的蜡烛范围理论 (CRT)——ICT概念 (Inner Circle Trader) 的核心支柱,并通过马来西亚支撑与阻力 (SnR) 入场方法和 FVG (不平衡) 区域的致命精度对其进行了强化。 无论您是在 MT4 或 MT5 上交易外汇、加密货币还是指数,该算法都能消除市场噪音,过滤虚假突破,并将高概率、高回报的交易区域直接传送到您的图表上。 CRT Indicator 的核心功能: Absolute Extreme SnR Entry Engine: 与依赖滞后吞没形态的传统指标不同,我们的系统采用了马来西亚 SnR 技术。它在严格的时间窗口内扫描绝对最高的 Buy-
Atomic Analyst
Issam Kassas
5 (14)
Atomic Analyst — MetaTrader 4 如有产品、设置或技术支持方面的问题,请直接在 MQL5 上给我发消息。 该指标将复杂的市场计算转换为简单的视觉信号、彩色K线、趋势读数、止损水平和多个止盈区域,使交易者能够快速理解并应用于真实市场环境。 主要交易用途: 剥头皮和日内交易: 专为快速决策、清晰箭头、提醒、K线颜色和结构化进出场区域而设计。 日内交易和波段交易: 帮助交易者利用趋势方向、强度、动能和多周期分析跟随更大的市场波动。 主要功能: • 价格行为、强度和动能分析 • 多周期趋势扫描器 • 总体趋势百分比计算 • 买入和卖出箭头 • 止损和多个止盈水平 • 最多 5 个基于斐波那契的止盈水平 • 移动止损逻辑 • 用于趋势和动能的彩色K线 • 实时提醒到终端、手机和电子邮件 • 现代化用户友好面板 • 实时交易监控 • 买入和卖出潜力显示 • 总交易数量显示 • 每日、每周和总利润显示 • 每日佣金计算 • Bid、Ask 和点差显示 • K线计时器、本地时间和服务器时间 • 终端连接状态 • 账户货币显示 • 可直接从面板控制时间周期 • 可手动使用,
Forex Breath System
Oleg Rodin
5 (6)
Forex Breath System 它是一个基于趋势的交易系统,可用于任何市场。您可以将此系统用于货币、金属、商品、指数、加密货币甚至股票。它也可以在任何时间范围内使用。该系统是通用的。它显示趋势并提供趋势箭头信号。当信号出现在趋势方向时,该指标还可以为您提供特殊类型的警报,从而使趋势交易成为一项简单的任务。 该指标非常易于使用,因为它根本不需要处理任何难以理解的设置。 您只需将其附加到图表中即可开始交易。无论您喜欢哪种交易风格,系统都会帮助您了解市场的方向以及趋势方向上可能的入场点。 该系统将对所有交易者有所帮助,无论他们的交易经验水平如何。 该指示器提供所有类型的警报,包括推送通知。 购买后请联系我以获得交易说明和丰厚奖金! 祝您交易愉快、盈利!
Imbalance Pro
Ivan Stefanov
5 (4)
该指标测量所选时段内牛市和熊市之间的不平衡,并在两点之间显示一条直线。 如果牛市的成交量大于熊市,则该线变为绿色。 如果熊市成交量更大,则为红色。 直线还显示成交量的百分比差异。 该指标在单独的窗口中显示相同的数据。您还可以看到分割后的成交量。 该指标有两种模式。 为此,左上方有一个按钮、  - 如果不按下,它将测量市场任意点与当前价格之间的不平衡。 - 如果按下按钮,则可以测量市场任意两点之间的平衡。 该指标测量所选时段内牛市和熊市之间的不平衡,并在两点之间显示一条直线。 如果牛市的成交量大于熊市,则该线变为绿色。 如果熊市成交量更大,则为红色。 直线还显示成交量的百分比差异。 该指标在单独的窗口中显示相同的数据。您还可以看到分割后的成交量。 该指标有两种模式。 为此,左上方有一个按钮、  - 如果不按下,它将测量市场任意点与当前价格之间的不平衡。 - 如果按下按钮,则可以测量市场任意两点之间的平衡。
Advanced Currency IMPULSE with ALERT
Bernhard Schweigert
4.9 (491)
目前40%的折扣!! 对任何新手或专家交易者来说都是最好的解决方案! 这个指标是一个独特的、高质量的、负担得起的交易工具,因为我们已经纳入了一些专有的功能和一个秘密的公式。只需一张图表,它就能给出所有28种货币对的警报。想象一下,你的交易将如何改善,因为你能够准确地确定新趋势或剥头皮机会的触发点 建立在新的基础算法上,它使识别和确认潜在交易变得更加容易。这是因为它以图形方式显示了一种货币的强势或弱势是否正在加速,并测量了这种加速的速度--把它想象成你汽车中的速度表。当你加速时,事情显然会发生得更快,这在外汇市场上也是一样的,即如果你配对的货币正在向相反的方向加速,你就会发现一个潜在的有利可图的交易。 货币动量的垂直线和箭头将指导你的交易! 动态的市场斐波那契23水平被用作警报触发器,将适应市场活动。如果冲动触及黄色触发线,您将在MetaTrader或您的电子邮件或推送警报中收到警报。然后你就知道作为一个交易员应该做什么。货币对和方向已经给出。只要点击警报按钮,就可以切换到该货币对或打开一个新的图表,以便进一步分析。警报级别可以通过用户输入来改变,可以选择3个敏感度级别。 尽
Super Signal – Skyblade Edition 專業級無重繪 / 無延遲趨勢信號系統,擁有卓越勝率 | 適用於 MT4 / MT5 在較低的時間週期上效果最佳,例如 1 分鐘、5 分鐘與 15 分鐘圖表。 核心特色: Super Signal – Skyblade Edition 是一套專為趨勢交易設計的智能信號系統。 其採用多重濾波邏輯,僅篩選出具有明確方向性、動能強勁且波動結構健康的走勢進場點。 本系統 不預測高點或低點 ,只有在同時滿足以下三項條件時才會觸發交易信號: 趨勢方向明確 動能持續增強 波動率結構穩定 此外,系統還結合市場流動性分析,以進一步提升信號的準確性與觸發時機。 信號特性: 所有箭頭信號皆為 100% 無重繪,無延遲 信號一旦出現即固定於圖表,不會閃爍或消失 提供圖表箭頭、資訊面板、彈出通知、聲音提示及推播訊息 支援 EA 呼叫(Buffer 輸出),可整合至自動化交易或信號跟單系統 提供預設參數模板,免調整即可使用,適合新手快速上手 總結: Super Signal – Skyblade Edition 是一款邏輯清晰、穩定高效的專業趨勢型
Tokyo mt4 Indicator
Vasiliy Strukov
5 (9)
Tokyo Indicator(东京指标)直观地展示了趋势方向、潜在交易信号及市场状况。 其采用颜色编码的阶梯式趋势线,以蓝色标识看涨阶段,以洋红色标识看跌阶段。配套的方向箭头会在趋势发生变化时,标示出潜在的买入与卖出机会。 内置的综合仪表盘将当前信号、市场倾向、动能、波动率及信号质量整合于同一视图中,方便交易者在观察价格走势的同时评估指标数据,无需在不同面板间切换。 凭借清晰的图表显示和简洁的市场概览,Tokyo Indicator 支持以系统化的方式进行趋势分析与交易确认。 适用于任何时间周期及各类交易品种,尤其适合黄金交易。 购买后请立即联系我,以获取专属赠品!您可以免费获得我们的“强力支撑与趋势扫描”(Strong Support and Trend Scanner)指标,请私信我! 设置说明与使用手册请见此处。 请注意:我不会在 Telegram 上出售我的 EA 或特殊参数设置(set files);我的 EA 仅在 Mql5 平台上提供,而参数设置文件仅在我的博客(此处链接)上发布。请务必警惕诈骗,切勿从他人处购买任何参数设置! 设置 ShowHUD —— 在图表上显示
Liquidity Scalper System
Stanislav Konin
5 (2)
Liquidity Scalper System: 基于流动性的指标形式交易系统。 大多数指标只显示一个箭头,止损放在哪里、目标在哪里、信号是否可信,都要交易者自己判断。Liquidity Scalper System 覆盖完整的交易周期:寻找流动性池,在其被突破时给出信号,立即计算 Entry、Stop Loss 和三个目标,并在面板上显示统计数据以及新数据上的验证结果。系统自行选择设置,并每天更新。 工作原理 1. 系统寻找流动性池:市场参与者止损单聚集的价位。 2. 当价格突破流动性池,且突破经由动能(必要时还经由成交量)确认后,图表上出现 BUY 或 SELL 箭头。 3. 立即绘制 Entry、Stop Loss、TP1、TP2 和 TP3 水平,并填充区域。 4. 右侧构建流动性分布图:可以看到价格上方和下方大成交量集中的位置。 与众不同之处 • 自动优化取代手动调参。 系统在历史数据上测试 32 种设置组合,为当前品种和周期选出最佳组合。优化目标可选:Win Rate、净利润或盈利因子。 • 新数据验证。 设置在一部分历史上训练,并在优化器未见过的更新数据上检验(out
Gann Made Easy
Oleg Rodin
4.84 (174)
Gann Made Easy 是一个专业且易于使用的外汇交易系统,它基于使用先生理论的最佳交易原则。 W.D.江恩。该指标提供准确的买入和卖出信号,包括止损和获利水平。您甚至可以使用推送通知在旅途中进行交易。 购买后请联系我,即可免费获得交易指导和超棒的额外指标! 您可能已经多次听说过江恩交易方法。通常 Gann 的理论不仅对于新手交易者而且对于那些已经有一定交易经验的人来说都是非常复杂的东西。这是因为江恩的交易方法在理论上并不那么容易应用。我花了几年时间来完善这些知识,并将最好的原则应用到我的外汇指标中。 该指标非常易于应用。您所需要的只是将其附加到您的图表并遵循简单的交易建议。该指标不断进行市场分析工作并寻找交易机会。当它检测到一个好的入口点时,它会为您提供一个箭头信号。该指标还显示止损和获利水平。 换句话说,当您像先生一样进行交易时,该指标会为您提供最佳江恩建议。江恩亲自告诉你此时此刻该做什么。但最好的部分是您不需要了解任何有关江恩交易原则的知识,因为该指标会为您完成整个市场分析工作。
Elliott Live 是一款 MetaTrader 5 指标,可在历史行情和当前K线上自动标注艾略特波浪。已完成的波浪用实线绘制,正在形成的波浪用虚线并带有问号标记(例如“3?”),同时显示斐波那契目标位和失效位。 MT5-version:  https://www.mql5.com/en/market/product/200604 工作原理 指标首先构建波段(ZigZag):当价格从极值回撤至少 ATR × 倍数时,确认一次反转。最后一个点是当前极值,尚未确认,可能继续移动。 在这些波段上,按艾略特规则识别推动浪 1-2-3-4-5:第 2 浪不会跌破(或突破)第 1 浪起点,第 3 浪不会是最短的一浪,第 4 浪不会进入第 1 浪的区域。推动浪之后识别 A-B-C 调整浪,再识别下一组推动浪。 如果最新的波段只构成形态的一部分(例如 1-2),指标会显示正在形成的波浪:带“?”的标签、指向当前极值的虚线、斐波那契目标位和失效位。价格已经越过的目标位会自动隐藏。 当下一次反转达到 ATR 阈值时,该波浪被确认,线条变为实线。 使用方法 判断当前所处的市场阶段:是推动浪还是调整浪
Gold Channel XAUUSD
Paulo Rocha
5 (4)
Gold Channel is a volatility-based indicator, developed with a specific timing algorithm for the XAUUSD pair, which consists of finding possible corrections in the market. This indicator shows two outer lines, an inner line (retracement line) and an arrow sign, where the theory of the channel is to help identify overbought and oversold conditions in the market. The market price will generally fall between the boundaries of the channel. If prices touch or move outside the channel it is a tradi
Follow Trend Steps Follow Trend Steps: See Your Price Zones Before the Market Moves Plan your trades around clear price zones, not guesswork. Follow Trend Steps draws clean, color-coded zones directly on your chart, showing where price has recently turned and where it may react again, so you can plan entries, exits and risk with confidence. Available for Meta Trader 4 and Meta Trader 5. Why traders use Follow Trend Steps Every chart is full of noise. Support and resistance lines are drawn diff
这个指标显示8个主要货币的相对强弱:USD, EUR, GBP, AUD, NZD, CAD, CHF and JPY. 强弱值规范到了 0-100之间 60以上是强。 40以下是弱. 基本原理 八个主要货币 USD,EUR,GBP,AUD,NZD,CAD,CHF,JPY, 他们每两个配对, 一共组成28对货币对, 利用逆向算法从28个货币对中提取到8个货币的强度 EURUSD,GBPUSD,AUDUSD,NZDUSD, USDCAD,USDCHF,USDJPY,EURGBP, EURAUD,EURNZD,EURCAD,EURCHF, EURJPY,GBPAUD,GBPNZD,GBPCAD, GBPCHF,GBPJPY,AUDNZD,AUDCAD, AUDCHF,AUDJPY,NZDCAD,NZDCHF, NZDJPY,CADCHF,CADJPY,CHFJPY 基本用法:  60以上为强, 40以下为弱 买最强的货币, 空做弱的货币 如果所有货币强度曲线位于40到60之间, 意味着市场处于震荡行情中 长线交易者, 最好等到两货币交叉之后 如果货币从60向上穿越60, 意味着它真正走
Liked the logic of this tool? Explore the full ecosystem of professional indicators and utilities created by a trader for traders: All products by the author on MQL5 Market: https://www.mql5.com/en/users/musa1994/seller Details and trading philosophy: https://developer-mql4-mql5.netlify.app/ Professional Delta Volume MTF v2.0 is a professional indicator for MetaTrader 4 that shows the difference between buy and sell volume (Delta Volume) and Cumulative Delta. Version 2.0 introduces f
Sniper Flip Zones
Leandro Bernardez Camero
5 (2)
Sniper Flip Zones – 精准的买卖信号系统 我设计了 Sniper Flip Zones,以在趋势或震荡市场中识别动量急剧转变的时刻,从而生成极其精准的买入和卖出信号。该系统在 XAUUSD 的 M1/M5 时间框架上表现出色,但通过可配置的参数,也可应用于任何货币对和时间框架。 加入频道以获取最新信息: https://www.mql5.com/en/channels/forexnewadvisor 核心逻辑包括: – 在极端水平(10/90)处的随机指标反转 – 可选的 %K 和 %D 交叉 – 使用短期和长期简单移动平均线的动态趋势检测 – 避免连续同方向信号的交替逻辑 信号生成方式: – 超买/超卖退出: 指标检测快速随机指标何时退出极端区域(高于90或低于10),通常标志着短期反转。 – 交叉过滤器: 可启用 %K/%D 交叉以获得更强的确认(可选)。 – 趋势对齐: 系统使用双移动平均线过滤器(可配置)检测看涨或看跌趋势偏差,有助于避免逆势信号。 – 交替逻辑: 为减少过度交易,一旦发出买入或卖出信号,下一个信号必须是相反方向。 – 所有计算均基
作者的更多信息
Gartley Harmonic
Alessandro Michele Ventrella
Gartley Harmonic Detector PRO / GRATUITO Introduzione Benvenuti al Gartley Harmonic Detector , lo strumento definitivo per il trading armonico su MetaTrader 5. Questo indicatore è progettato per identificare automaticamente il classico pattern Gartley (sia rialzista che ribassista) in tempo reale con estrema precisione. Che siate trader esperti o principianti, questo strumento vi aiuta a individuare istantaneamente le Zone di Potenziale Inversione (PRZ) ad alta probabilità, eliminando la necess
FREE
Strong Hosoda Pro
Alessandro Michele Ventrella
*Strong Hosoda Pro - Versione M15 GRATUITA* Strong Hosoda Pro è un indicatore di tendenza e livelli basato sul metodo originale Ichimoku Hosoda. Questa è la versione GRATUITA, funzionante solo sul timeframe M15. È completamente funzionale per testare la strategia. *Caratteristiche principali:* - Chiare frecce di ACQUISTO/VENDITA con avviso Livelli dinamici di Take Profit  - Grafico pulito, nessuna rielaborazione dopo la chiusura della barra - Basato sulla logica di Tenkan, Kijun, Senkou Spa
FREE
Asian Range full Breakout
Alessandro Michele Ventrella
Ecco una guida utente completa e professionale in inglese, con descrizione dell'indicatore, formattata in modo da poterla facilmente copiare e incollare nella pagina del prodotto, nel file di descrizione o nella documentazione di MQL5 Market. Indicatore Asian Range Breakout Pro (MT5) Asian Range Breakout Pro è uno strumento di analisi tecnica di livello professionale progettato per MetaTrader 5 (MT5), specificamente ideato per individuare configurazioni di breakout ad alta probabilità sulle pri
FREE
Matrix Trend Pro
Alessandro Michele Ventrella
Matrix Trend Pro (Free Edition) Matrix Trend Pro Free is a clean, reliable, and powerful trend-following indicator designed for MetaTrader 4. Built around a customized multi-period logic and institutional volatility channels, this free edition helps you instantly identify market direction and key operational zones without cluttering your workspace. Key Features Dynamic Trend Line: Powered by a customized moving-average algorithm that tracks primary market dynamics and automatically changes st
FREE
Multi Spread Hunter
Alessandro Michele Ventrella
Scanner a diffusione Spread Scanner è uno strumento di monitoraggio multi-simbolo elegante, professionale e ad alte prestazioni, progettato per MetaTrader 5 (MT5). Consente ai trader di tracciare e confrontare in tempo reale gli spread su 10 strumenti di trading personalizzabili simultaneamente, direttamente da un'interfaccia HUD intuitiva sul grafico. Che si tratti di operare sulle principali coppie di valute Forex, sui metalli preziosi o sugli indici, sapere dove le condizioni di esecuzione so
FREE
Multi Spread Hunter Info
Alessandro Michele Ventrella
Scanner a diffusione Spread Scanner è uno strumento di monitoraggio multi-simbolo elegante, professionale e ad alte prestazioni, progettato per MetaTrader 4 (MT4). Consente ai trader di tracciare e confrontare in tempo reale gli spread su 10 strumenti di trading personalizzabili simultaneamente, direttamente da un'interfaccia HUD intuitiva sul grafico. Che si tratti di operare sulle principali coppie di valute Forex, sui metalli preziosi o sugli indici, sapere dove le condizioni di esecuzione so
FREE
Full History Drawdown
Alessandro Michele Ventrella
Monitoraggio completo dei drawdown storici - Expert Advisor per MetaTrader 5 Descrizione del prodotto (descrizione del mercato): Smetti di fare supposizioni sulla tua reale esposizione al rischio. Scopri immediatamente il tuo peggior calo storico. Il Full History Drawdown Monitor è un'utility professionale essenziale per la gestione del rischio, sviluppata per MetaTrader 5 (MT5). A differenza dei report o dei monitor standard del terminale, che calcolano il drawdown solo dal momento in cui veng
FREE
Guardian Started
Alessandro Michele Ventrella
Guardian PRO v11.0 - Prova gratuita (50 trascinamenti) Scopri la potenza del trading furtivo. Benvenuto nella prova gratuita di Guardian PRO v11.0 , lo strumento definitivo progettato per proteggere le tue posizioni e padroneggiare la gestione del rischio su MetaTrader 4. Questa versione di prova consente di sperimentare le funzionalità principali del sistema Guardian: l'occultamento dello stop loss e del take profit del broker e il sistema di trailing stealth . Prima di scaricare il programma
FREE
_Guardian PRO v11.0 DARK - Il gestore di trading definitivo per MT4_ Guardian PRO è un pannello di controllo professionale progettato per proteggere e gestire le tue operazioni direttamente sul grafico, con un moderno design scuro. Dimentica i terminali MT4 standard: Guardian nasconde i tuoi livelli di Stop Loss e Take Profit al broker. _CARATTERISTICHE PRINCIPALI:_ 1. I BROKER SMETTONO DI NASCONDERE LA TECNOLOGIA: Guardian memorizza internamente i tuoi livelli SL/TP (Variabili Globali). I t
Strong Hosoda Pro Full
Alessandro Michele Ventrella
*Strong Hosoda Pro - Edizione COMPLETA - Premium* Strong Hosoda Pro è un indicatore professionale di trend e livelli basato sul metodo originale Ichimoku Hosoda, sviluppato per trader esperti. Questa è la versione Premium COMPLETA, valida per tutti i tempi, da M1 a D1. Nessuna restrizione. *Perché Premium?* A differenza degli indicatori standard, combinazione direzione del trend, tempistica di ingresso e livello di take profit in un unico sistema chiaro, basato sulla logica completa dell'Ich
Matrix Trend Pro Suite
Alessandro Michele Ventrella
DEMO RESTRICTION: Demo works on EURUSD only. To use on XAUUSD, GBPUSD, and all other symbols please purchase the Full version. Matrix Trend Pro Suite Matrix Trend Pro Suite is a cutting-edge, all-in-one trading system designed for MetaTrader 4. It combines multi-timeframe trend analysis, volatility channels, and automated risk management into a single, clean workspace. Whether you are looking to capture strong market trends or optimize your risk-to-reward ratio, this suite provides institutiona
Matrix Trend Pro EA
Alessandro Michele Ventrella
MATRIX TREND PRO EA - La suite definitiva per l'analisi automatizzata delle tendenze Matrix Trend Pro EA è la versione completamente automatizzata del bestseller Matrix Trend Pro Indicator. La stessa potente logica, ora automatizzata al 100%. Niente più punti di ingresso persi, niente più trading emotivo, niente più tempo davanti allo schermo. Lo colleghi. Fa tutto da solo. COME FUNZIONE - LA LOGICA DI MATRIX Questo non è un semplice Expert Advisor basato sui media mobile. Si tratta di un s
Lot Size Calculator Universal
Alessandro Michele Ventrella
PREZZO DI LANCIO 49 USD -> PREZZO SUCCESSIVO 97 USD! Calcolatore della dimensione del lotto PRO Universale - L'UNICO calcolatore di rischio che funziona con il simbolo OGNI. Se cerchi: calcolatore della dimensione del lotto, calcolatore del rischio, calcolatore della dimensione della posizione, gestione del denaro MT5, calcolatore di lotti forex - eccolo. UNIVERSALE: Forex, XAUUSD Oro, BTCUSD Criptovalute, indici US30 NAS100, conti Standard, CENT, Micro. Rilevamento automatico della lev
Breakout Box Radar 1
Alessandro Michele Ventrella
Breakout Box Radar - Box di Struttura di Mercato Istituzionale di Alessandro Michele Ventrella Stanchi di ridisegnare gli indicatori? Breakout Box Radar è uno strumento istituzionale basato sulla price action. Questo indicatore calcola automaticamente la struttura storica del mercato e completa la sua formazione alle 08:00 ora del server, contrassegnando la zona esatta in cui si è accumulata la liquidità. Nessuna impostazione da ottimizzare. Nessun ridisegno. Livelli solisti. COME FUNZIONE: Cal
Volume Profile Advanced S D
Alessandro Michele Ventrella
VOLUME PROFILE S&D — Advanced Market Structure & Supply/Demand Suite Overview Volume Profile S&D is a professional-grade indicator designed to bring institutional-level volume analysis directly to MetaTrader. By mapping market liquidity through volumetric price distribution rather than simple visual highs and lows, this tool automatically identifies where real institutional transactions, accumulations, and distributions occur. Key Features: Dynamic Value Area (VAH & VAL): Automatically calculate
Real Raw Indicator
Alessandro Michele Ventrella
REAL RAW| Suite per volumi istituzionali e blocchi di ordini REAL RAW  è un indicatore di trading professionale all'avanguardia e ultra-preciso, progettato per i trader d'élite che esigono assoluta trasparenza dal mercato. Realizzato senza smoothing artificiale o filtri matematici ritardati, questo strumento opera al 100% su dati istituzionali grezzi per rivelare le reali tracce del capitale investito, i principali pool di liquidità e le zone di accumulazione ad alto volume in cui viene impiegat
Full History Drawdown 4
Alessandro Michele Ventrella
Monitoraggio completo dei drawdown storici - Expert Advisor per MetaTrader 4 Descrizione del prodotto (descrizione del mercato): Smetti di fare supposizioni sulla tua reale esposizione al rischio. Scopri immediatamente il tuo peggior calo storico. Il Full History Drawdown Monitor è un'utility professionale essenziale per la gestione del rischio, sviluppata per MetaTrader 4 (MT4). A differenza dei report o dei monitor standard del terminale, che calcolano il drawdown solo dal momento in cui veng
FREE
Gartley Harmonic Pro4
Alessandro Michele Ventrella
Gartley Harmonic Pro4 Introduzione Benvenuti al Gartley Harmonic Pro4   , lo strumento definitivo per il trading armonico su MetaTrader 4. Questo indicatore è progettato per identificare automaticamente il classico pattern Gartley (sia rialzista che ribassista) in tempo reale con estrema precisione. Che siate trader esperti o principianti, questo strumento vi aiuta ad individuare istantaneamente le Zone di Potenziale Inversione (PRZ) ad alta probabilità, eliminando la necessità di complessi dis
*Guardian PRO v11.0 DARK - Il gestore di trading definitivo per MT5* Guardian PRO è un pannello di controllo professionale progettato per proteggere e gestire le tue operazioni direttamente sul grafico, con un design scuro e moderno. Dimentica i terminali MT5 standard: Guardian nasconde i tuoi livelli di Stop Loss e Take Profit al broker. *CARATTERISTICHE PRINCIPALI:* *1. I BROKER SMETTONO DI NASCONDERE LA TECNOLOGIA:* Guardian memorizza internamente i tuoi livelli SL/TP (Variabili Globali).
PREZZO DI LANCIO 49 USD -> PREZZO SUCCESSIVO 97 USD! Calcolatore della dimensione del lotto PRO Universale - L'UNICO calcolatore di rischio che funziona con OGNI simbolo. Se cerchi: calcolatore della dimensione del lotto, calcolatore del rischio, calcolatore della dimensione della posizione, gestione del denaro MT5, calcolatore di lotti forex - eccolo. UNIVERSALE: Forex, XAUUSD Oro, BTCUSD Criptovalute, indici US30 NAS100, conti Standard, CENT, Micro. Rilevamento automatico della leva f
Breakout box Radar
Alessandro Michele Ventrella
Breakout Box Radar - Box di Struttura di Mercato Istituzionale di Alessandro Michele Ventrella Stanchi di ridisegnare gli indicatori? Breakout Box Radar è uno strumento istituzionale basato sulla price action. Questo indicatore calcola automaticamente la struttura storica del mercato e completa la sua formazione alle 08:00 ora del server, contrassegnando la zona esatta in cui si è accumulata la liquidità. Nessuna impostazione da ottimizzare. Nessun ridisegno. Livelli solisti. COME FUNZIONE: Cal
Volume Profile Advanced SD
Alessandro Michele Ventrella
VOLUME PROFILE S&D — Advanced Market Structure & Supply/Demand Suite Overview Volume Profile S&D is a professional-grade indicator designed to bring institutional-level volume analysis directly to MetaTrader. By mapping market liquidity through volumetric price distribution rather than simple visual highs and lows, this tool automatically identifies where real institutional transactions, accumulations, and distributions occur. Key Features: Dynamic Value Area (VAH & VAL): Automatically calculate
Real Raw Indicator 5
Alessandro Michele Ventrella
REAL RAW   | Suite per volumi istituzionali e blocchi di ordini REAL RAW    è un indicatore di trading professionale all'avanguardia e ultra-preciso, progettato per i trader d'élite che esigono assoluta trasparenza dal mercato. Realizzato senza smoothing artificiale o filtri matematici ritardati, questo strumento opera al 100% su dati istituzionali grezzi per rivelare le reali tracce del capitale investito, i principali pool di liquidità e le zone di accumulo ad alto volume in cui viene impiega
Gartley Harmonic Pro
Alessandro Michele Ventrella
Gartley Harmonic Detector PRO  Introduzione Benvenuti al Gartley Harmonic Detector , lo strumento definitivo per il trading armonico su MetaTrader 5. Questo indicatore è progettato per identificare automaticamente il classico pattern Gartley (sia rialzista che ribassista) in tempo reale con estrema precisione. Che siate trader esperti o principianti, questo strumento vi aiuta a individuare istantaneamente le Zone di Potenziale Inversione (PRZ) ad alta probabilità, eliminando la necessità di com
Bat Harmonic
Alessandro Michele Ventrella
Bat Harmonic Free è uno scanner automatico avanzato di pattern armonici per MetaTrader 5, specificamente progettato per rilevare il pattern Bat con elevata precisione geometrica, basandosi sulle regole di Scott Carney. Questa versione gratuita è limitata all'utilizzo esclusivo sulla coppia USD/JPY con timeframe a 5 minuti (M5) , consentendo di testare il riconoscimento dei pattern in tempo reale, la zona di potenziale inversione (PRZ), i rapporti di Fibonacci sulle gambe e i livelli di Take Pro
FREE
Bat Harmonic Pro
Alessandro Michele Ventrella
Bat Harmonic PRO è lo scanner automatico di pattern armonici definitivo per MetaTrader 5, progettato per i trader professionisti che esigono precisione, flessibilità e una copertura completa del mercato. Basandosi sulle solide regole geometriche del pattern Bat di Scott Carney, questa versione completa è completamente sbloccata per tutti i simboli e i timeframe . Che tu operi sui principali indici Forex, sugli indici azionari, sulle criptovalute o sulle materie prime, dal grafico M1 ad alta vel
Cypher Harmonic Pro
Alessandro Michele Ventrella
Cypher Harmonic PRO - Rilevatore di pattern armonici di precisione Porta la tua analisi tecnica a un livello superiore con Cipher Harmonic PRO , l'indicatore avanzato per MetaTrader 5 (MT5) sviluppato specificamente per identificare il complesso e redditizio pattern armonico "Cipher". A differenza dei classici pattern armonici (come Gartley o Bat), il Cipher si distingue per la sua struttura geometrica unica e le specifiche regole di ritracciamento, offrendo punti di inversione estremamente pre
Cypher Harmonic
Alessandro Michele Ventrella
Cypher Harmonic FREE - Rilevatore di armoniche per EURUSD M5 Sperimenta la precisione e la potenza dell'analisi armonica avanzata con Cipher Harmonic FREE , l'indicatore gratuito per MetaTrader 5 (MT5) creato appositamente per il pattern Cipher . Questo strumento automatizza il riconoscimento geometrico di complesse strutture armoniche sul tuo grafico, permettendoti di testare in prima persona i punti di inversione e gli obiettivi di profitto prima di passare alla versione PRO completa. Caratte
FREE
Bart Simpson Pattern Pro
Alessandro Michele Ventrella
Il rilevatore di trappole di liquidità Se operate nel mercato di asset ad alta volatilità come criptovalute, indici o azioni specifiche, avrete familiarità con il "modello di Bart Simpson". Si tratta di quella struttura di prezzo frustrante e manipolativa in cui il mercato compie un'improvvisa impennata verticale (il picco), entra in una fase di consolidamento piatta e ristretta (la testa) e poi crolla violentemente (o risale), riportando il prezzo esattamente al punto di partenza. Il Bart Simp
筛选:
无评论
回复评论