Gartley Harmonic lim

Gartley Harmonic Free 

Introduzione

Benvenuti al Gartley Harmonic Free  , lo strumento definitivo per il trading armonico su MetaTrader 4. Questo indicatore è progettato per identificare automaticamente il classico pattern Gartley (sia rialzista che ribassista) in tempo reale con estrema precisione.

Che siate trader esperti o principianti, questo strumento vi aiuta ad individuare istantaneamente le Zone di Potenziale Inversione (PRZ) ad alta probabilità, eliminando la necessità di complessi disegni manuali sui grafici.

Come funziona

L'indicatore analizza continuamente l'andamento dei prezzi utilizzando un algoritmo ZigZag sottostante per individuare i punti pivot strutturali. Una volta individuata una struttura valida che rispettivi i classici rapporti aurei di Fibonacci del pattern Gartley, traccia automaticamente le gambe armoniche XABCD sul grafico.

Caratteristiche principali

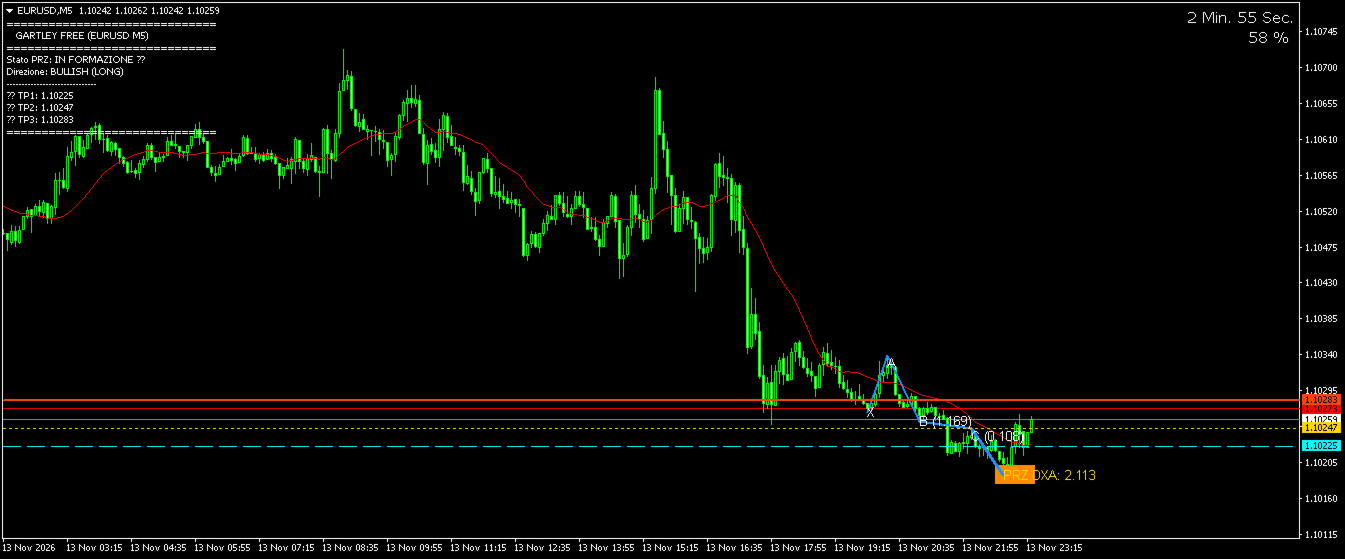
  • Riconoscimento automatico del modello: niente più disegni manuali. L'indicatore individua automaticamente i punti X, A, B, C e D.

  • Evidenziazione della PRZ: un riquadro arancione evidenzia la Zona di Potenziale Inversione (Punto D) in cui si prevede un'inversione del mercato.

  • Livelli di Take Profit dinamici: traccia automaticamente tre linee di Take Profit (TP1, TP2, TP3) calcolate tramite estensioni CD di Fibonacci.

  • Rapporti di Fibonacci sullo schermo: visualizza le percentuali di ritracciamento chiave (ad esempio, AB = 61,8% di XA) direttamente sui lati del modello per una rapida verifica visiva.

  • Sistema di allerta PRZ: non perdere mai un'opportunità di trading. L'indicatore attiva un avviso a schermo e, facoltativamente, una notifica push sul cellulare non appena il prezzo entra nella zona PRZ.

  • Pannello informativo chiaro: un'elegante casella di commento in alto a sinistra mostra lo stato del pattern (Valido / In formazione), la direzione (Lungo / Corto) ei prezzi Take Profit esatti.

Confronto tra razze

Caratteristica Versione GRATUITA Versione PRO (completa)
Simboli / Risorse Solo EURUSD TUTTO (Forex, Indici, Criptovalute, Azioni)
Tempistiche Solo M5 TUTTI (M1, M15, H1, D1, ecc.)
quantificazione Gartley ✅ Sì ✅ Sì
Casella di zona PRZ ✅ Sì ✅ Sì
Livelli di Take Profit ✅ Sì ✅ Sì
Avvisi sullo schermo ✅ Sì ✅ Sì
Notifiche push per dispositivi mobili ✅ Sì ✅ Sì

Istruzioni di installazione

  1. Scarica il file .ex4 dell'indicatore.

  2. Apri MetaTrader 4 e vai a File -> Apri cartella dati .

  3. Vai a MQL5 -> Indicators .

  4. Incolla il file dell'indicatore in questa cartella.

  5. Riavvia MetaTrader 4 oppure fai clic con il pulsante destro del mouse sull'elenco "Indicatori" nella finestra Navigatore e seleziona "Aggiorna".

  6. Trascina e rilascia l'indicatore sul grafico.

Nota importante per gli utenti della versione GRATUITA: l'indicatore verrà caricato solo se il grafico è impostato esclusivamente su EURUSD con timeframe M5 (5 minuti) . Se applicato a qualsiasi altra risorsa o intervallo di tempo, l'esecuzione verrà bloccata e verrà visualizzato un avviso.

Design degli uffici

  • Barra di pivot sinistra/destra: impostazioni di sensibilità per il motore di rilevamento del pivot ZigZag. I valori predefiniti (5,5) sono standard per i pattern armonici.

  • Mostra i rapporti di Fibonacci: abilita o disabilita le etichette dei rapporti sulle gambe del modello.

  • Evidenzia la casella PRZ: attiva/disattiva il rettangolo arancione della zona di inversione.

  • Estensioni Take Profit: Regola i rapporti moltiplicatori per TP1, TP2 e TP3 (ad esempio, 0,618, 1,000, 1,618).

  • Avvisi e notifiche push: attiva o disattiva gli avvisi sonori e le notifiche per dispositivi mobili.

추천 제품
Multi Timeframe ZigZag Indicator
Salman A A A T Bakhash
5 (2)
Description: This indicator draw ZigZag Line in multiple time frame also search for Harmonic patterns before completion of the pattern. Features: Five instances of ZigZag indicators can be configured to any desired timeframe and inputs. Draw Harmonic pattern before pattern completion. Display Fibonacci retracement ratios. Configurable Fibonacci retracement ratios. Draw AB=CD based on Fibonacci retracement you define. You can define margin of error allowed in Harmonic or Fibonacci calculations
FREE
PZ Penta O MT4
PZ TRADING SLU
2.33 (3)
The Penta-O is a 6-point retracement harmonacci pattern which usually precedes big market movements. Penta-O patterns can expand and repaint quite a bit. To make things easier this indicator implements a twist: it waits for a donchian breakout in the right direction before signaling the trade. The end result is an otherwise repainting indicator with a very reliable trading signal. The donchian breakout period is entered as an input. [ Installation Guide | Update Guide | Troubleshooting | FAQ | A
FREE
Bitcoin 999
Ahmed Ragab Ramadan Abdelfattah
Bitcoin 999  - is a trend indicator that automatically analyzes the market and provides information about the trend and each of its changes, as well as giving signals for entering trades without redrawing! The indicator uses each candle, analyzing them separately. referring to different impulses - up or down impulse. Exact entry points into transactions for currencies, crypto, metals, stocks, indices!  Main functions: Accurate entry signals WITHOUT REPAINTING! Once a signal appears, it remains
FREE
Major Support and Resistance Indicator
Ahmad Ar Abedalaziz Alazaizeh
This indicator filters the Zigzag indicator to calculate the main support and resistance levels. Variables minimum gap between peaks : is the distance (GAP) between the peaks of the Zigzag peaks sensitivity : Minimum number of nearby peaks look back: it means that it has to test the last 50 peaks in the Zigzag object name perfix: a prefix for level’s line name on chart
FREE
Pivot Pro MT4
Samil Bozuyuk
5 (3)
Draws Daily, Weekly and Monthly pivots and the respective supports and resistances levels (S1, S2, S3, R1, R2, R3). Ideal for placing stop losses and/or using as a break-out strategy. Features Unlike other pivot indicators in market you get very clean charts. Pivot levels are plotted irrespective of timeframe, on which you trade, i.e. M1, M5, M15, M30, H1,H4 or Daily timeframes. Pivot levels do not change when you change timeframe. Fully customizable options.    If you are looking at Fibonacci
FREE
SMC Structure Gap Monitor is a MetaTrader 4 indicator built to display SMC-style market structure with a clear focus on BOS, CHoCH, swing points and Fair Value Gaps. Core idea: the indicator helps traders read structural flow by combining HH, HL, LH and LL labeling with complete and incomplete FVG context, optional internal structure and buffers that can be used from the Data Window or by Expert Advisors. Quick Summary Product type MetaTrader 4 indicator Main focus Structure flow, BOS, CHoCH an
FREE
Best SAR
Ashkan Hazegh Nikrou
5 (3)
Koala Trading Solution 채널 에 가입하여 MQL5 커뮤니티에서 최신 신호 및 Koala 제품에 대한 소식을 확인하세요. 가입 링크는 아래에 있습니다: https://www.mql5.com/en/channels/koalatradingsolution 설명 :  우리는 외환 시장(PSAR)에서 전문적이고 인기 있는 지표 중 하나를 기반으로 하는 새로운 무료 지표를 도입하게 된 것을 기쁘게 생각합니다. 이 지표는 원래 포물선 SAR 지표에 대한 새로운 수정이며, 프로 SAR 지표에서 점과 가격 차트 사이의 교차를 볼 수 있습니다. 교차는 신호가 아니지만 이동 가능성의 끝을 말하는 것입니다. 새로운 파란색 점으로 매수를 시작하고 첫 번째 파란색 점 앞에 손절매를 1 attr 배치하고 마지막으로 점이 가격 차트를 교차하는 즉시 종료할 수 있습니다. 매수 또는 매도 신호를 여는 방법은 무엇입니까? 첫 번째 파란색 점으로 공개 매수 거래 및 첫 번째 빨간색 점으로 공개 매
FREE
Harmonic Signal Alerts MT4 is a free indicator for MetaTrader 4 that finds ABCD, Gartley and Bat patterns on the chart. When price reaches a pattern's potential reversal zone, it draws the XABCD lines, the zone and an arrow. It can also alert you. It works only from swings that are already confirmed and from closed bars. A pattern is drawn on the bar where it became known. It is never moved or removed afterwards. MetaTrader 4 edition: the same calculation and the same arrows as the MetaTrader 5
FREE
Donchian Trend Histogram
Mariusz Piotr Rodacki
Donchian channels are a tool in technical analysis used to determine the relative volatility of a market and the potential for price breakouts. Can help identify potential breakouts and reversals in price, which are the moments when traders are called on to make strategic decisions. These strategies can help you capitalize on price trends while having pre-defined entry and exit points to secure gains or limit losses. Using the Donchian channel can thus be part of a disciplined approach to managi
FREE
Variable Index Dynamic Average (VIDYA) is an original method of calculating the Exponential Moving Average (EMA) with the dynamically changing period of averaging, developed by Tushar Chande. The length of period in VIDYA depends on market volatility as indicated by the Chande Momentum Oscillator (CMO). Typical Signals VIDYA generates buy and sell signals when the price crosses over and under the bands: When the price crosses over the upper band of VIDYA, this can be interpreted as a signal to
FREE
Strength Graph
Zi Feng Ding
5 (1)
This indicator is a tool to measure the relative strength of different currency pairs. It present major currencies strength value base on their relative strength/weakness in custom period of time. Indicator parameters Strength Period - Change the strength period in the settings affects the number of bars used for calculation. The higher the period value, the smoother the indicator lines and the result will represent longer term strength of each currencies, rather than recent strength. Display O
FREE
무료 — ZigZag 스윙 피벗과 이동평균 추세 필터를 하나의 차트에 함께 그립니다. 피벗 돌파 시스템이 거래에 사용하는 피벗 레벨과 추세 배경을 보여줍니다. 금(XAUUSD)에 맞춰 조정했습니다. 완전 무료이며 제한이 없습니다. 차트에서 유용하다고 느끼셨다면 짧은 리뷰가 저희에게 가장 큰 도움이 됩니다. 30초면 충분하며, 다른 트레이더가 이 도구를 발견하는 유일한 경로입니다. 플랫폼: MetaTrader 4 (이 페이지). 피벗 돌파는 더 큰 추세와 같은 방향일 때에만 의미가 있습니다. 이 지표는 확정된 각 스윙 피벗을 표시하고 추세 이동평균을 그려서, 마지막 피벗의 돌파가 추세에 순응하는지 역행하는지를 한눈에 볼 수 있게 합니다. === 무엇을 그리는가 === - 확정된 ZigZag 스윙 고점과 저점(점) — 돌파 시스템이 반응하는 피벗. - 추세 이동평균(기본값 MA 50). === 확정된 피벗은 리페인트하지 않음 === 피벗은 해당 구간의 국지적 극값으로 확정된 후
FREE
RelicusRoad Trading Sessions는 MetaTrader 4와 MetaTrader 5용 거래 세션 지표로, M1, M5, M15 차트에서 Tokyo, London, New York 세션의 시작 시각을 점선 수직선으로 표시합니다. 각 세션의 시작은 오늘과 이전 평일들에 걸쳐, 해당 세션의 색으로 선, 작게 회전된 이름 라벨, 이벤트 마커로 표시됩니다. 마우스를 올리면 세션 이름과 시작 시각이 보입니다. 이 지표는 시작 시각만 표시하며 세션 범위, 겹침, 종료 시각은 음영으로 표시하지 않습니다. 작동 방식 지표는 로드될 때 브로커 서버 시간과 UTC 사이의 차이를 읽어 정시 단위로 반올림한 뒤 한 시간을 뺍니다. 그런 다음 현재 UTC 날짜에서 거슬러 올라가는 각 평일에 대해, 서버 시간으로 환산한 Tokyo 시작(23:00 UTC), London 시작(07:00 UTC), New York 시작(12:00 UTC)을 배치합니다. 토요일과 일요일은 건너뜁니다. Tokyo:
FREE
Daily Range Forecast는 오늘의 변동폭이 얼마나 클 것 같은지, 그중 얼마나 이미 움직였는지, 그리고 그날이 평소보다 커지는 두 가격을 보여 줍니다. 금에서는 금 히스토리로 검증한 내장 모델을 쓰고, 다른 모든 차트에서는 그 심볼 자체의 히스토리에 맞춥니다. 보여 주는 것 차트의 오늘 밴드: 오늘의 고가에서 예상 변동폭을 뺀 가격부터 오늘의 저가에 예상 변동폭을 더한 가격까지. 새로운 고가나 저가가 나올 때만 좁아지며, 어느 한쪽 가장자리를 넘으면 그날은 평소보다 큰 날입니다. 예상 변동폭은 그날 첫 봉에서 정해지고 하루 동안 바뀌지 않습니다. 히스토리: 최대 120일의 지난 날을 캔들 뒤에 부드러운 밴드로 표시합니다. 그날이 변동폭 안에 머물렀으면 초록색, 더 컸으면 호박색입니다. 화살표도 레이블도 없습니다. 작은 패널: 오늘의 예상 변동폭(달러, 통화쌍은 핍)과 퍼센트, 얼마나 움직였는지 보여 주는 막대, 그리고 두 가격. 금의 미국 발표일(CPI, 고용지표, 연준
FREE
RSI Bands MT4
Pierce Vallieres
RSI Bands is a powerful indicator which displays an upper and lower band corresponding to the RSI overbought and oversold levels. The band shows what price must be reached during that specific candle in order for the RSI overbought/oversold level to be reached. This is an extremely useful tool for spotting when a trend has begun and when a trend is about to end. The indicator provides buffers, allowing you to use it in your own Expert Advisor. Please message me if you have any questions. CURREN
FREE
The XR Gartley Pattern MT4 is an indicator which displays and alerts Gartley pattern detected on the candlestick chart. It also displays potential trade with calculated Take Profit and Stop Loss, Timeframe H1. After purchasing XR Gartley Pattern, you can immediately download this indicator from the MT4-MT5 Market and start using it because all features are set to default, is not necessary to change any parameter. List of all our available tools for Traders:   https://www.mql5.com/en/users/mqlblu
FREE
Price Deviation
Mikhail Pisarev
A very simple and intuitive indicator that shows the deviations from the moving average in percent. The default is a 50-day moving average. Just throw on the chart and the indicator build in a separate window under the graph. This can be very convenient if your strategy implies a certain deviation in percentage of the moving average. It is not very convenient to calculate it manually. The method of averaging, the period of the moving average and at what prices to build all this is selected in t
FREE
Trend Finding Channels
Muhammed Emin Ugur
4 (1)
The   Trend Finding Channels   indicator was developed to help you determine the trend direction by drawing channels on the graphical screen. It draws all channels that can be trending autonomously. It helps you determine the direction of your trend. This indicator makes it easy for you to implement your strategies. The indicator has Down trend lines and Up trend lines. You can determine the price direction according to the multiplicity of the trend lines. For example , if the Down trend lines s
FREE
The indicator uses the Chester W. Keltner's channel calculation method, modified by the well-known trader Linda Raschke. Due to the modification, the calculated channel contains a much more complete overview of the price movements, which allows increasing the probability of an accurate prediction of the upcoming price movement. Unlike the classic Keltner method, the base line of the channel is plotted based on the Exponential Moving Average, and the Average True Range is used to calculate the up
FREE
MT4 DeThrust StatsMood
Salvatore Colombo
5 (2)
DeThrust StatsMood — Impulse Exhaustion Detector for D1 DeThrust StatsMood is a MetaTrader 4 indicator optimized for the Daily (D1) timeframe, designed to identify potential exhaustion points following exceptionally strong directional moves in the Forex market. How it works The indicator detects when price experiences a statistically abnormal acceleration compared to the symbol’s historical behavior and signals the potential exhaustion of that impulse. This is not a conventional trend reversal i
FREE
AI Channels MT4
Duc Hoan Nguyen
5 (1)
제 MT4 및 MT5 지표를 모두 무료로 받으세요 — 방법 알아보기 새 도구의 가격   은   $30   이며, 혜택은   출시 첫 주   또는   첫 3건의 구매에 적용됩니다 !  MQL5 Trading Tools 채널 : 제 MQL5 채널에 가입하여 최신 소식을 받아보세요 AI Channels 지표는 클러스터링 분석의 강력한 머신 러닝 기술인 롤링 K-평균 클러스터링 을 활용하여 실시간으로 기초 가격 트렌드에 대한 통찰을 제공합니다. 이 지표는 클러스터링된 가격 데이터를 기반으로 적응형 채널을 생성하여, 트레이더가 트렌드 방향과 시장 상황에 대한 정보를 바탕으로 결정을 내릴 수 있도록 합니다. 지표 설정에는 트레일링 스탑 옵션 도 포함되어 있어 리스크 관리에 추가적인 유연성을 제공합니다. MT5 버전 보기:     AI Channels MT5 다른 제품 보기:     모든 제품 AI Channels 지표 사용 방법 각 채널의 극단 값은 트렌드 방향을 결정하는 데 유용한 정보를
FREE
We Trade Live Trend Levels
Ian Andrew Nicholson
5 (1)
We Trade Live Trend Levels  This indicator is a fantastic addition to the We Trade Live Trend Max this helps filter out noise and helps with better entries into a trade this add on is a must have and we use it all the time along side We Trade Live Trend Max this is a fantastic tool to help with entering a trade and exiting a trade,  This indicator Calculates  Volume strength  indicating levels of support and resistance for a trade, measures momentum in a market making buying or selling into the
FREE
숙련된 트레이더라도 중요한 다이버전스를 놓칠 수 있습니다. True RSI Divergence는 새로운 신호를 자동으로 감지하고 즉시 알림을 제공하며, 단순히 더 많은 신호를 생성하는 것이 아니라 의미 있는 고품질 다이버전스를 찾는 데 중점을 둡니다. RSI 다이버전스는 잠재적인 추세 반전과 추세 지속을 식별하기 위해 가장 널리 사용되는 기술적 분석 신호 중 하나입니다. 그러나 여러 종목과 여러 시간대를 동시에 수동으로 모니터링하는 것은 사실상 불가능합니다. 하나의 차트를 분석하는 동안 다른 차트에서는 이미 높은 품질의 다이버전스가 형성될 수 있습니다. True RSI Divergence는 시장을 지속적으로 스캔하며 새로운 다이버전스가 감지되면 자동으로 알림을 제공합니다. 따라서 거래 플랫폼 앞에 있지 않더라도 중요한 매매 기회를 놓치지 않을 수 있습니다. 하지만 신속한 알림도 감지된 신호가 실제로 주목할 만한 가치가 있을 때에만 의미가 있습니다. 많은 다이버전스 지표는 거의 모든
FREE
MT4 Squeeze detector FREE
Grzegorz Korycki
4.5 (4)
What is Squeeze? A contraction of the Bollinger Bands inside the Keltner Channel reflects a market taking a break and consolidating, and is usually seen as a potential leading indicator of subsequent directional movement or large oscillation movement. When Bollinger bands leave Keltner Channel, it means markets switching from a low volatility to high volatility are something all traders are looking for. Differences Squeeze FREE Squeeze Squeeze PRO How many different timeframes 1 5 10 Custom
FREE
HZZ
Nikolay Likhovid
3.5 (2)
This is a very fast and not redrawing ZiGZag; it supports switching the segments at breakouts of price levels located at a specified distance (H parameter) from the current extremum. MinBars parameter sets the depth of history for drawing the indicator; 0 means drawing on the entire history. SaveData parameter allows writing the coordinates of extremums to a file (time in the datatime format and price). Some statistics calculated on the basis of the ZigZag is displayed in the form of comments.
FREE
KeltnerChannelIndicator
Todd Terence Bates
3 (2)
The Keltner Channel is a volatility-based technical indicator composed of three separate lines. The middle line is an exponential moving average (EMA) of the price. Additional lines are placed above and below the EMA. The upper band is typically set two times the Average True Range (ATR) above the EMA, and the lower band is typically set two times the ATR below the EMA. The bands expand and contract as volatility (measured by ATR) expands and contracts. Since most price action will be encompasse
FREE
Extremum Reverse Bar
Yurij Izyumov
2.8 (5)
This indicator has been created for finding the probable reversal points of the symbol price. A small candlestick reversal pattern is used it its operation in conjunction with a filter of extremums. The indicator is not redrawn! If the extremum filter is disabled, the indicator shows all points that have a pattern. If the extremum filter is enabled, the condition works – if the history Previous bars 1 candles back contains higher candles and they are farther than the Previous bars 2 candle, such
FREE
Head and Shoulders Pattern Indicator - Your Key to Recognizing Trend Reversals Unlock the power of pattern recognition with the "Head and Shoulders Pattern Indicator." This cutting-edge tool, designed for MetaTrader, is your trusted ally in identifying one of the most powerful chart patterns in technical analysis. Whether you're a novice or an experienced trader, this indicator simplifies the process of spotting the Head and Shoulders pattern, allowing you to make informed trading decisions. Key
FREE
OsMA Arrow
Pavel Shutovskiy
3.83 (6)
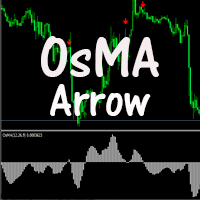
The indicator displays crossing zero level by Moving Average of Oscillator (OsMA) in the form of arrows. The indicator notifies about a signal by means of a pop-up Alert window, or sending notification to e-mail. Parameters Fast EMA Period - fast EMA. This is an exponential moving average from a price with a short period. Slow EMA Period - slow EMA. This is also an exponential moving average of a market price but with a longer period. Signal SMA Period - MACD SMA. This is a signal line which is
FREE
UPD1 D Levels
Vitaliy Kuznetsov
5 (3)
레벨 인디케이터는 전일 데이터를 기준으로 합니다. 수학 공식에 따라 진입 및 청산 레벨이 결정됩니다.  트레이딩 추천. 레벨은 변동성이 나타날 때 유럽 세션이 시작될 때 거래됩니다. 변동성이 충분하지 않은 경우 테이크프로핏의 절반을 사용하여 종료합니다. 가격이 절반 테이크프로핏에서 반전했다면 반전 시 목표가도 절반 테이크프로핏 수준에서 설정합니다. 가격이 진입 가격에서 반등했다면 반대 방향으로 가격이 두 번째 테이크프로핏에 도달할 수 있습니다. 항상 브레이크 아웃에 진입해서는 안됩니다. 재테스트(레벨 돌파 후 반대쪽에서 테스트)를 기다리는 것이 좋습니다. 재테스트는 시장에 최소 거래량 레벨이 여러 개 있는 경우 잘 작동합니다. UPD1 프로필 레벨 표시기를 참조하세요. 입력 매개변수. Start Hour - 몇 시부터 하루의 시작을 계산합니다. 00 - 기본값. Visual Button - 버튼 표시(활성화/비활성화). Corner - 버튼 앵커 각도. X indent -
FREE
이 제품의 구매자들이 또한 구매함
Trend SniperX MT4
Sarvarbek Abduvoxobov
5 (5)
Trend Sniper X 는 트레이더가 명확하고 정확하게 트렌드 방향과 잠재적 반전 지점을 포착할 수 있도록 돕는 MetaTrader 5 전용 멀티 타임프레임 추세 추종 지표입니다. MT5 버전 링크: https://www.mql5.com/en/market/product/181101 가격 안내: 현재 가격은 프로모션 할인가이며, 향후 업데이트 및 새 기능 출시 시 인상될 수 있습니다. Code2Profit 채널 멀티 타임프레임 분석으로 시장을 정복하세요! Trend Sniper X로 승률을 극대화하는 방법: 핵심 규칙 및 세션 팁 기술 사양 플랫폼 MetaTrader 5 지표 유형 멀티 타임프레임 추세 지표 작동 타임프레임 모든 차트 타임프레임 (상위 타임프레임 M1–MN1 독립 선택 가능) 주요 종목 외환(Forex), 골드(XAUUSD) 및 기타 CFD 추천 계좌 모든 계좌 유형 시각화 컬러 추세 캔들 (매수/매도/약세/변화) + 매수/매도 화살표 추가 모듈 세션 마켓 박스 (
Currency Strength Wizard
Oleg Rodin
4.85 (61)
통화 강도 마법사는 성공적인 거래를 위한 올인원 솔루션을 제공하는 매우 강력한 지표입니다. 표시기는 여러 시간 프레임의 모든 통화 데이터를 사용하여 이 또는 해당 외환 쌍의 힘을 계산합니다. 이 데이터는 특정 통화의 힘을 확인하는 데 사용할 수 있는 사용하기 쉬운 통화 지수 및 통화 전력선의 형태로 표시됩니다. 필요한 것은 거래하려는 차트에 표시기를 부착하는 것뿐입니다. 표시기는 거래하는 통화의 실제 강세를 보여줍니다. 지표는 또한 추세와 거래할 때 유리하게 사용할 수 있는 구매 및 판매 거래량 압력의 극한값을 보여줍니다. 지표는 또한 피보나치에 기반한 가능한 대상을 보여줍니다. 표시기는 PUSH 알림을 포함한 모든 유형의 알림을 제공합니다. 구매 후 연락주세요. 나는 당신과 거래 팁을 공유하고 당신에게 무료로 훌륭한 보너스 지표를 줄 것입니다! 나는 당신에게 행복하고 유익한 거래를 기원합니다!
Scalper Vault
Oleg Rodin
5 (40)
Scalper Vault는 당일 매매(intraday trading)에서 일관된 성과를 내고자 하는 트레이더를 위해 설계된, 강력하고 모든 기능을 갖춘 트레이딩 시스템입니다. 이 고정밀 지표는 외환(Forex) 및 바이너리 옵션 트레이더 모두에게 기관급 분석을 제공하는 독립적인 종합 트레이딩 시스템 역할을 합니다. 구매 후 저에게 연락해 주시면, 트레이딩 팁과 함께 특별한 보너스를 제공해 드립니다! Scalper Vault는 추측에 의존하거나 복잡한 수동 분석을 할 필요를 없애주며, 사용하기 쉬운 트레이딩 기법을 통해 오직 매매 실행에만 집중할 수 있도록 돕습니다. 정확한 추세 추종 신호: 핵심 알고리즘이 시장 구조를 분석하여, 지배적인 시장 추세 방향과 일치하는 고확률 신호만을 제공함으로써 잘못된 진입을 획기적으로 줄여줍니다. 정밀한 고점 및 저점 탐지: 시장의 움직임이 소진되는 지점을 스캔하여 잠재적인 반전 구간을 식별합니다. 간(Gann) 이론 기반의 매수/매도 구간: 수학적
현재 30% 할인 ! 초보자 또는 전문가 트레이더를 위한 최고의 솔루션! 이 대시보드 소프트웨어는 28개의 통화 쌍에서 작동합니다. 2가지 주요 지표(Advanced Currency Strength 28 및 Advanced Currency Impulse)를 기반으로 합니다. 전체 Forex 시장에 대한 훌륭한 개요를 제공합니다. 고급 통화 강도 값, 통화 이동 속도 및 모든(9) 시간대의 28 Forex 쌍에 대한 신호를 보여줍니다. 추세 및/또는 스캘핑 기회를 정확히 파악하기 위해 차트의 단일 지표를 사용하여 전체 시장을 볼 수 있을 때 거래가 어떻게 개선될지 상상해 보십시오! 잠재적인 거래를 식별하고 확인하면서 강력한 통화와 약한 통화를 더욱 쉽게 식별할 수 있도록 이 지표에 기능을 내장했습니다. 이 표시기는 통화의 강세 또는 약세가 증가 또는 감소하는지 여부와 모든 시간대에서 수행되는 방식을 그래픽으로 보여줍니다. 추가된 새로운 기능은 현재 시장 조건 변화에 적응하는
Zoryk Gold mt4
Reda El Koutbane
5 (3)
ZORYK — MetaTrader 4용 XAUUSD 전문 신호 및 트레이드 플래닝 시스템 이런 경험이 있을 것입니다. 골드를 분석하고 진입을 기다린 뒤 마침내 포지션을 열었지만 가격이 곧바로 반대 방향으로 움직입니다. 너무 일찍 청산하거나 Stop Loss를 옮기거나 몇 초 동안 망설입니다. 그 후 시장은 내가 없이도 처음 예상했던 목표까지 정확히 움직입니다. 문제는 항상 방향이 아니었습니다. 진짜 문제는 불확실성이었습니다. 정확한 진입 위치를 몰랐습니다. 어느 지점에서 원래의 트레이드 아이디어가 무효가 되는지 몰랐습니다. 가까운 수익을 확보해야 할지 더 큰 움직임을 기다려야 할지 판단하기 어려웠습니다. 현재 setup이 정말 강한지 아니면 단지 새로운 거래를 억지로 찾고 있는지도 확신하기 어려웠습니다. 골드는 매우 빠르게 움직입니다. 명확한 계획이 없다면 좋은 분석도 몇 초 만에 나쁜 결정으로 바뀔 수 있습니다. ZORYK는 이 문제를 해결하기 위해 개발되었습니다.
PZ Turning Points MT4
PZ TRADING SLU
1 (1)
Identify key turning points with reliable fractal analysis This indicator examines the price structure of fractals of different periods to determine possible reversal points in the market, providing timing to positional traders that already have a fundamental or technical valuation model. Unlike its younger brother, Reversal Fractals , this indicator won't miss reversals because of the period selected, and will find reversal fractals on a zig-zag fashion, ignoring those reversals which do not
Trend Lines PRO
Roman Podpora
5 (2)
트렌드 라인즈 프로       이 지표는 시장이 실제로 어떤 방향으로 전환되는지 파악하는 데 도움이 됩니다. 실제 추세 반전 지점과 주요 시장 참여자들이 다시 진입하는 지점을 보여줍니다. 보시다시피       BOS 라인       복잡한 설정이나 불필요한 노이즈 없이 더 높은 시간대의 추세 변화와 주요 레벨을 확인할 수 있습니다. 신호는 차트에 다시 그려지지 않고 캔들이 마감된 후에도 계속 표시됩니다. VERSION MT 5   -   RFI LEVELS PRO   표시기   와 결합할 때 최대 잠재력을 발휘합니다. 지표가 보여주는 내용: 실제 변화       추세(BOS 라인) 한 번 신호가 나타나면 그 신호는 계속 유효합니다! 이는 신호를 발생시킨 후 변경될 수 있는 리페인팅 방식의 지표와 중요한 차이점입니다. 리페인팅 방식의 지표는 잠재적으로 자금 손실로 이어질 수 있습니다. 이제 더욱 높은 확률과 정확도로 시장에 진입할 수 있습니다. 또한 화살표가 나타난 후 목표가(익절)
Smart Trend Trading System
Issam Kassas
4.8 (10)
Smart Trend Trading System은 추세 정보, 진입·청산 신호, 가격 수준을 하나의 차트에 표시하는 MetaTrader 4용 지표입니다. 이 시스템은 추세 감지, 반전 구간, Smart Cloud, 트레일링 스톱 로직, 지지와 저항, 캔들 색상 표시, 알림, 다중 시간대 분석 등 10개 이상의 트레이딩 도구 를 하나의 시스템으로 결합합니다. 이 시스템은 다양한 시장 상황에서 거래를 돕도록 설계되었습니다: 추세장: 주요 추세를 식별하고, 되돌림을 감지하며, 모멘텀을 따라가고, 손절 가이드와 트레일링 스톱 옵션을 사용해 더 깔끔한 진입 지점을 찾습니다. 횡보장: 박스권 시장 상황을 감지하고, 반응 구간을 식별하며, 가격이 중요한 레벨에서 반응할 때 더 명확한 신호를 받을 수 있습니다. 스캘핑 및 인트라데이 거래: 빠른 신호, 캔들 색상, 알림, 다중 시간대 확인을 사용하여 단기 거래 결정을 지원합니다. 주요 기능: • 10개 이상의 인디케이터를 하나의 트레이딩 시스
SR Liquidity
Oleg Rodin
5 (2)
SR Liquidity 는 시장 유동성이 집중되고 가격이 가장 강력하게 반응하는 숨겨진 구간을 포착하도록 설계된 트레이딩 지표입니다. 이러한 특수 유동성 구간은 강력한 지지 및 저항선 역할을 하며, 시장 반전 가능성이 가장 높은 지점을 명확하게 보여주는 지도가 되어 줍니다. SR Liquidity는 일반적인 지지 및 저항선을 단순히 그리는 대신, 실제 가격 움직임을 분석하여 매수 및 매도 압력이 집중되는 구간을 포착합니다. 이러한 구간은 실질적인 시장의 흐름을 주도하는 유동성 풀(liquidity pools)에 해당합니다. 이 지표는 해당 구간을 차트에 직접 시각화하여, 가격 반응이 실제로 나타나기 전에 이를 미리 예측할 수 있도록 돕습니다. 즉, 가격 추세가 전환될 가능성을 사전에 파악하게 해주는 것입니다. 결과적으로 이 지표는 가공되지 않은 가격 움직임(price action)을 시장의 핵심 가격대, 다시 말해 추세 전환점이 될 수 있는 지점들을 보여주는 명확하고 실용적인 로드맵
AW Prime Oscillator
AW Trading Software Limited
5 (1)
두 개의 오실레이터의 조합. 첫 번째 항목은 진입점을 표시하고 두 번째 항목은 현재 추세를 표시합니다. 표시기는 두 가지 모드의 화살표로 오실레이터 신호를 표시할 수 있습니다. 모든 빠른 오실레이터 신호 또는 현재 추세 방향의 신호만 표시할 수 있습니다. 다중 시간대 패널과 세 가지 유형의 신호 알림이 있습니다. 이익: 일일 및 스캘핑 거래에 적합 추세 필터링 간단하고 민감한 설정 다중 시간대 패널 Advisor에 통합하는 데 적합합니다. 모든 기호 및 기간에서 작동합니다. 세 가지 유형의 알림 MT5 version ->  HERE  / Problem solving ->  HERE 지표 전략 표시기는 두 개의 서로 다른 오실레이터로 구성됩니다. 느린 추세선(두꺼움) - 지표의 고수준이 위에서 아래로 교차하면 하락세 지표이고, 낮은 수평 수준(지표의 낮은 수준)이 아래에서 위로 교차하면 하락 추세 지표입니다. 상승 경향. 또한, 하단 영역에서 느린 선을 발견하면 현재 추세가 하락세임을
PRO Renko System
Oleg Rodin
5 (31)
PRO Renko System 은 RENKO 차트 거래를 위해 특별히 고안된 매우 정확한 거래 시스템입니다. 이것은 다양한 거래 상품에 적용될 수있는 보편적 인 시스템입니다. 체계는 효과적으로 당신에게 정확한 반전 신호에 접근을 주는 소위 시장 소음을 중화합니다. 이 표시기는 사용하기가 매우 쉽고 신호 생성을 담당하는 매개 변수가 하나만 있습니다. 당신은 쉽게 당신의 선택의 어떤 무역 계기에 공구를 적응시킬 수 있고 renko 막대기의 크기. 나는 항상 당신이 내 소프트웨어로 수익성있게 거래 할 수 있도록 추가 지원을 제공 할 준비가되어 있습니다! 나는 당신에게 행복하고 수익성있는 거래를 기원합니다! 구매 후 저에게 연락하십시오! 내 렌코 차트 생성기를 보내드립니다. 또한 내 개인 권장 사항 및 시스템의 다른 모듈을 무료로 공유 할 것입니다!
M1 Sniper
Oleg Rodin
4.97 (30)
M1 SNIPER 는 사용하기 쉬운 거래 지표 시스템입니다. M1 시간대에 맞춰 설계된 화살표 지표입니다. 이 지표는 M1 시간대 스캘핑을 위한 단독 시스템으로 사용할 수 있으며, 기존 거래 시스템의 일부로도 사용할 수 있습니다. 이 거래 시스템은 M1 시간대 거래용으로 특별히 설계되었지만, 다른 시간대에도 사용할 수 있습니다. 원래는 XAUUSD와 BTCUSD 거래를 위해 이 방법을 설계했지만, 다른 시장 거래에도 유용하다는 것을 알게 되었습니다. 이 지표의 신호는 추세 방향과 반대로 거래될 수 있습니다. 저는 지표의 신호를 활용하여 양방향으로 거래할 수 있도록 돕는 특별한 거래 기법을 알려드립니다. 이 방법은 특별한 동적 지지선과 저항선 가격 영역을 활용하는 것을 기반으로 합니다. 구매하시면 M1 SNIPER 화살표 지표를 바로 다운로드하실 수 있습니다. 또한, 아래 스크린샷에 표시된 Apollo Dynamic SR 지표는 M1 SNIPER 도구를 사용하는 모든 사용자에게 무료로
SIO Oscillator: 자기 최적화 세미분산 불균형 오실레이터 지표를 구매하시면 이를 기반으로 한 전문가 어드바이저(EA)를 무료로 받으실 수 있습니다. 대부분의 오실레이터는 모든 가격 움직임을 똑같이 취급합니다. SIO는 상승 압력과 하락 압력을 분리하여 둘 사이의 불균형을 측정하고, 매수자와 매도자 중 어느 쪽이 실제로 시장을 주도하고 있는지 보여줍니다. 불균형이 극단에 도달하면 SIO는 진입가, 손절(Stop Loss), 익절(Take Profit) 수준이 포함된 명확한 신호를 표시합니다. SIO의 차별점은 고정된 설정에 의존하지 않는다는 것입니다. 내장된 자기 최적화 엔진이 현재 종목과 시간 프레임에 맞는 파라미터를 지속적으로 탐색하고, 사용하기 전에 검증합니다. 두 가지 신호 모드 평균 회귀(Mean Reversion): 불균형의 극단에서 거래하며 균형으로의 복귀를 노립니다. 추세 추종(Trend Following): 지속적이고 우세한 불균형의 방향으로 거래합니다. 자
Neo Wave PRO
Nikolay Raykov
5 (1)
Price & Time Market Structure Indicator A professional market structure tool that analyzes waves through both price and time — not price alone. Main Description NeoWave PRO is a professional market structure indicator for MetaTrader 4 designed for traders who want to move beyond traditional one-dimensional wave tools such as ZigZag, swing indicators, and basic high/low systems. Most wave indicators analyze only one thing: Price. But a real market wave is not only a price movement. A true wave de
Gann Time Clusters
Martin Eshleman
2.5 (2)
Gann Time Clusters Indicator This indicator is based on W. D. Gann's Square of 9 method for the time axis. It uses past market reversal points and applies the mathematical formula for Gann's Square of 9 and then makes projections into the future. A date/time where future projections line up is called a 'time cluster'. These time clusters are drawn as vertical lines on the right side of the chart where the market has not advanced to yet. A time cluster will result in a market reversal point (ex.
CRT Candle Range Theory HTF MT4 - Ultimate CRT Indicator: 고급 ICT 개념 및 Malaysian SnR 트레이딩 시스템 가장 진보된 Candle Range Theory 지표로 마켓 메이커의 발자취를 마스터하십시오. Ultimate CRT Indicator를 사용하여 Smart Money Concepts(SMC)의 진정한 힘을 발휘하고 기관처럼 정확하게 거래하십시오. 진지한 트레이더를 위해 독점적으로 제작된 이 지표는 ICT Concepts(Inner Circle Trader)의 핵심 기둥인 매우 효과적인 Candle Range Theory(CRT)를 자동화하고 Malaysian Support and Resistance(SnR) 진입 방법과 FVG(Imbalance) 영역의 치명적인 정밀도로 이를 강화합니다. MT4 또는 MT5에서 Forex, Crypto 또는 지수를 거래하든 이 알고리즘은 시장 소음을 제거하고 가짜 돌파(fakeout)
Atomic Analyst
Issam Kassas
5 (14)
Atomic Analyst — MetaTrader 4 제품 문의, 설정 안내 또는 기술 지원이 필요하면 MQL5에서 직접 메시지를 보내 주세요. 이 인디케이터는 복잡한 시장 계산을 단순한 시각적 신호, 색상 표시 캔들, 추세 판독, 손절 레벨 및 여러 익절 구간으로 변환하여 트레이더가 빠르게 이해하고 실제 시장 상황에서 사용할 수 있게 합니다. 주요 거래 용도: 스캘핑 및 인트라데이 거래: 빠른 의사결정, 명확한 화살표, 알림, 캔들 색상 및 구조화된 진입/청산 구간을 위해 설계되었습니다. 데이 트레이딩 및 스윙 트레이딩: 추세 방향, 강도, 모멘텀 및 다중 시간대 분석을 사용하여 더 큰 시장 움직임을 따라갈 수 있도록 돕습니다. 주요 기능: • Price Action, 강도 및 모멘텀 분석 • 다중 시간대 추세 스캐너 • 전체 추세 비율 계산 • 매수 및 매도 화살표 • 손절 및 여러 익절 레벨 • 최대 5개의 피보나치 기반 익절 레벨 • 트레일링 스톱 로직 • 추세 및 모멘텀
Forex Breath System
Oleg Rodin
5 (6)
Forex Breath System 은 모든 시장에서 사용할 수 있는 추세 기반 거래 시스템입니다. 이 시스템은 통화, 금속, 원자재, 지수, 암호화폐, 심지어 주식에도 사용할 수 있습니다. 또한 어떤 시간대에도 사용할 수 있습니다. 이 시스템은 보편적입니다. 추세를 보여주고 추세와 함께 화살표 신호를 제공합니다. 또한 이 지표는 신호가 추세 방향으로 나타날 때 특별한 유형의 경고를 제공하여 추세 거래를 쉽게 만들어줍니다. 이 표시기는 이해하기 어려운 설정을 전혀 처리할 필요가 없으므로 사용하기가 매우 쉽습니다.  차트에 첨부하기만 하면 거래 준비가 완료됩니다. 어떤 거래 스타일을 선호하든 시스템은 시장 방향과 추세 방향에서 가능한 진입점을 확인하는 데 도움이 됩니다. 표시기는 PUSH 알림을 포함한 모든 유형의 경고를 제공합니다. 거래 지침과 큰 보너스를 받으려면 구매 후 저에게 연락하십시오! 행복하고 수익성 있는 거래를 기원합니다!
Imbalance Pro
Ivan Stefanov
5 (4)
이 인디케이터는 선택한 기간 동안 상승과 하락 사이의 불균형을 측정하고 두 지점 사이의 직선을 표시합니다. 상승세가 하락세보다 거래량이 많으면 선이 녹색으로 바뀝니다.  하락세가 더 많으면 빨간색으로 표시됩니다. 이 선은 거래량의 백분율 차이도 표시합니다. 표시기는 별도의 창에 동일한 데이터를 표시합니다. 분할된 볼륨도 볼 수 있습니다. 표시기에는 두 가지 모드가 있습니다. 이를 위해 왼쪽 상단에 버튼이 있습니다,  - 누르지 않으면 시장의 임의의 지점과 현재 가격 사이의 불균형을 측정합니다.  - 버튼을 누르면 선택한 시장의 두 지점 사이의 잔액을 측정할 수 있습니다. 이 인디케이터는 선택한 기간 동안 상승과 하락 사이의 불균형을 측정하고 두 지점 사이의 직선을 표시합니다. 상승세가 하락세보다 거래량이 많으면 선이 녹색으로 바뀝니다.  하락세가 더 많으면 빨간색으로 표시됩니다. 이 선은 거래량의 백분율 차이도 표시합니다. 표시기는 별도의 창에 동일한 데이터를 표
Advanced Currency IMPULSE with ALERT
Bernhard Schweigert
4.9 (491)
현재 40% 할인!! 초보자 또는 전문가 트레이더를 위한 최고의 솔루션! 이 지표는 우리가 독점 기능과 비밀 공식을 통합했기 때문에 독특하고 고품질이며 저렴한 거래 도구입니다. 단 하나의 차트로 28개 통화 쌍 모두에 대한 경고를 제공합니다. 새로운 추세 또는 스캘핑 기회의 정확한 트리거 포인트를 정확히 찾아낼 수 있기 때문에 거래가 어떻게 개선될지 상상해 보십시오! 새로운 기본 알고리즘을 기반으로 구축되어 잠재적인 거래를 훨씬 더 쉽게 식별하고 확인할 수 있습니다. 이는 통화의 강세 또는 약세가 가속되는지 여부를 그래픽으로 표시하고 가속 속도를 측정하기 때문입니다. 자동차의 속도계처럼 생각하면 됩니다. 가속화할 때 Forex 시장에서 동일한 일이 분명히 더 빠르게 발생합니다. 즉, 반대 방향으로 가속화되는 통화를 페어링하면 잠재적으로 수익성 있는 거래를 식별한 것입니다. 통화 모멘텀의 수직선과 화살표가 거래를 안내합니다! 역동적인 Market Fibonacci 23 레벨은
Super Signal – Skyblade Edition 전문가용 노리페인트 / 노래그 트렌드 신호 시스템, 뛰어난 승률 제공 | MT4 / MT5용 1분, 5분, 15분과 같은 낮은 타임프레임에서 가장 좋은 성능을 보입니다. 핵심 기능: Super Signal – Skyblade Edition은 추세 매매를 위해 설계된 스마트 신호 시스템입니다. 이 시스템은 다중 필터 로직을 활용하여, 명확한 방향성과 실질적인 모멘텀이 수반된 고품질 추세만을 감지합니다. 이 시스템은 고점 또는 저점을 예측하지 않으며 , 다음 세 가지 조건이 모두 충족될 때만 신호를 발생시킵니다: 명확한 추세 방향 강화되는 모멘텀 건전한 변동성 구조 또한, 시장 세션 기반의 유동성 분석을 통해 신호의 신뢰성과 타이밍을 더욱 향상시킵니다. 신호 특성: 모든 화살표 신호는 100% 리페인트 없음 / 지연 없음 신호가 한 번 발생하면 고정되며, 깜빡이거나 사라지지 않음 차트 상의 시각적 화살표, 정보 패널, 팝업 알
Tokyo mt4 Indicator
Vasiliy Strukov
5 (9)
Tokyo Indicator는 추세 방향, 잠재적 거래 신호 및 시장 상황을 명확하고 시각적으로 보여줍니다. 색상으로 구분된 계단식 추세선은 강세 구간(파란색)과 약세 구간(자홍색)을 명확히 구별해 줍니다. 추세가 전환될 때 나타나는 방향성 화살표는 잠재적인 매수 및 매도 기회를 강조하여 보여줍니다. 통합 대시보드는 현재 신호, 시장 성향(bias), 모멘텀, 변동성, 신호 품질 등의 정보를 한눈에 파악할 수 있도록 구성되어 있습니다. 이를 통해 트레이더는 별도의 패널을 오갈 필요 없이 가격 움직임(price action)과 지표의 데이터를 동시에 분석할 수 있습니다. 깔끔한 차트 화면과 간결한 시장 개요를 제공하는 Tokyo Indicator는 체계적인 추세 분석과 거래 결정을 지원합니다. 모든 시간대와 다양한 자산(특히 금)에서 활용할 수 있습니다. 추세 방향, 잠재적 거래 신호 및 시장 상황을 명확하고 시각적으로 보여줍니다. 색상으로 구분된 계단식 추세선은 강세 구간(파란색)
Liquidity Scalper System
Stanislav Konin
5 (2)
Liquidity Scalper System: 인디케이터 형식의 유동성 기반 트레이딩 시스템입니다. 대부분의 인디케이터는 화살표만 보여주고, 손절을 어디에 둘지, 목표가 어디인지, 신호를 믿어도 되는지는 트레이더가 스스로 판단해야 합니다. Liquidity Scalper System은 거래의 전체 주기를 다룹니다. 유동성 풀을 찾고, 돌파 시 신호를 주며, Entry, Stop Loss와 세 개의 목표를 즉시 계산하고, 패널에 통계와 새로운 데이터에 대한 검증 결과를 표시합니다. 설정은 시스템이 스스로 선택하고 매일 업데이트합니다. 작동 방식 1. 시스템이 유동성 풀을 찾습니다. 시장 참여자들의 스톱 주문이 쌓여 있는 레벨입니다. 2. 가격이 풀을 돌파하고 그 돌파가 움직임의 강도(필요 시 거래량)로 확인되면 차트에 BUY 또는 SELL 화살표가 나타납니다. 3. Entry, Stop Loss, TP1, TP2, TP3 레벨이 영역 채우기와 함께 즉시 그려집니다. 4. 오른쪽에 유
Gann Made Easy
Oleg Rodin
4.84 (174)
Gann Made Easy 는 mr.의 이론을 사용하여 최고의 거래 원칙을 기반으로 하는 전문적이고 사용하기 쉬운 Forex 거래 시스템입니다. W.D. 간. 이 표시기는 Stop Loss 및 Take Profit Levels를 포함하여 정확한 BUY 및 SELL 신호를 제공합니다. PUSH 알림을 사용하여 이동 중에도 거래할 수 있습니다. 구매 후 거래 방법 안내 및 유용한 추가 지표를 무료로 받으시려면 저에게 연락주세요! 아마도 Gann 거래 방법에 대해 이미 여러 번 들었을 것입니다. 일반적으로 Gann의 이론은 초보자 거래자뿐만 아니라 이미 거래 경험이 있는 사람들에게도 매우 복잡한 것입니다. Gann의 거래 방식은 이론적으로 적용하기 쉽지 않기 때문입니다. 나는 그 지식을 연마하고 Forex 지표에 최고의 원칙을 적용하기 위해 몇 년을 보냈습니다. 표시기는 적용하기가 매우 쉽습니다. 차트에 첨부하고 간단한 거래 권장 사항을 따르기만 하면 됩니다. 지표는 지속적으로 시장 분석
Elliott Live 는 MetaTrader 5용 인디케이터로, 과거 차트와 현재 봉 모두에서 엘리엇 파동을 자동으로 표시합니다. 완성된 파동은 실선으로, 형성 중인 파동은 점선과 물음표 라벨(예: "3?")로 그려지며, 피보나치 목표 구간과 무효화 레벨도 함께 표시됩니다. MT5-version:  https://www.mql5.com/en/market/product/200604 작동 방식 먼저 스윙(ZigZag)을 만듭니다. 가격이 극값에서 ATR × 배수 이상 되돌림하면 반전으로 인식합니다. 마지막 점은 현재의 극값으로, 아직 확정되지 않았으며 움직일 수 있습니다. 이 스윙 위에서 엘리엇 규칙에 따라 충격파 1-2-3-4-5를 찾습니다. 2파는 1파의 시작점을 넘지 않고, 3파는 가장 짧은 파동이 되지 않으며, 4파는 1파의 영역에 들어가지 않습니다. 충격파 다음에는 조정파 A-B-C를, 그다음에는 다음 충격파를 찾습니다. 최근 스윙이 패턴의 일부(예: 1-2)만 이루고 있으
Gold Channel XAUUSD
Paulo Rocha
5 (4)
Gold Channel is a volatility-based indicator, developed with a specific timing algorithm for the XAUUSD pair, which consists of finding possible corrections in the market. This indicator shows two outer lines, an inner line (retracement line) and an arrow sign, where the theory of the channel is to help identify overbought and oversold conditions in the market. The market price will generally fall between the boundaries of the channel. If prices touch or move outside the channel it is a tradi
Follow Trend Steps Follow Trend Steps: See Your Price Zones Before the Market Moves Plan your trades around clear price zones, not guesswork. Follow Trend Steps draws clean, color-coded zones directly on your chart, showing where price has recently turned and where it may react again, so you can plan entries, exits and risk with confidence. Available for Meta Trader 4 and Meta Trader 5. Why traders use Follow Trend Steps Every chart is full of noise. Support and resistance lines are drawn diff
이 지표는 8개 주요 통화(USD, EUR, GBP, AUD, NZD, CAD, CHF, JPY)의 상대적 강세를 보여줍니다. 힘 값은 0~100 범위에서 정규화됩니다. 60 이상의 값은 강함을 의미합니다. 40 미만의 수치는 약점을 나타냅니다. 기본 원리 USD,EUR,GBP,AUD,NZD,CAD,CHF,JPY의 8개 통화가 주어지고 각 통화 쌍을 결합하여 총 28개 통화 쌍이 생성되며 역알고리즘을 사용하여 8개 통화의 강도를 추출합니다. 이 28쌍 중에서 EURUSD,GBPUSD,AUDUSD,NZDUSD, USDCAD,USDCHF,USDJPY,EURGBP, EURAUD,EURNZD,EURCAD,EURCHF, EURJPY,GBPAUD,GBPNZD,GBPCAD, GBPCHF,GBPJPY,AUDNZD,AUDCAD, AUDCHF,AUDJPY,NZDCAD,NZDCHF, NZDJPY,CADCHF,CADJPY,CHFJPY 주요 용도 강도 값이 60 이상이면 강함을 의미하고, 40 미만은 약
Liked the logic of this tool? Explore the full ecosystem of professional indicators and utilities created by a trader for traders: All products by the author on MQL5 Market: https://www.mql5.com/en/users/musa1994/seller Details and trading philosophy: https://developer-mql4-mql5.netlify.app/ Professional Delta Volume MTF v2.0 is a professional indicator for MetaTrader 4 that shows the difference between buy and sell volume (Delta Volume) and Cumulative Delta. Version 2.0 introduces f
Sniper Flip Zones
Leandro Bernardez Camero
5 (2)
Sniper Flip Zones – 정밀한 매수/매도 신호 시스템 Sniper Flip Zones는 추세장이나 횡보장에서 모멘텀이 급격히 전환되는 순간을 포착하여 매우 정밀한 매수 및 매도 신호를 생성하도록 설계했습니다. XAUUSD의 M1/M5에서 특히 잘 작동하며, 설정 가능한 매개변수를 통해 어떤 통화쌍이나 시간대에서도 사용할 수 있습니다. 최신 정보를 받아보시려면 채널을 구독하세요: https://www.mql5.com/en/channels/forexnewadvisor 핵심 로직은 다음 요소들을 결합합니다: – 스토캐스틱 지표의 극단 영역(10/90)에서의 반전 – 선택 가능한 %K와 %D의 교차 신호 – 단기 및 장기 이동 평균을 활용한 동적 추세 인식 – 같은 방향의 연속 신호를 피하기 위한 교차 신호 논리 신호가 생성되는 방식: – 과매수/과매도 탈출: 빠른 스토캐스틱이 극단 구간을 벗어날 때 단기적인 반전을 감지합니다. – 교차 필터: 보다 강력한 확인을 위
제작자의 제품 더 보기
Gartley Harmonic
Alessandro Michele Ventrella
Gartley Harmonic Detector PRO / GRATUITO Introduzione Benvenuti al Gartley Harmonic Detector , lo strumento definitivo per il trading armonico su MetaTrader 5. Questo indicatore è progettato per identificare automaticamente il classico pattern Gartley (sia rialzista che ribassista) in tempo reale con estrema precisione. Che siate trader esperti o principianti, questo strumento vi aiuta a individuare istantaneamente le Zone di Potenziale Inversione (PRZ) ad alta probabilità, eliminando la necess
FREE
Strong Hosoda Pro
Alessandro Michele Ventrella
*Strong Hosoda Pro - Versione M15 GRATUITA* Strong Hosoda Pro è un indicatore di tendenza e livelli basato sul metodo originale Ichimoku Hosoda. Questa è la versione GRATUITA, funzionante solo sul timeframe M15. È completamente funzionale per testare la strategia. *Caratteristiche principali:* - Chiare frecce di ACQUISTO/VENDITA con avviso Livelli dinamici di Take Profit  - Grafico pulito, nessuna rielaborazione dopo la chiusura della barra - Basato sulla logica di Tenkan, Kijun, Senkou Spa
FREE
Asian Range full Breakout
Alessandro Michele Ventrella
Ecco una guida utente completa e professionale in inglese, con descrizione dell'indicatore, formattata in modo da poterla facilmente copiare e incollare nella pagina del prodotto, nel file di descrizione o nella documentazione di MQL5 Market. Indicatore Asian Range Breakout Pro (MT5) Asian Range Breakout Pro è uno strumento di analisi tecnica di livello professionale progettato per MetaTrader 5 (MT5), specificamente ideato per individuare configurazioni di breakout ad alta probabilità sulle pri
FREE
Matrix Trend Pro
Alessandro Michele Ventrella
Matrix Trend Pro (Free Edition) Matrix Trend Pro Free is a clean, reliable, and powerful trend-following indicator designed for MetaTrader 4. Built around a customized multi-period logic and institutional volatility channels, this free edition helps you instantly identify market direction and key operational zones without cluttering your workspace. Key Features Dynamic Trend Line: Powered by a customized moving-average algorithm that tracks primary market dynamics and automatically changes st
FREE
Multi Spread Hunter
Alessandro Michele Ventrella
Scanner a diffusione Spread Scanner è uno strumento di monitoraggio multi-simbolo elegante, professionale e ad alte prestazioni, progettato per MetaTrader 5 (MT5). Consente ai trader di tracciare e confrontare in tempo reale gli spread su 10 strumenti di trading personalizzabili simultaneamente, direttamente da un'interfaccia HUD intuitiva sul grafico. Che si tratti di operare sulle principali coppie di valute Forex, sui metalli preziosi o sugli indici, sapere dove le condizioni di esecuzione so
FREE
Multi Spread Hunter Info
Alessandro Michele Ventrella
Scanner a diffusione Spread Scanner è uno strumento di monitoraggio multi-simbolo elegante, professionale e ad alte prestazioni, progettato per MetaTrader 4 (MT4). Consente ai trader di tracciare e confrontare in tempo reale gli spread su 10 strumenti di trading personalizzabili simultaneamente, direttamente da un'interfaccia HUD intuitiva sul grafico. Che si tratti di operare sulle principali coppie di valute Forex, sui metalli preziosi o sugli indici, sapere dove le condizioni di esecuzione so
FREE
Full History Drawdown
Alessandro Michele Ventrella
Monitoraggio completo dei drawdown storici - Expert Advisor per MetaTrader 5 Descrizione del prodotto (descrizione del mercato): Smetti di fare supposizioni sulla tua reale esposizione al rischio. Scopri immediatamente il tuo peggior calo storico. Il Full History Drawdown Monitor è un'utility professionale essenziale per la gestione del rischio, sviluppata per MetaTrader 5 (MT5). A differenza dei report o dei monitor standard del terminale, che calcolano il drawdown solo dal momento in cui veng
FREE
Guardian Started
Alessandro Michele Ventrella
Guardian PRO v11.0 - Prova gratuita (50 trascinamenti) Scopri la potenza del trading furtivo. Benvenuto nella prova gratuita di Guardian PRO v11.0 , lo strumento definitivo progettato per proteggere le tue posizioni e padroneggiare la gestione del rischio su MetaTrader 4. Questa versione di prova consente di sperimentare le funzionalità principali del sistema Guardian: l'occultamento dello stop loss e del take profit del broker e il sistema di trailing stealth . Prima di scaricare il programma
FREE
_Guardian PRO v11.0 DARK - Il gestore di trading definitivo per MT4_ Guardian PRO è un pannello di controllo professionale progettato per proteggere e gestire le tue operazioni direttamente sul grafico, con un moderno design scuro. Dimentica i terminali MT4 standard: Guardian nasconde i tuoi livelli di Stop Loss e Take Profit al broker. _CARATTERISTICHE PRINCIPALI:_ 1. I BROKER SMETTONO DI NASCONDERE LA TECNOLOGIA: Guardian memorizza internamente i tuoi livelli SL/TP (Variabili Globali). I t
Strong Hosoda Pro Full
Alessandro Michele Ventrella
*Strong Hosoda Pro - Edizione COMPLETA - Premium* Strong Hosoda Pro è un indicatore professionale di trend e livelli basato sul metodo originale Ichimoku Hosoda, sviluppato per trader esperti. Questa è la versione Premium COMPLETA, valida per tutti i tempi, da M1 a D1. Nessuna restrizione. *Perché Premium?* A differenza degli indicatori standard, combinazione direzione del trend, tempistica di ingresso e livello di take profit in un unico sistema chiaro, basato sulla logica completa dell'Ich
Matrix Trend Pro Suite
Alessandro Michele Ventrella
DEMO RESTRICTION: Demo works on EURUSD only. To use on XAUUSD, GBPUSD, and all other symbols please purchase the Full version. Matrix Trend Pro Suite Matrix Trend Pro Suite is a cutting-edge, all-in-one trading system designed for MetaTrader 4. It combines multi-timeframe trend analysis, volatility channels, and automated risk management into a single, clean workspace. Whether you are looking to capture strong market trends or optimize your risk-to-reward ratio, this suite provides institutiona
Matrix Trend Pro EA
Alessandro Michele Ventrella
MATRIX TREND PRO EA - La suite definitiva per l'analisi automatizzata delle tendenze Matrix Trend Pro EA è la versione completamente automatizzata del bestseller Matrix Trend Pro Indicator. La stessa potente logica, ora automatizzata al 100%. Niente più punti di ingresso persi, niente più trading emotivo, niente più tempo davanti allo schermo. Lo colleghi. Fa tutto da solo. COME FUNZIONE - LA LOGICA DI MATRIX Questo non è un semplice Expert Advisor basato sui media mobile. Si tratta di un s
Lot Size Calculator Universal
Alessandro Michele Ventrella
PREZZO DI LANCIO 49 USD -> PREZZO SUCCESSIVO 97 USD! Calcolatore della dimensione del lotto PRO Universale - L'UNICO calcolatore di rischio che funziona con il simbolo OGNI. Se cerchi: calcolatore della dimensione del lotto, calcolatore del rischio, calcolatore della dimensione della posizione, gestione del denaro MT5, calcolatore di lotti forex - eccolo. UNIVERSALE: Forex, XAUUSD Oro, BTCUSD Criptovalute, indici US30 NAS100, conti Standard, CENT, Micro. Rilevamento automatico della lev
Breakout Box Radar 1
Alessandro Michele Ventrella
Breakout Box Radar - Box di Struttura di Mercato Istituzionale di Alessandro Michele Ventrella Stanchi di ridisegnare gli indicatori? Breakout Box Radar è uno strumento istituzionale basato sulla price action. Questo indicatore calcola automaticamente la struttura storica del mercato e completa la sua formazione alle 08:00 ora del server, contrassegnando la zona esatta in cui si è accumulata la liquidità. Nessuna impostazione da ottimizzare. Nessun ridisegno. Livelli solisti. COME FUNZIONE: Cal
Volume Profile Advanced S D
Alessandro Michele Ventrella
VOLUME PROFILE S&D — Advanced Market Structure & Supply/Demand Suite Overview Volume Profile S&D is a professional-grade indicator designed to bring institutional-level volume analysis directly to MetaTrader. By mapping market liquidity through volumetric price distribution rather than simple visual highs and lows, this tool automatically identifies where real institutional transactions, accumulations, and distributions occur. Key Features: Dynamic Value Area (VAH & VAL): Automatically calculate
Real Raw Indicator
Alessandro Michele Ventrella
REAL RAW| Suite per volumi istituzionali e blocchi di ordini REAL RAW  è un indicatore di trading professionale all'avanguardia e ultra-preciso, progettato per i trader d'élite che esigono assoluta trasparenza dal mercato. Realizzato senza smoothing artificiale o filtri matematici ritardati, questo strumento opera al 100% su dati istituzionali grezzi per rivelare le reali tracce del capitale investito, i principali pool di liquidità e le zone di accumulazione ad alto volume in cui viene impiegat
Full History Drawdown 4
Alessandro Michele Ventrella
Monitoraggio completo dei drawdown storici - Expert Advisor per MetaTrader 4 Descrizione del prodotto (descrizione del mercato): Smetti di fare supposizioni sulla tua reale esposizione al rischio. Scopri immediatamente il tuo peggior calo storico. Il Full History Drawdown Monitor è un'utility professionale essenziale per la gestione del rischio, sviluppata per MetaTrader 4 (MT4). A differenza dei report o dei monitor standard del terminale, che calcolano il drawdown solo dal momento in cui veng
FREE
Gartley Harmonic Pro4
Alessandro Michele Ventrella
Gartley Harmonic Pro4 Introduzione Benvenuti al Gartley Harmonic Pro4   , lo strumento definitivo per il trading armonico su MetaTrader 4. Questo indicatore è progettato per identificare automaticamente il classico pattern Gartley (sia rialzista che ribassista) in tempo reale con estrema precisione. Che siate trader esperti o principianti, questo strumento vi aiuta ad individuare istantaneamente le Zone di Potenziale Inversione (PRZ) ad alta probabilità, eliminando la necessità di complessi dis
*Guardian PRO v11.0 DARK - Il gestore di trading definitivo per MT5* Guardian PRO è un pannello di controllo professionale progettato per proteggere e gestire le tue operazioni direttamente sul grafico, con un design scuro e moderno. Dimentica i terminali MT5 standard: Guardian nasconde i tuoi livelli di Stop Loss e Take Profit al broker. *CARATTERISTICHE PRINCIPALI:* *1. I BROKER SMETTONO DI NASCONDERE LA TECNOLOGIA:* Guardian memorizza internamente i tuoi livelli SL/TP (Variabili Globali).
PREZZO DI LANCIO 49 USD -> PREZZO SUCCESSIVO 97 USD! Calcolatore della dimensione del lotto PRO Universale - L'UNICO calcolatore di rischio che funziona con OGNI simbolo. Se cerchi: calcolatore della dimensione del lotto, calcolatore del rischio, calcolatore della dimensione della posizione, gestione del denaro MT5, calcolatore di lotti forex - eccolo. UNIVERSALE: Forex, XAUUSD Oro, BTCUSD Criptovalute, indici US30 NAS100, conti Standard, CENT, Micro. Rilevamento automatico della leva f
Breakout box Radar
Alessandro Michele Ventrella
Breakout Box Radar - Box di Struttura di Mercato Istituzionale di Alessandro Michele Ventrella Stanchi di ridisegnare gli indicatori? Breakout Box Radar è uno strumento istituzionale basato sulla price action. Questo indicatore calcola automaticamente la struttura storica del mercato e completa la sua formazione alle 08:00 ora del server, contrassegnando la zona esatta in cui si è accumulata la liquidità. Nessuna impostazione da ottimizzare. Nessun ridisegno. Livelli solisti. COME FUNZIONE: Cal
Volume Profile Advanced SD
Alessandro Michele Ventrella
VOLUME PROFILE S&D — Advanced Market Structure & Supply/Demand Suite Overview Volume Profile S&D is a professional-grade indicator designed to bring institutional-level volume analysis directly to MetaTrader. By mapping market liquidity through volumetric price distribution rather than simple visual highs and lows, this tool automatically identifies where real institutional transactions, accumulations, and distributions occur. Key Features: Dynamic Value Area (VAH & VAL): Automatically calculate
Real Raw Indicator 5
Alessandro Michele Ventrella
REAL RAW   | Suite per volumi istituzionali e blocchi di ordini REAL RAW    è un indicatore di trading professionale all'avanguardia e ultra-preciso, progettato per i trader d'élite che esigono assoluta trasparenza dal mercato. Realizzato senza smoothing artificiale o filtri matematici ritardati, questo strumento opera al 100% su dati istituzionali grezzi per rivelare le reali tracce del capitale investito, i principali pool di liquidità e le zone di accumulo ad alto volume in cui viene impiega
Gartley Harmonic Pro
Alessandro Michele Ventrella
Gartley Harmonic Detector PRO  Introduzione Benvenuti al Gartley Harmonic Detector , lo strumento definitivo per il trading armonico su MetaTrader 5. Questo indicatore è progettato per identificare automaticamente il classico pattern Gartley (sia rialzista che ribassista) in tempo reale con estrema precisione. Che siate trader esperti o principianti, questo strumento vi aiuta a individuare istantaneamente le Zone di Potenziale Inversione (PRZ) ad alta probabilità, eliminando la necessità di com
Bat Harmonic
Alessandro Michele Ventrella
Bat Harmonic Free è uno scanner automatico avanzato di pattern armonici per MetaTrader 5, specificamente progettato per rilevare il pattern Bat con elevata precisione geometrica, basandosi sulle regole di Scott Carney. Questa versione gratuita è limitata all'utilizzo esclusivo sulla coppia USD/JPY con timeframe a 5 minuti (M5) , consentendo di testare il riconoscimento dei pattern in tempo reale, la zona di potenziale inversione (PRZ), i rapporti di Fibonacci sulle gambe e i livelli di Take Pro
FREE
Bat Harmonic Pro
Alessandro Michele Ventrella
Bat Harmonic PRO è lo scanner automatico di pattern armonici definitivo per MetaTrader 5, progettato per i trader professionisti che esigono precisione, flessibilità e una copertura completa del mercato. Basandosi sulle solide regole geometriche del pattern Bat di Scott Carney, questa versione completa è completamente sbloccata per tutti i simboli e i timeframe . Che tu operi sui principali indici Forex, sugli indici azionari, sulle criptovalute o sulle materie prime, dal grafico M1 ad alta vel
Cypher Harmonic Pro
Alessandro Michele Ventrella
Cypher Harmonic PRO - Rilevatore di pattern armonici di precisione Porta la tua analisi tecnica a un livello superiore con Cipher Harmonic PRO , l'indicatore avanzato per MetaTrader 5 (MT5) sviluppato specificamente per identificare il complesso e redditizio pattern armonico "Cipher". A differenza dei classici pattern armonici (come Gartley o Bat), il Cipher si distingue per la sua struttura geometrica unica e le specifiche regole di ritracciamento, offrendo punti di inversione estremamente pre
Cypher Harmonic
Alessandro Michele Ventrella
Cypher Harmonic FREE - Rilevatore di armoniche per EURUSD M5 Sperimenta la precisione e la potenza dell'analisi armonica avanzata con Cipher Harmonic FREE , l'indicatore gratuito per MetaTrader 5 (MT5) creato appositamente per il pattern Cipher . Questo strumento automatizza il riconoscimento geometrico di complesse strutture armoniche sul tuo grafico, permettendoti di testare in prima persona i punti di inversione e gli obiettivi di profitto prima di passare alla versione PRO completa. Caratte
FREE
필터:
리뷰 없음
리뷰 답변