Rgt Cluster Footprint
- 指标
- 版本: 1.21
- 更新: 26 十月 2026
- 激活: 10

Rgt Cluster Footprint shows what regular candles hide: where volume traded inside each candle and which side dominated at every price level.
Each candle is drawn as a footprint column: one bar per price level with its number, longer and stronger where more volume traded.
Features
- Per-candle footprint: volume by price level, green when buyers dominated, red when sellers dominated.
- Candle POC: the highest-volume level, highlighted with a white frame and bold number.
- Diagonal imbalances: green (buy) or pink (sell) numbers when one side outweighs the other; side line for 3+ stacked imbalances.
- High volume: gold number on levels above your threshold.
- Absorption zones: volume accumulated in wicks where price rejected the level, extended until price returns.
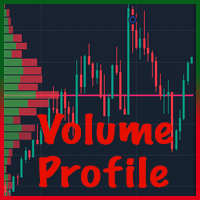
- Volume profile with POC, VAH and VAL.
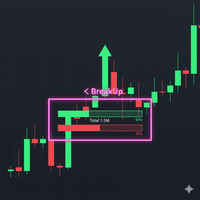
- Current-candle panel: buy/sell %, delta, volume and POC position.
- Built-in delta-per-candle panel + CVD (cumulative delta) in the same indicator.
- Candle countdown timer with color warning.
- Timeframe buttons (M1–H4) colored by trend.
- Wide columns independent of MT5 zoom (adjustable), or classic view aligned to candles.
Works on any symbol and timeframe. Uses real exchange volume when available and broker tick volume on Forex.
Download the free demo and see it working in the MetaTrader 5 Strategy Tester. Built for scalping, 1-minute trading and intraday analysis: see in seconds where strong volume enters, where absorption happens and who controls every candle.