Volmark MT4
- 指标
- 版本: 4.43
- 激活: 20

Are there many lines on the chart, but it's unclear which ones to focus on? Do you have to re-search for reference points every day, manually mark levels, and switch between multiple instruments?
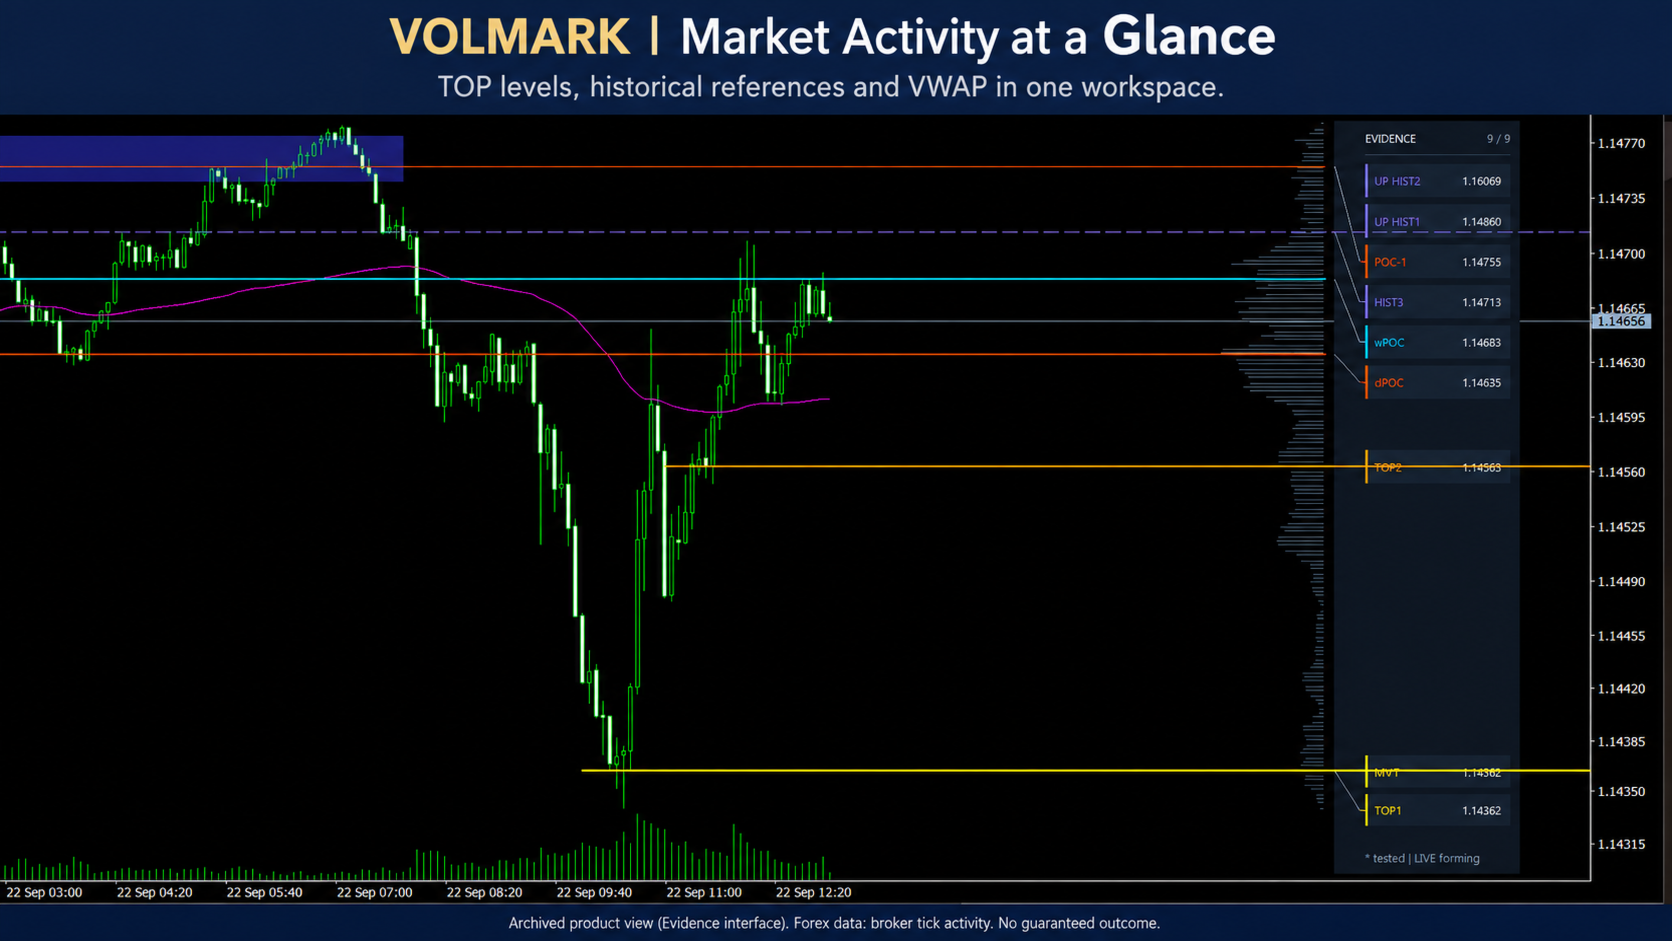
Volmark for MetaTrader 5 brings together market activity levels, historical benchmarks, profile, and VWAP in a single interface. It helps you focus on what matters most: where the price is and how it behaves around the marked areas.
Less manual marking means more attention to the market
Volmark is suitable for traders who are familiar with these situations:
-
The chart is overloaded. The indicators and labels distract from the price action.
-
There's a lack of landmarks. It's difficult to quickly see where the activity was concentrated.
-
Decisions are made impulsively. There's a desire to enter a trade following the movement, even though the terms of the deal haven't yet been determined.
Volmark provides a visual basis for monitoring: current levels, context of past activity, and exact prices in a separate panel.
What you get
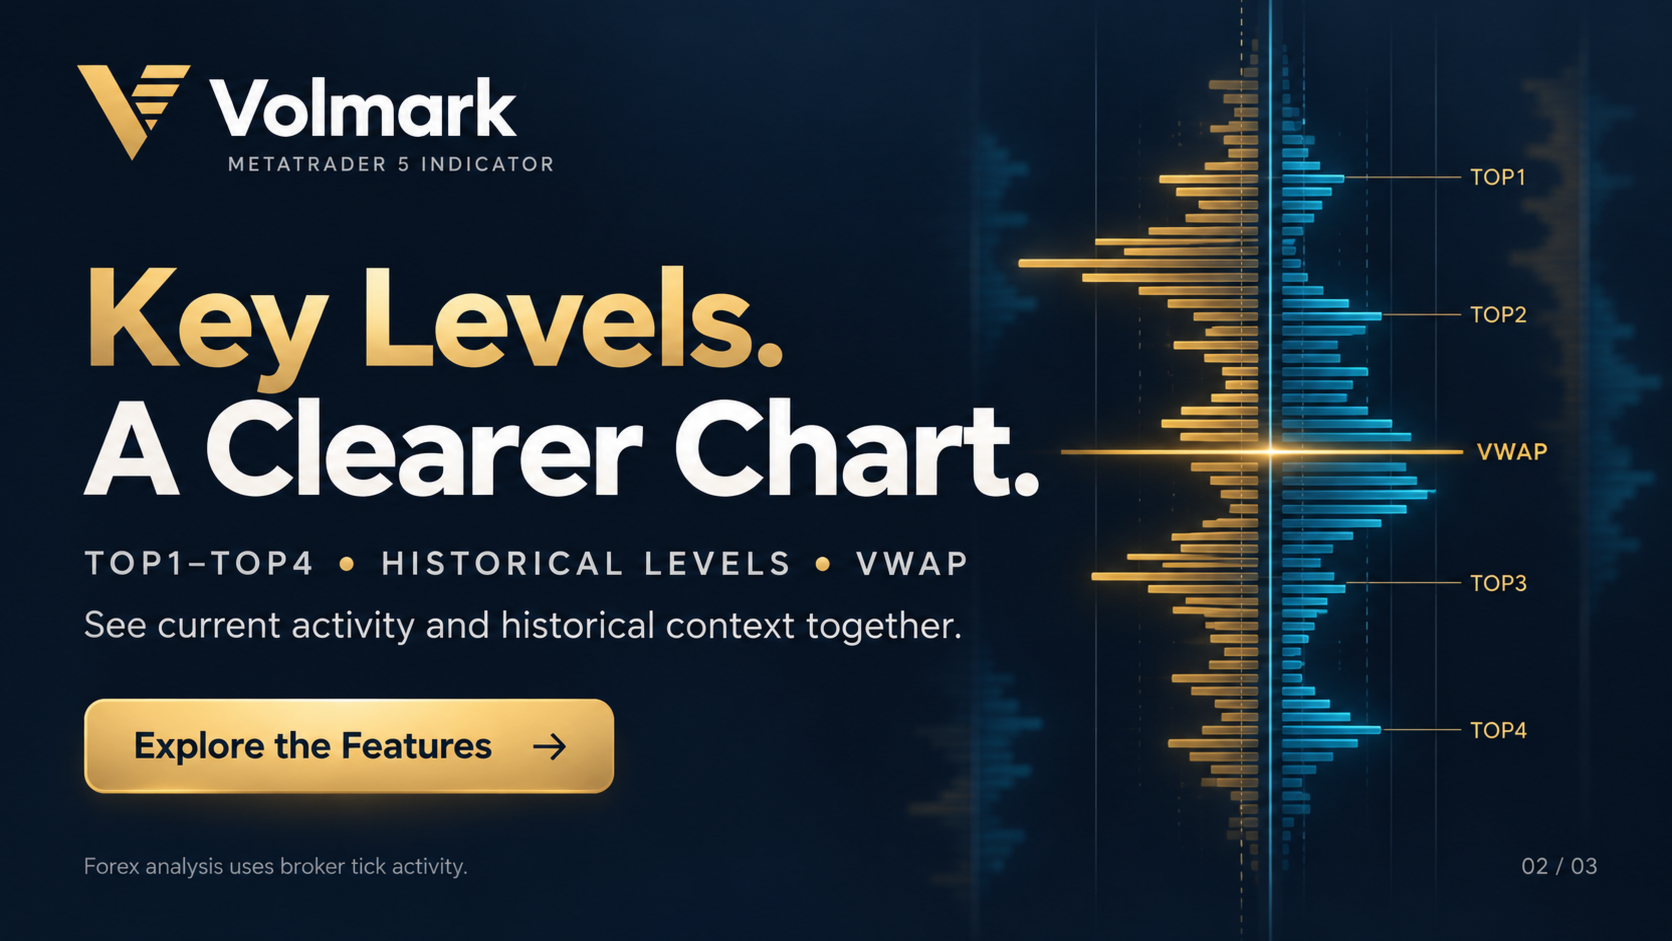
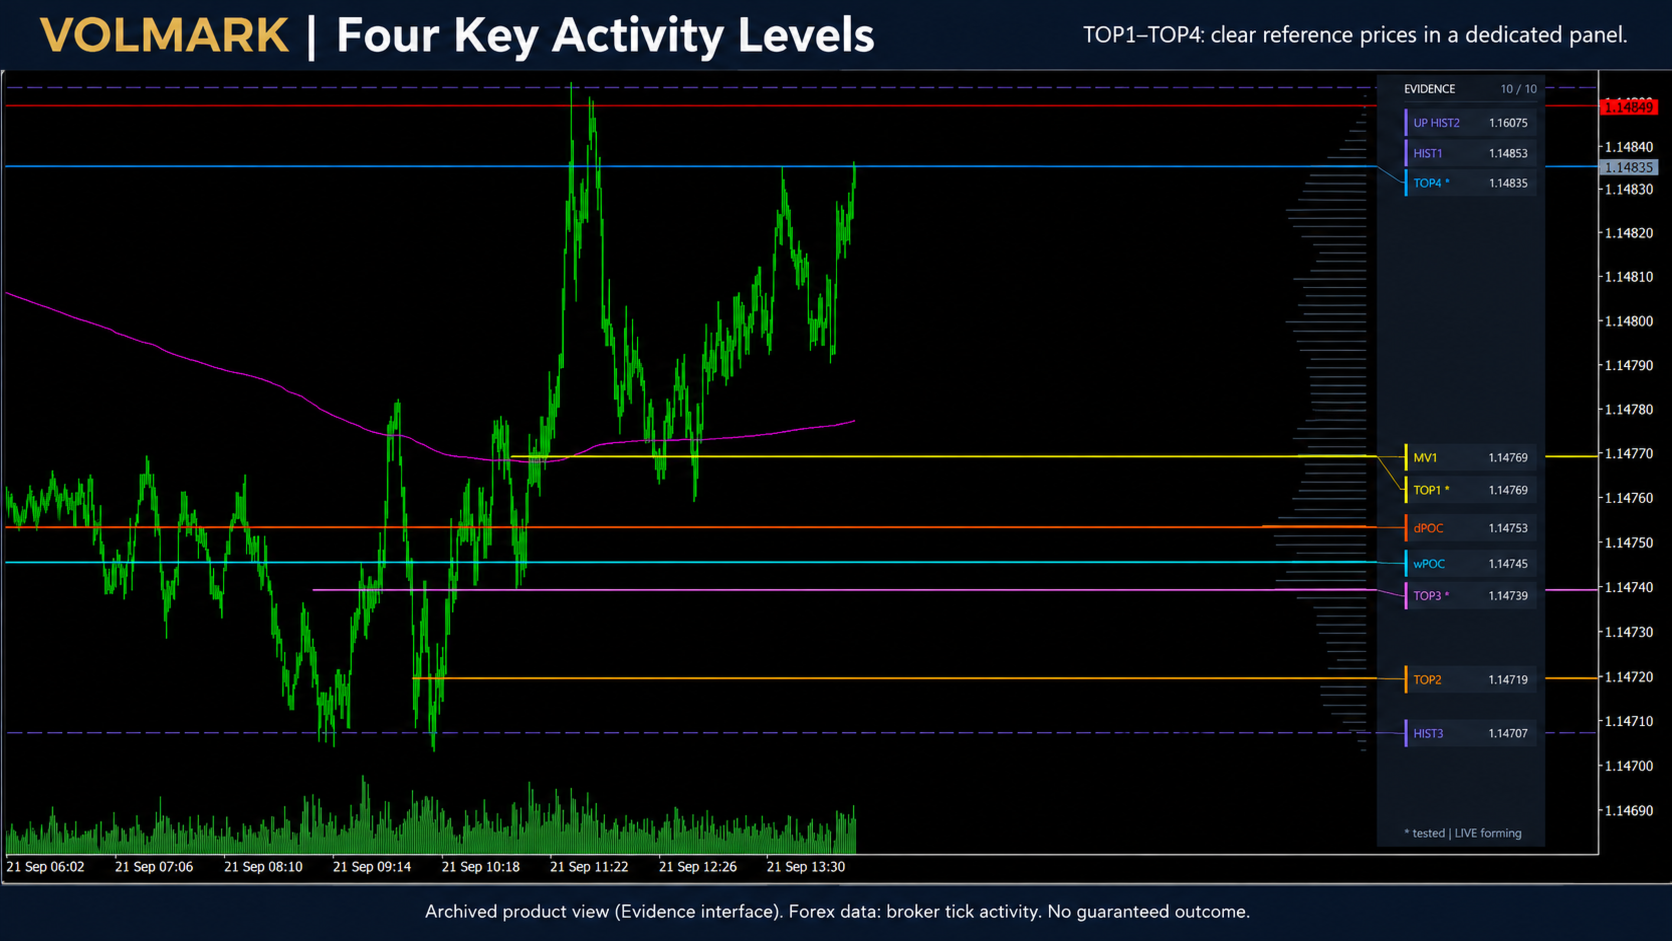
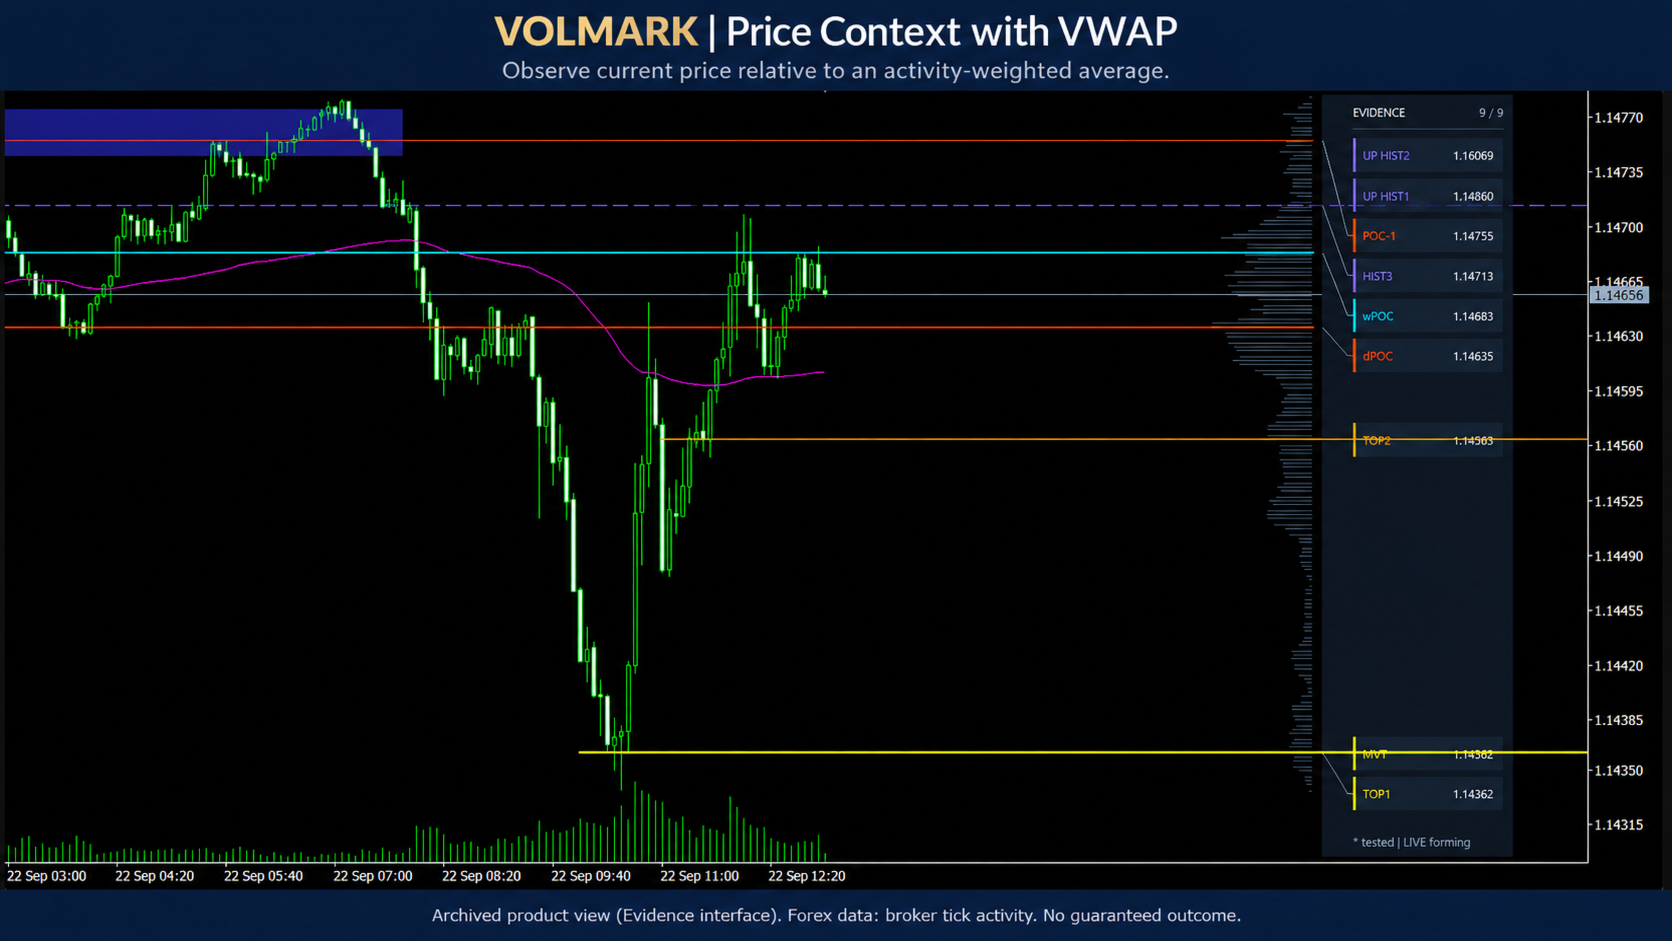
TOP1–TOP4 — main activity levels
Four benchmarks that are convenient for monitoring price behavior and comparing it with your trading plan.
H1 LIVE – attention to the emerging hour
The current hour's preliminary ranking is displayed before reaching the TOP. While the hour is being calculated, LIVE markers may move and change rank.
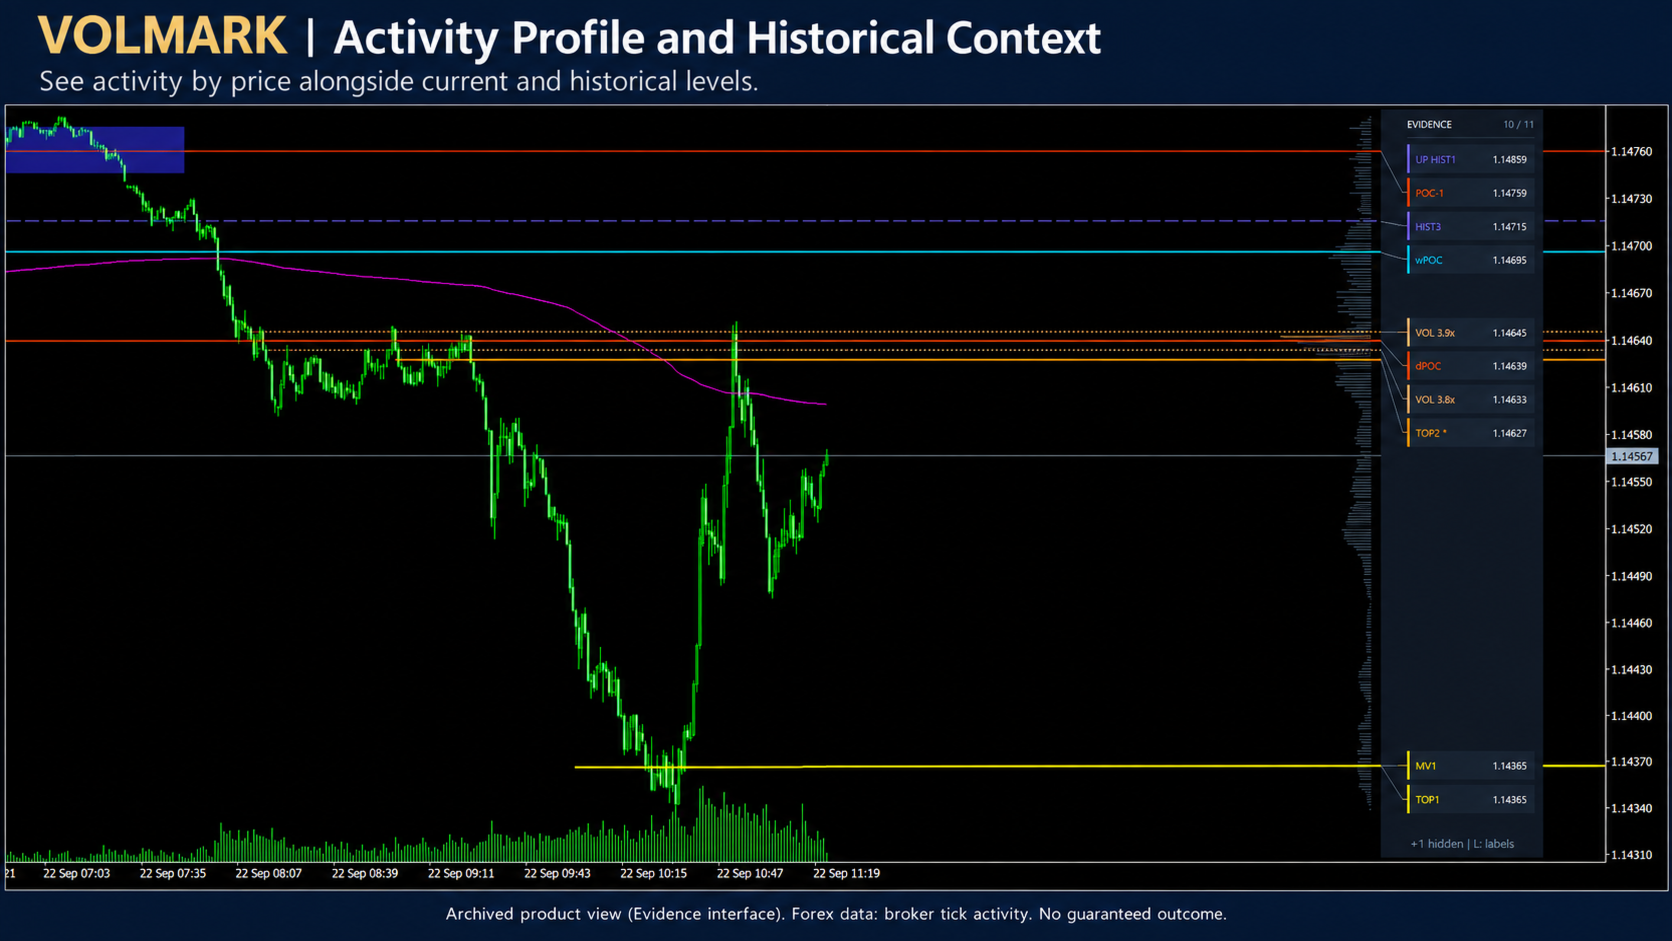
HIST - Historical Context
Areas of past activity help to notice the return of price to previously identified levels.
Side Profile - Price Activity
Shows how activity is distributed within the analyzed range.
VWAP — Average Price Approximately
Supplements the levels with an average price taking into account the activity used and helps to evaluate the position of the current price relative to it.
Compact panel - signatures and prices nearby
The main information is collected in a separate area. The histogram and labels can be toggled to select the most convenient chart detail.
How to use Volmark
1. Find the nearest landmark.
Look at what levels are near the current price.
2. Wait for a reaction.
Watch for a rebound, a breakout, or a retest. The lack of a clear reaction is also information.
3. Compare the observation with your plan.
Use levels when evaluating entry, maintenance, or exit conditions. You determine your acceptable risk and the final decision.
Who is Volmark for?
For beginning traders who need a clear analysis structure, and for experienced users who want to reduce manual marking and gather multiple benchmarks in a single workspace.
The development is primarily focused on EURUSD in the MetaTrader 5 desktop platform . Get started with a demo account and evaluate the indicator's performance using your broker's data.
It is important to understand
Volmark is an analytical indicator; it doesn't open or close trades on its own. In Forex, the standard source is the broker's tick activity , not the overall market volume. It doesn't allow one to determine the positions of a specific bank or participant.
Preliminary LIVE levels are subject to change. Historical examples illustrate specific situations and do not guarantee a repeatable outcome.
Make your chart clearer. Add Volmark to your analysis and monitor the price with specific benchmarks.