• 概述
  • 评论
  • 评论 (1)
  • 新特性

Price Action Multi Timeframe Radar

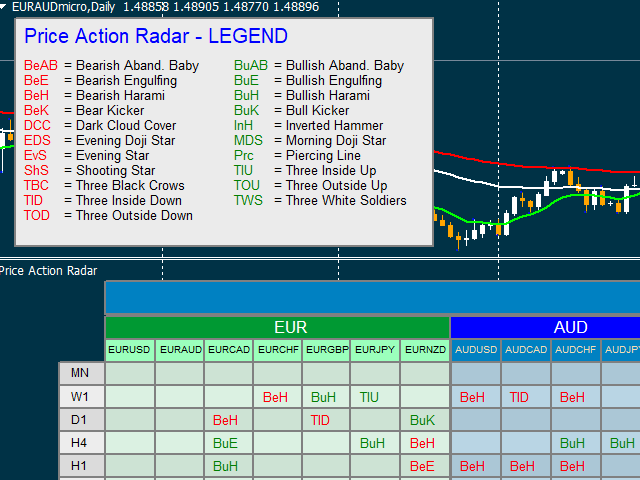
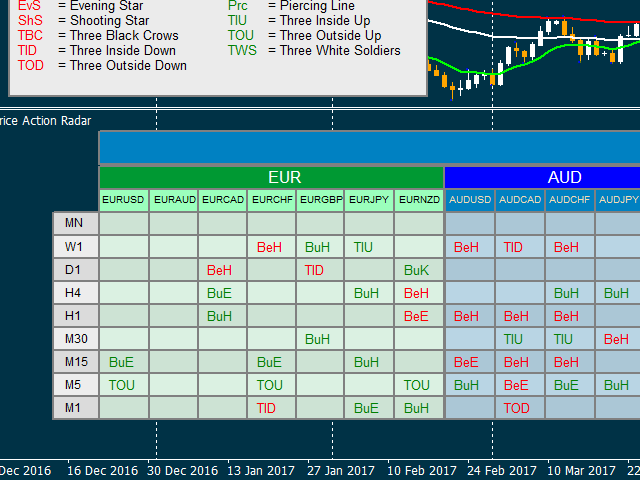
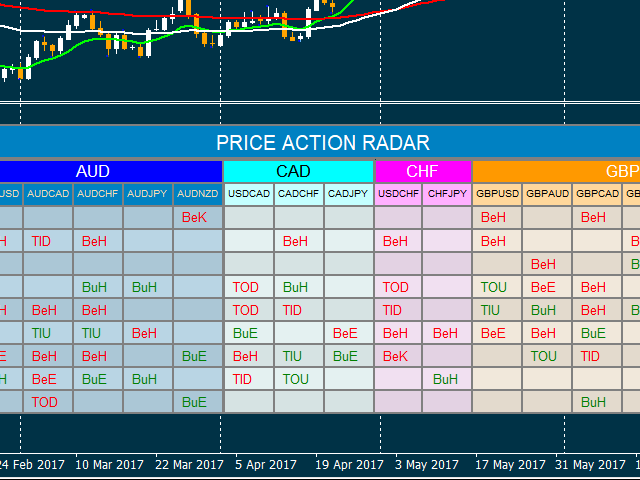
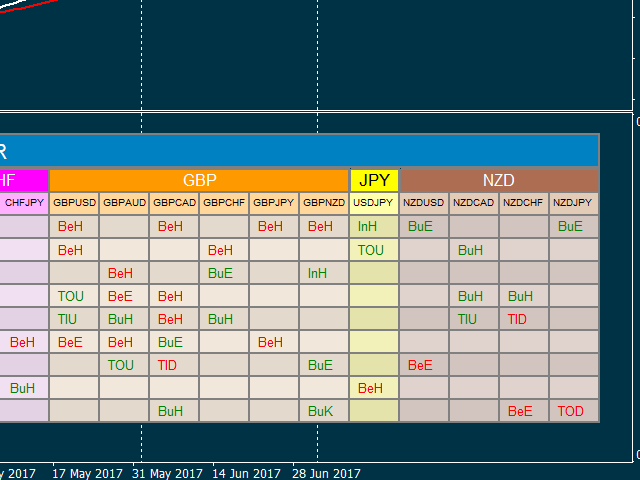
This powerful indicator intercepts 21 patterns simultaneously on 28 Pairs and on all timeframes.

Just put the indicator on a single chart to see all patterns that appear on all pairs in all timeframes

The patterns found are:

  • For Bearish:
    • Bearish Abandoned Baby;
    • Bearish Engulfing;
    • Bearish Harami;
    • Bear Kicker;
    • Dark Cloud Cover;
    • Evening Doji Star;
    • Evening Star;
    • Shooting Star;
    • Three Black Crows;
    • Three Inside Down;
    • Three Outside Down;
  • For Bullish:
    • Bullish Abandoned Baby;
    • Bullish Engulfing;
    • Bullish Harami;
    • Bull Kicker;
    • Inverted Hammer;
    • Morning Doji Star;
    • Piercing Line;
    • Three Inside Up;
    • Three Outside Up;
    • Three White Soldiers

Many, many patterns in only one indicator!

A legend helps interpret the acronym of the patterns shown

On the start it takes a few seconds to look for patterns on all pairs on all timeframes, after looking for patterns only at the opening of new candles


Parameters

  • Pairs_Suffix: suffix as "micro", "-ECN" etc.
推荐产品
Hello This EA for send Orders Signals when you open or close order and send statics to your channel in Telegram with sum of profit or Loss Pips you can share your orders with your clients in your telegram please watch our video  to see how it is fast. https://www.youtube.com/watch?v=u_7twtYZhyI you must have Telegram channel then make bot and give it Permission and get token (watch this video to know how do it) https://www.youtube.com/watch?v=x1bKWFOjSBE and you must download this files h
Currency Correlation pro Currency correlation happens when the price of two or more currency pairs moves in conjunction with one another. There can be both positive correlation, where the price of the currency pairs moves in the same direction and negative correlation, where the price of the currency pairs moves in opposite directions. this indicator put the price of 5 pairs on sub-windows so you see what happens in one chart. How to use Correlation Indicator? You can simply choose curren
Pro Trader mt4
Natasha Diedericks
This indicator takes input from the RSI and a trend filter, and presents the output in a separate indicator window as a histogram. Great for scalping. Settings: No need to set up the indicator. Features Alerts. How to use: Simply attach to any chart Zoom chart in to get a better view of the histo color. Buy:  Blue histo color on multiple timeframes. (e.g,. M30-H1-H4) Sell: Red histo color  across on multiple timeframes. Or backtest and use as you see fit for your strategy. Best results on Majo
Hidden Gap by MMD MT4
Mariusz Maciej Drozdowski
Hidden Gap by MMD Hidden Gap by MMD is a unique indicator that detects hidden gaps between three consecutive candles. This observation isn't my own, but in the MMD methodology, it has its application alongside other original indicators. You can apply this indicator to the chart multiple times and set the interval from which you want to see the hidden gaps. You can show or hide these gaps as needed. For example, you can view the chart at an M5 interval and see hidden gaps from an M15 chart, etc.
This is a non-repainting professional indicator for any currency pair on H1 chart. This indicator comes with Screen, Sound, Email and Push Notifications. Place your trades (risk of 1 to 2% each) when you get BUY/SELL alerts and EXIT when opposite or EXIT alerts. You can set your take profit from 70 to 100 pips when the indicator is attached to H1 chart. Stop loss may not be required, since you are going to close your trades on EXIT alerts. 
The Trend Champion indicator works on all timeframes and currency pairs. The indicator should be used as an auxiliary tool for technical analysis, it helps to determine the direction of the trend: either upward or downward price movement for a particular currency pair. Can be used along with oscillators as filters. Trend Champion is a trend indicator. Arrows indicate favorable moments and directions for entering the market. The indicator can be used both for pipsing on small periods and for l
BreakOutSR
Paul Reymkhe
BreakoutSR shows you possible breakouts for current/following day . With integrated Support and Resistance lines and a menu you have a better overview of the chart. If the candle closes above "LONG" go long , if the candle closes below "SHORT" go short . Same is for SHORT/LONG Breakouts. Quick and easy to understand - tool, perfect for all types of traders. BreakOutSR Inputs MT4 Alert - Alerts you on ur MT4 Terminal Broker GTM - your Broker GTM BreakOuts: Draw Breakouts - Draw the Breakout lin
Power Average
Khurram Mustafa
4.33 (3)
This Indicator is a  affordable trading tool  because with the help of  Popular Developers & Support of M Q L Platform  I have programmed this strategy. I tried to combine logic of  Moving Averages, Parabolic Stop And Reverse, Trend Strength, Oversold, Overbought . Furthermore, I have also care about  Support Resistance  that Trader can easily get in touch with market by selecting one indicator only. What is in for Trader? Trading Modes:  This selection is for  activate whole strategy  "Power
FREE
Adr alert multi pair
Vladimiro Lazzaretti
Indicator is able to alert by pop and acoustic alarm the achievement of the average price range of the last periods so as to be able to set our operation. It allows different percentage variables reached and periods of variation according to the parameters entered. Apply your reverse strategies to achieving that threshold so you get higher success rates. Indispensabile per le strategie reverse intraday.
Trade Extractor
Philip Pankaj Suthagar
5 (2)
Introducing TRADE EXTRACTOR The fastest self-learning AI Algorithm designed to revolutionize your trading experience. As a manual trader, the challenge of pinpointing the right parameters and conditions for trading can be overwhelming. With countless combinations of indicators and objects like trendlines, Gann grids, and Fibonacci levels, determining their effectiveness is nearly impossible for a human. Many strategies lack the statistical backing to prove their claims. To address this, we deve
这个工具将在您的手机上发送详细的通知,并在MT4终端上提醒您,一旦您想看到的蜡烛图出现在图表上。该通知包含符号、蜡烛图样和形成该图样的时间框架。 你需要将Metatrader 4 Mobile与你的Windows终端连接起来。以下是方法。 https://www.metatrader4.com/zh/trading-platform/help/setup/settings_notifications 可以检测的烛台形态列表。 三个白兵 三只黑乌鸦 看涨的三线击球 看跌的三条线罢工 三条内侧上升线 三条内侧下跌 三条外线上涨 三线外跌 早晨之星 傍晚之星 看涨被遗弃的婴儿 看跌被遗弃的婴儿 看涨的哈拉米 看跌哈拉米 看涨的吞噬 看跌吞噬 锤子 射击之星 反转锤子 悬挂的人 蜻蜓斗鸡 墓碑十字星 早晨的斗极星 晚间斗极星 穿透线 黑暗四叶草 看跌的踢球者 看涨踢球者 长下影线(长颈线在下侧)。 长上影线(长灯芯在上方)。 输入参数 当你启动该工具时,你将不得不设置一些输入参数。 EnableMobileNotifications: 启用移动通知(MT5终端的警报默认为激活)。 S
This indicator is based on the previous option ( https://www.mql5.com/ru/market/product/37376 ) and includes all completions at the time of creation. Availability of additional data allows to understand more deeply the principle of work as this indicator and original. Points on extrema of bars show history of a portrayal of extrema as before. Levels of a reverse show as far as the price for formation of a new shoulder has to deviate. The Price noise parameter has a special impact (the name "devi
Trade History Exporter automatically exports trade history to a CSV (comma separated values) file. Trade History Exporter: - automatically exports trade history every time a trade is closed - allows you to manually force an export by using the "W" key on your keyboard - can use Order Comments as Magic Numbers - useful for instance when using a Trade Copier - calculates the Net Profit per trade
Boom William
Danni Jumena
This Indicator will notified you when time to entry into the market, build with double william percent range strategy.  --> Buy Notification will flag with the blue arrow --> Sell Notification will flag with the red arrow After Flag Appear, the market usually explode but carefully you must performs double check because weakness of this indicator when in the end of the trend
Currency Spread Calculator
Opengates Success International
Currency Spread Calculator This indicator is created with the aim of letting the Traders know the exact points of the spread on the currency pair they are about to buy or sell. This will safe them of paying exorbitant spread over a single currency pair procurement. Imagine a normal spread become wider from 2 or 3 pips to 15pips or more when there is volatility in the market. It is absolutely outrageous looking for just 20 pips and paying another 20 pips as spread over a currency pair! A
https://youtu.be/I46sDVz9tSo to use it correctly you need to change lots to 0.01 Recommend pair EURUSD Time Frame H1 ,best leverage for this EA is 1:1000 and above (FBS broker serve this leverage) This EA Cut Switch Martin open position  based on OsMA indicators, if the transaction hit stop loss then  EA will switch to a new transaction with double lots so that once profit can cover losses many times before it becomes profit Has passed 5 years bactest whit good result ,first backtest capital
This is a small and simple indicator for MetaTrader 4. It displays necessary information for current symbol such as : Symbol name. Total of sell volumes (lots). Total of buy volumes (lots). Total profit or loss. Some properties of this indicator such as 'Font Size', 'Text Color', 'Position', etc are customizable for your best experience. Hope this indicator helps you succeed in your trade.
Description Keltner's colored multicurrency/multisymbol channel indicator, also called STARC band, drawn in a separate window below the chart of the main financial symbol. The indicator uses the calculation technique of the three drawing options:  basic, improved and modified . The first two were proposed by Keltner, the third one - by a successful trader L. Rakshe. You can also search for your own best parameters of the indicator. The upper, middle and lower bands can be colored. The indicator
Line Alerter Free
Tomoyuki Nakazima
5 (1)
This indicator alerts you when indicator-created lines are "touched" by price, You can change the interval between alerts. You can change colors and styles of lines as you want. However, lines must be named "Upper" and "Lower. There is a  more powerful PRO version . Input Parameters WaitTime: Interval between alarm. How To Use Place lines wherever you want to add alarms.
FREE
Currency Correlation Plus
Szymon Palczynski
4.75 (4)
Currency Correlation Plus is an expensive version of the indicator. It is equipped with the signal and is more equipped than its cheaper brother. The indicator helps us understand and see a correlation. Second chart makes it easy to analyze and trade multiple currencies. On the chart, you can post multiple pairs. Type in the selected currency pair in the settings and add it to the chart. Inputs One indicator on chart=True / two or more=False Alert Signal buy and sell for first chart and sec
EA can help you control your MT4 easilly  First you must create a bot on Telegram and get its TOKEN  link guide :  https://sendpulse.com/knowledge-base/chatbot/create-telegram-chatbot Copy folder Telegram into Data MT4 program (MQL4\Include), link download ( delete space ) :  https: //drive.google.com/file/d/1mCUaTzwvvUkF3JUcLRXnAW1Ls1Mu6xqk/view?usp=sharing You must add the URL “ https://api.telegram.org ” to Tools > Options > Expert Advisors > Allow Web Request for listed URL in order to load
Profit Loss Viewer
Gleb Balashevich
This indicator is used to visualize the profit of closed and open orders on the symbol. To control using four buttons which are located on the chart after the indicator is started: Button "C" - show/hide on chart open and close points of closed orders from account history by current symbol; Button "O" - show/hide on chart open points of opened orders and distance between open point and current order close price point; Button "$" - show (if button "C" and/or button "O" activated) / hide every ord
Pattern Wizard MT4
Francisco Gomes Da Silva
Patterns Wizard是一个用于创建蜡烛图形态的工具。通过它,您可以创建多种不同的图形形态,并在您的图表上添加任意数量的此指标的实例,每个实例都具有不同的形态。 为了更好地理解创建公式的方式,您可以使用名称为 My Candle的指标的示例,该指标包含70多个蜡烛图形态的示例 。 该指标的主要区别在于它具有 30个规则参数 ,这意味着您可以为前30根蜡烛分别设置不同的规则。 一旦出现图形形态,此工具可以执行以下操作: 播放自定义声音 在MetaTrader中发出警报 向您的手机发送通知 发送电子邮件 该指标不会重绘,只在蜡烛结束时执行,因此非常迅速。此外,它具有一个用于优化您想要分析的蜡烛的最大数量的参数。 在测试器中使用它,并随意使用它创建规则。当您准备迈出一步,拥有一款专业工具来帮助您分析交易时,就购买此工具吧。 蜡烛图形态的创建 您可以使用此工具创建任何您想要的蜡烛形态,以下是如何获取图表值的方法 数值 描述 O 开盘价 H 最高价 L 最低价 C 收盘价 因此,如果您希望蜡烛是 阳线 ,只需构建以下公式 C > O 负责 阴线 的公式相同 C < O 这里是一个 十字
FREE
Based on TheStrat by Rob Smith (@robintheblack) #thestrat , which is a trading method that Rob has developed over a 30 year career in the market.    This is TheStrat Timeframe Continuity scanner that allows you to constantly scan either the Stocks, Currency pairs, indices or commodities that you want to watch. The time frames that you can watch can be (Year, Quarter, Month, Week, Day, H4, H1, 15M and smaller if you feel like it).  It tells what the current candle is doing.  It is either inside b
The indicator will provide a breakout line or price stop guide, we recommend M5 or H1 timeframes. Trade signal: Buy Signal:  if the closed price (according to the timeframe) breaks the blue line and is already   above it or if the lowest price stops above the red line. Sell Signal : if the closing price (according to  the timeframe) breaks the red line and is already below it or if the highest price stops below the blue line. Feature: You will get time (hours) and price values ​​for the lines
Candle close countdown indicator. Almost all indicators work by ticks and therefore stop counting when the price stops in moments of little volatility. This indicator does not stop and remains synchronized with the broker's clock. It also has other functions that can help the trader. All features are configurable and you can choose if you want to use it or not: - Volume control:                         the counter changes color when the current candle has a higher volume of contracts than the pr
Currency Index Pro
Makarii Gubaydullin
Current strength of the 8 major currencies My   #1 Utility:  includes 65+ functions, including this indicator  |   Contact me  if you have any questions The indicator is displayed in a separate window, it can be moved to any place on the chart. In the input settings   you can adjust: Interface theme : dark / white; Prefix and Suffix,  if the currency pairs on your broker have it: (e.g. if Symbol is "EURUSD .pro ", please set " .pro " as a Suffix); Panel size Font size
ToolBox 360 is the swiss knife of all indicators. It is full packed with useful tools to help you with your trading. It can be used to find best entry and exit points and help you to decide if you should open a trade or not. It shows market trends, candlestick formations outside / inside bars and you can sett time based allerts. Main features: Time based Fibonacci lines Choose a start and end time and the indicator shows you Fibonacci lines within the selected time range including range high
This EA is an extension for the free trade indicator Trend Mate . https://www.mql5.com/en/market/product/50082 The main idea is to support your decision to  trade  according to the current trend. It is possible to configure alert and push notification to receive when entering to first candle for bull / bear trend. For this extension of the free indicator now it is possible to filter the current trend info with other timeframes. For example show trend for timeframe M5 considering also timefra
Leave a review for this product, and receive another "Free" product that you choose. You can see my other products here: https://www.mql5.com/en/users/zakri/seller Harmonic Patterns Detector indicator draws harmonic patterns on chart. Harmonic patterns have a high hit-rate of around 80% and are excellent for trade entries. They are used as price reversal points. Some of them have a long history of usage and were created by famous traders like H. M. Gartley. Many harmonic patterns are included
该产品的买家也购买
Gann Made Easy
Oleg Rodin
4.85 (82)
Gann Made Easy 是一个专业且易于使用的外汇交易系统,它基于使用先生理论的最佳交易原则。 W.D.江恩。该指标提供准确的买入和卖出信号,包括止损和获利水平。您甚至可以使用推送通知在旅途中进行交易。 购买后请联系我!我将免费与您分享我的交易技巧和丰厚的红利指标! 您可能已经多次听说过江恩交易方法。通常 Gann 的理论不仅对于新手交易者而且对于那些已经有一定交易经验的人来说都是非常复杂的东西。这是因为江恩的交易方法在理论上并不那么容易应用。我花了几年时间来完善这些知识,并将最好的原则应用到我的外汇指标中。 该指标非常易于应用。您所需要的只是将其附加到您的图表并遵循简单的交易建议。该指标不断进行市场分析工作并寻找交易机会。当它检测到一个好的入口点时,它会为您提供一个箭头信号。该指标还显示止损和获利水平。 换句话说,当您像先生一样进行交易时,该指标会为您提供最佳江恩建议。江恩亲自告诉你此时此刻该做什么。但最好的部分是您不需要了解任何有关江恩交易原则的知识,因为该指标会为您完成整个市场分析工作。
TPSpro RFI Levels
Roman Podpora
4.82 (22)
Gold Stuff
Vasiliy Strukov
4.89 (239)
Gold Stuff 是专为黄金设计的趋势指标,也可用于任何金融工具。 该指标不会重绘,也不会滞后。 推荐时间框架 H1。 在它指标工作全自动专家顾问 EA Gold Stuff。 你可以在我的个人资料中找到它。 重要! 购买后立即与我联系,以获得说明和奖金!   您可以免费收到我们的强力支持和趋势扫描指标的副本,请私信。大部头书! 购买后立即联系我以获得设置和个人奖励!   设置 绘制箭头 - 打开关闭。 在图表上绘制箭头。 警报 - 打开关闭声音警报。 电子邮件通知 - 打开关闭。 电子邮件通知。 Puch-notification - 打开关闭。 推送通知。 接下来,调整色域。 Gold Stuff 是专为黄金设计的趋势指标,也可用于任何金融工具。 该指标不会重绘,也不会滞后。 推荐时间框架 H1。 在它指标工作全自动专家顾问 EA Gold Stuff。 你可以在我的个人资料中找到它。 购买后立即联系我以获得设置和个人奖励!   设置 绘制箭头 - 打开关闭。 在图表上绘制箭头。 警报 - 打开关闭声音警报。 电子邮件通知 - 打开关闭。 电子邮件通
Atomic Analyst
Issam Kassas
5 (2)
首先值得强调的是,该交易指标是非重绘、非延迟的指标,这使其成为手动和机器人交易的理想选择。 用户手册:设置、输入和策略。 Atomic Analyst是一种PA价格行动指标,利用价格的力量和动量来寻找市场上更好的机会。配备了高级过滤器,可帮助去除噪音和假信号,并提高交易潜力。使用多层复杂的指标,Atomic Analyst扫描图表,并将复杂的数学计算转化为任何初学者都能理解并用来做出一致交易决策的简单信号和颜色。 “Atomic Analyst”是专为新手和经验丰富的交易者量身定制的综合交易解决方案。它将高级指标和一流功能融合为一体的交易策略,使其成为所有类型交易者的多功能选择。 日内交易和剥头皮策略:专为快速准确的日内交易和短期交易而设计。 日内和摆动交易策略:可用作追求价格大幅波动的日内和摆动交易者的可靠工具。 多货币和市场:凭借其可靠的精度,在不同的工具和市场上运作。 多个时间框架:可在多个时间框架上使用,性能良好。 稳定性:所有指标均不重绘、不重绘和不滞后,确保可靠的信号。 信号清晰度:提供箭头信号,用于清晰的入场和出场点。 实时警报:通过交易入场、SL和TP警报通知交
TPSproTREND PrO
Roman Podpora
4.79 (19)
TPSpro TREND PRO 是一个趋势指标,可以自动分析市场并提供有关趋势及其每次变化的信息,并给出进入交易的信号而无需重新绘制! 该指标使用每根蜡烛,分别对其进行分析。指不同的脉冲——向上或向下脉冲。货币、加密货币、金属、股票、指数交易的准确切入点! MT5版本                 指标的完整描述   我们建议将其与 指示器 -   RFI LEVELS 一起使用 主要功能: 准确的输入信号,无需渲染! 如果出现信号,它仍然相关!这是与重提指标的一个重要区别,重提指标可以提供信号然后改变信号,这可能导致存款资金的损失。现在您可以以更高的概率和准确度进入市场。还有一个功能是在箭头出现后为蜡烛着色,直到达到目标(止盈)或出现反转信号。 显示止损/获利区域 为了提高搜索切入点时的视觉清晰度,创建了一个模块,该模块最初显示买入/卖出区域,在该区域中搜索进入市场的最佳点。用于处理止损水平的附加智能逻辑有助于随着时间的推移减小其大小,从而降低进入交易(移动 sl)时的初始风险。 显示较高时间范围内的最小值/最大值(MTF 模式) 添加了一项功能,可以显示较高时间间隔的最小
FX Power MT4 NG
Daniel Stein
5 (12)
通过 mql5 和 Telegram 上 的晨间简报获取每日市场更新,包括详细信息和屏幕截图 ! FX Power MT4 NG 是我们长期以来非常受欢迎的货币强度计算器 FX Power 的下一代产品。 这款下一代强度计算器能提供什么?您所喜爱的原版 FX Power 的所有功能 附加功能 黄金/XAU 强度分析 更精确的计算结果 可单独配置的分析周期 可自定义计算限制,以获得更好的性能 为希望查看更多信息的用户提供特殊的多实例设置 无尽的图形设置,可在每个图表中设置您最喜欢的颜色 无数的通知选项,让您再也不会错过任何重要信息 采用 Windows 11 和 macOS 风格的全新圆角设计 神奇的移动指标面板 FX Power 主要功能 所有主要货币的完整强势历史 所有时间框架内的货币强弱历史 所有经纪商和图表的计算结果完全相同 100% 可靠的实时计算 -> 无重绘 可通过下拉列表选择分析时段 通过自定义模式单独配置分析时段 可在一个图表中使用多个实例 可移动 FX Power 显示屏(通过拖放) 适用于高分辨率 QHD、UHD 和 4K 显示器 自动终端配置 针对平板电脑
FX Volume
Daniel Stein
4.58 (33)
通过 mql5 和 Telegram 上 的 " 晨间简报 "获取每日市场更新,包括详细信息和屏幕截图 ! 外汇交易量(FX Volume)是第一个也是唯一一个从经纪商角度真正洞察市场情绪的交易量指标。 直接在您的图表上看到这些信息是真正改变游戏规则和突破性的交易解决方案。 受益于独特的市场数据洞察,如 比率(Ratios )显示货币多头和空头头寸的比率(百分比 比率变化 显示所选时间段内的多头比率及其百分比变化 总交易量 显示货币的总交易量(多头和空头),以手为单位 多头 交易量显示货币所有多头头寸的交易量 空头 交易量显示所有货币空头头寸的交易量 净多头 显示净多头交易量,即所有多头头寸减去所有空头头寸(以手为单位)。 净多头百分比 显示货币净多头交易量的变化 请阅读我们的基本教程 -> "如何使用外汇交易量进行交易 " 获取更多信息,如常见问题、交易技巧和教程视频,请访问我们的 外汇交易量公共信息频道 请 安装并运行 SI Connect 以建立与我们数据中心的持续连接 背景信息 我们都知道,外汇是一个分散的市场。这就是为什么我们必须打破常规思维,开发一个独
Scalper Inside PRO
Alexey Minkov
4.73 (56)
An exclusive indicator that utilizes an innovative algorithm to swiftly and accurately determine the market trend. The indicator automatically calculates opening, closing, and profit levels, providing detailed trading statistics. With these features, you can choose the most appropriate trading instrument for the current market conditions. Additionally, you can easily integrate your own arrow indicators into Scalper Inside Pro to quickly evaluate their statistics and profitability. Scalper Inside
Enigmera
Ivan Stefanov
5 (3)
ENIGMERA:市场核心 https://www.enigmera.com 简介 该指标和交易系统是金融市场的一种非凡方法。ENIGMERA 利用分形周期精确计算支撑位和阻力位。它能显示真实的累积阶段,并给出方向和目标。 该系统无论在趋势中还是在修正中都能发挥作用。 它是如何运行的? ENIGMERA 由三条线组成:支撑/阻力线、目标线和偏离线。与一般市场指标将过去的数据推断为现在和未来的情况不同,该系统能提供当前的完整情况。如果你处于支撑位,这意味着真正的支撑;如果你处于阻力位,这意味着真正的阻力。如果突破某一水平,则表示趋势发生变化。没有重绘。 由于市场在不断变化,ENIGMERA 不断调整其评估工具,定期修改策略。  这保证了每种情况都能得到全面评估。这一市场指标的独特性显而易见,其能力不言而喻。  ENIGMERA 为金融分析师和咨询师提供服务,他们需要可靠的见解与客户分享,也为投资者提供服务,他们需要最精确和最可靠的保证。 该系统能够达到最佳精度,使交易者能够自信、清晰地评估他们的选择。 ENIGMERA 将 20 年的交易专长和知识整合到一个综合软件
MetaBands M4
Vahidreza Heidar Gholami
5 (2)
MetaBands使用强大且独特的算法绘制通道并检测趋势,以便为交易者提供进出交易的潜在点。它是一个通道指标和强大的趋势指标。它包括不同类型的通道,可以通过使用输入参数简单地合并以创建新通道。MetaBands使用所有类型的警报通知用户市场事件。 功能 支持大多数通道算法 强大的趋势检测算法 能够合并不同类型的通道 多时间帧和多货币(信号矩阵) 所有类型的警报功能(声音、屏幕闪烁、推送通知、电子邮件、弹出窗口、箭头) 它永远不会重绘 趋势检测 MetaBands使用在通道内振荡的蓝色线来检测趋势。当该线遇到通道的上界时,表明开始下跌趋势,当它遇到下界时,表明开始上涨趋势。如果蓝线接近中线,则市场处于整理期。 该指标使用独特的方法来检测趋势。一开始可能看起来有些复杂,但如果您观看视频教程,您就会意识到它是多么强大且易于使用。 入场和出场信号 当趋势变化或价格穿过上下通道时,MetaBands会立即通过不同的方法提醒交易者,这些方法可以在指标设置中启用。 信号矩阵 要监视来自不同时间框架的多个符号并在一个地方查看信号,请单击右上角按钮或按键盘上的M键以打开信号矩阵。该矩阵可以
目前八折优惠! 对任何新手或专家交易者来说都是最好的解决方案! 这个仪表板软件适用于28种货币对。它基于我们的两个主要指标(高级货币强度28和高级货币冲动)。它对整个外汇市场提供了一个伟大的概述。它显示高级货币强度值,货币运动速度和28个外汇对在所有(9)时间段的信号。想象一下,当你可以使用图表上的单一指标观察整个市场,以确定趋势和或剥头皮的机会时,你的交易将得到改善 我们已经在这个指标中建立了一些功能,使你更容易识别强势和弱势货币,同时识别和确认潜在的交易。该指标以图形方式显示货币的强势或弱势是增加还是减少,以及它在所有时间段的表现。 增加的新功能是动态市场斐波那契水平,它适应当前的市场条件变化,这是一个已经在我们的高级货币强度28和高级货币冲动指标中使用的成熟的加分项。 在交易时,总是将弱势货币和强势货币配对,这个新指标将帮助你做到这一点。 用户手册:点击这里  https://www.mql5.com/en/blogs/post/708783 特点  显示每个时间段的ACS28和GAP-speed(冲动)的货币强度值。 列:颜色代码以7种颜色
Bomb Bank Signal
Igor Pereira Calil
5 (1)
炸彈銀行訊號:您對 MetaTrader 4 的信心指標 Bomb Bank Signal 是 MetaTrader 4 的一個強大指標,旨在識別金融市場中最相關的趨勢。如果您正在尋找一種能夠準確預測運動的工具,那麼炸彈庫就是您需要的盟友。 運作原理: 該指標結合了三種不同的方法——成交量分析、蠟燭收盤價和對稱趨勢——來偵測和發出買賣機會訊號。當炸彈銀行識別出買入機會時,它就像一顆「炸彈」;當它偵測到賣出訊號時,它就像一個「頭骨」。 為什麼炸彈銀行不一樣? 完全可靠性:炸彈庫訊號不會刪除訊號。訊號一旦發出,就會一直存在,確保您不會錯過任何機會。 極為準確:炸彈庫不會發出錯誤訊號。它會即時更新您的訊息,隨著市場的變化進行調整,但保持先前訊號的透明度。 即時更新:訊號被即時識別並在必要時更新,使您能夠快速響應市場變化。 最大化您的結果: 炸彈銀行訊號是識別趨勢持續走勢的理想選擇。例如,如果您已經做空並且指標在 M15 發出買入訊號,那麼現在就是平倉或部分下單的最佳時機,反之亦然。 此外,經過仔細分析,我們建議您遵循M30、H1和H4上的訊號,停損僅50點。這使
Currency Strength Wizard
Oleg Rodin
4.93 (44)
货币强度向导是一个非常强大的指标,为您提供成功交易的一体化解决方案。该指标使用多个时间范围内所有货币的数据来计算这个或那个外汇对的力量。此数据以易于使用的货币指数和货币电力线的形式表示,您可以使用它们来查看这种或那种货币的力量。 您所需要的只是将指标附加到您要交易的图表上,该指标将向您显示您交易的货币的真实强度。该指标还向您显示买卖量压力的极值,您可以在顺势交易时利用这些压力。该指标还显示了基于斐波那契的可能目标。该指标可用于各种交易时间范围。该指标支持各种货币对的交易。 该指标为您提供所有类型的警报,包括推送通知。 购买后请联系我。我将与您分享我的交易技巧,并免费为您提供丰厚的红利指标! 祝您交易愉快,获利丰厚!
TakePropips Donchian Trend Pro
Eric John Pajarillaga Aldana
4.44 (16)
TakePropips Donchian Trend Pro   (MT4) 是一款功能强大且有效的工具,可使用 Donchian 通道自动检测趋势方向,并为您提供进场和退场交易信号! 这个多功能指标包括趋势扫描器、交易信号、统计面板、筛选器、交易时段和警报历史仪表板。它旨在为您提供交易信号并节省您分析图表的时间! 您可以在我们的博文中下载用户手册和安装指南:   https   :// www.mql5.com/en/blogs/post/751368 今天立减 50%!价格从 98 美元降到 49 美元! 您可以在 Strategy Tester 上测试该指标(启用可视模式) 视频教程也可在说明下方获得更多详细信息。 如果您有任何问题或需要任何帮助,请与我联系。 TakePropips Donchian Trend Pro 指标适用于所有外汇对、金属、商品、指数和加密货币。 主要特点 交易信号 - 检测多个时间范围内所有货币对的买卖机会。它将为您提供警报并在图表上绘制交易信号,最多 3 个止盈价和一个止损价。 Trend Scanner   - 用于快速扫描和识别跨多个时间
Supply and Demand Dashboard PRO
Bernhard Schweigert
4.8 (20)
目前八折优惠! 这个仪表板是一个非常强大的软件,可用于多个符号和多达9个时间段。 它是基于我们的主要指标(最佳评论:高级供应需求)。 Advanced Supply Demand 该仪表板提供了一个伟大的概述。它显示。   筛选后的供需值,包括区域强度评级。 区间内和区间外的点位距离。 它突出了嵌套的区域。 在所有(9个)时间段内,它对所选符号发出4种警报。 它是高度可配置的,以满足您的个人需求! 您的利益! 对每个交易者来说,最重要的问题是。 什么是入市的最佳水平? 在强大的供应/需求区域内或附近进入你的交易,以获得最佳的成功机会和风险/回报。 我的止损的最佳位置是哪里? 把你的止损放在强势供应/需求区的下方/上方是最安全的。 我的最佳盈利目标是什么? 你的退出策略和你的进入策略一样重要,了解更高的时间框架图可以帮助你。对于买入,使用下一个供应区作为目标,对于卖出,使用下一个需求区作为目标。在回撤到供应区或需求区时进场,以确保有足够的利润空间,达到更高的时间框架的供应和需求,将增加你的利润。 为什么我们要过滤强区和
Advanced Currency Strength28 Indicator
Bernhard Schweigert
4.9 (649)
目前26%的折扣 任何新手或专家交易者的最佳解决方案! 这个指标是一个独特的、高质量的、可负担得起的交易工具,因为我们纳入了一些专有的功能和一个新的公式。只需一个图表,你就可以读出28个外汇对的货币强度!想象一下,你的交易将如何得到改善,因为你的交易是在你的手中进行的。想象一下,你的交易将如何改善,因为你能够准确地确定新趋势或剥头皮机会的触发点? 用户手册:点击这里  https://www.mql5.com/en/blogs/post/697384 这是第一本,原版的! 不要买一个毫无价值的崇拜者的克隆品。 特别的 子窗口中的箭头显示强劲的货币势头GAP将指导你的交易! 当基础货币或报价货币处于超卖/超买区域(外盘斐波那契水平)时,在个人图表的主窗口中出现警告信号。 当货币力量从外围区间回落时,回撤/反转警报。 十字星模式的特别警报 可选择多个时间框架,以快速查看趋势! 货币强度线在所有的时间框架中都非常平稳,当使用较高的时间框架来识别总体趋势,然后使用较短的时间框架来确定精确的入口时,效果非常好。你可以根据自己的意愿选择任何时间框架。每个时间框架都由其自身进
Advanced Currency IMPULSE with ALERT
Bernhard Schweigert
4.9 (480)
目前31%的折扣!! 对任何新手或专家交易者来说都是最好的解决方案! 这个指标是一个独特的、高质量的、负担得起的交易工具,因为我们已经纳入了一些专有的功能和一个秘密的公式。只需一张图表,它就能给出所有28种货币对的警报。想象一下,你的交易将如何改善,因为你能够准确地确定新趋势或剥头皮机会的触发点 建立在新的基础算法上,它使识别和确认潜在交易变得更加容易。这是因为它以图形方式显示了一种货币的强势或弱势是否正在加速,并测量了这种加速的速度--把它想象成你汽车中的速度表。当你加速时,事情显然会发生得更快,这在外汇市场上也是一样的,即如果你配对的货币正在向相反的方向加速,你就会发现一个潜在的有利可图的交易。 货币动量的垂直线和箭头将指导你的交易! 动态的市场斐波那契23水平被用作警报触发器,将适应市场活动。如果冲动触及黄色触发线,您将在MetaTrader或您的电子邮件或推送警报中收到警报。然后你就知道作为一个交易员应该做什么。货币对和方向已经给出。只要点击警报按钮,就可以切换到该货币对或打开一个新的图表,以便进一步分析。警报级别可以通过用户输入来改变,可以选择3个敏感度级别
Gold Channel XAUUSD
Paulo Rocha
5 (2)
Gold Channel is a volatility-based indicator, developed with a specific timing algorithm for the XAUUSD pair, which consists of finding possible corrections in the market. This indicator shows two outer lines, an inner line (retracement line) and an arrow sign, where the theory of the channel is to help identify overbought and oversold conditions in the market. The market price will generally fall between the boundaries of the channel. If prices touch or move outside the channel it is a tra
PRO Renko System
Oleg Rodin
5 (25)
PRO Renko Arrow Based System for trading renko charts.  准确的信号交易任何外汇工具. 另外,我将免费提供系统的附加模块! PRO Renko系统是RENKO图表上高度准确的交易系统。该系统是通用的。 该交易系统可应用于各种交易工具。 该系统有效地中和了所谓的市场噪音,打开了获得准确反转信号的通道。 该指标易于使用,只有一个参数负责产生信号。 您可以很容易地使算法适应您感兴趣的交易工具和renko酒吧的大小。 我很乐意通过提供任何咨询支持来帮助所有客户有效地使用该指标。 祝您交易成功!购买后,立即写信给我! 我将与您分享我的建议和我的renko发电机。 另外,我将免费提供系统的附加模块!
Order Block Hunter
Noha Mohamed Fathy Younes Badr
5 (4)
Order block hunter indicator is the best indicator for  hunt the order blocks that area where there has been a large concentration of limit orders waiting to be executed Order blocks are identified on a chart by observing previous price action and looking for areas where the price experienced significant movement or sudden changes in direction .This indicator does that for you by using very complicated codes and helps you to take the best areas To buy and sell because it make marks at the best a
Advanced Supply Demand
Bernhard Schweigert
4.91 (294)
现在优惠 33%! 任何新手或专业交易者的最佳解决方案! 该指标是一款独特、高质量、且价格合理的交易工具,因为我们已经整合了许多专有功能和新公式。 依据此更新,您将能够显示双重时间帧区域。 您不仅可以显示一个较高的时间帧,还可以同时显示图表时间帧,加上更高的时间帧:显示嵌套时区。 供需双方所有交易者都会喜欢它。 :) 重要信息披露 高级供需的最大潜力,请访问 https://www.mql5.com/zh/blogs/post/720245   想象您的交易如何得以改善,是因为您能够精准定位入场或目标位吗? 构建于新的底层算法,它可以更轻松地识别出买卖双方之间的潜在失衡。 这是因为它以图形方式展示供需最强劲区域,及其过去的表现(显示旧区域)。 这些功能旨在帮助您更轻松地发现最佳入场区域和价位。 现在您可以针对您的交易品种和时间帧来优化和编辑区域强度! 高级供需指标适用于所有产品和时间帧。 它是一个新的公式,非常新的功能是两个区域强度函数可由用户输入进行调整! 这在交易中是一大优势。 当您学习如何使用专有功能,例如带有价格游离最小 X 因子的区域强度时,您能够判断该区域强劲与否。 供
PZ Day Trading
PZ TRADING SLU
3.67 (3)
该指标仅使用价格行为分析和donchian渠道以锯齿形检测价格反转。它是专门为短期交易而设计的,根本不需要重新粉刷或补漆。对于精明的交易者来说,这是一个绝佳的工具,旨在增加他们的运作时间。 [ 安装指南 | 更新指南 | 故障排除 | 常见问题 | 所有产品 ] 极易交易 它在每个时间段都提供价值 实施自我分析统计 它实现了电子邮件/声音/视觉警报 基于可变长度的突破和拥挤区域,该指标仅使用价格行为来选择交易并对市场快速做出反应。 显示过去信号的潜在利润 该指标分析其自身的质量和性能 突围的损失突出显示并解决 该指标是不可重涂和不可重涂的 该指标将帮助盘中交易者不要错过单个价格反转。但是,并非所有价格反转都是一样的,也不是具有相同的可行质量。决定要突破哪些突破而忽略哪些取决于交易者的良好判断。 如何解释统计数据 该指标研究其自身信号的质量,并在图表上绘制相关信息。将分析每笔交易,并在图表的左上角显示总体历史结果,这使您可以针对任何给定的工具和时间范围自行优化指标参数。每个乐器和时间表都有其自己的最佳设置,您可以自己找到它们。 最大优惠交易:对于任何给定的交易,MFE都是
使用我们的自定义MT4指标发现成功外汇交易的秘诀! 您是否曾经想过如何在外汇市场上取得成功,一贯赚取利润,同时降低风险? 这是您一直在寻找的答案! 允许我们介绍我们的专有MT4指标,该指标将彻底改变您的交易方法。 独特的多功能性 我们的指标专为喜欢Renko和Rangebar Candle编队的用户而设计。 我们了解到,这些图表类型受到许多经验丰富的交易者的青睐,这就是为什么我们的指标与它们无缝集成,从而提供无与伦比的市场分析。 清晰的趋势信号 忘记复杂的分析! 我们的指标利用鲜艳的色彩和清晰的点结构来明确指示市场趋势。 红色和蓝色的点毫无疑问地对价格变动的方向留下了疑问,从而可以在您的交易中快速决策。 与HH/HL HL/LL策略对齐 如果您正在寻求一个指标,该指标无缝地与基于HH/HL和HL/LL结构的策略无缝合作,则不需要更多。 我们的工具不仅确定了这些形式,而且还促进了它们在投资过程中的有效利用。 绝对的清晰度和简单性 我们的首要任务是为您提供一种不仅有效而且易于使用的工具。 我们的指标是为了清晰而设计的,使您可以专注于做出投资决策,而不是
Currency Strength Exotics
Bernhard Schweigert
4.87 (30)
目前8折优惠! 对任何新手或专家交易者来说都是最好的解决方案! 这个指标是专门用来显示任何符号的货币强度,如异国货币对、商品、指数或期货。它是同类产品中的第一个,任何符号都可以添加到第9行,以显示黄金、白银、石油、DAX、US30、MXN、TRY、CNH等的真实货币强度。这是一个独特的、高质量的、负担得起的交易工具,因为我们已经纳入了一些专有的功能和一个新的公式。想象一下,你的交易将如何改善,因为你能够准确地确定新趋势或剥头皮机会的触发点? 用户手册:点击这里   https://www.mql5.com/en/blogs/post/708876 它适用于所有时间框架。你将很快能够看到TREND! 根据新的基础算法设计,它使识别和确认潜在交易变得更加容易。这是因为它以图形方式显示了8种主要货币和一种符号的强弱。 该指标显示了8种主要货币(澳元加元瑞士法郎欧元英镑日元新西兰美元)的强弱线,再加上一个符号! 该指标显示了符号的真实价值。例如:对于XAUUSD(黄金):价格以美元报价。如果黄金在上涨,你怎么能知道是黄金的强势还是美元的弱势?只有当黄金走强时,我们才会进行
Quantum Trend Monitor Indicator
QUANTUM TRADING SOFTWARE LIMITED
Currency pairs never go up or down in a straight line. They rise and fall constantly, creating pullbacks and reversals. And with each rise and fall, so your emotions rise and fall. Hope, then fear, then hope. This is when the market will try to frighten you out of a strong position. It is when you are most vulnerable. But not if you have the Quantum Trend Monitor. And here, you even get two indicators for the price of one! The Quantum Trend Monitor has been designed to absorb these temporary pau
Quantum Volume Point of Control Indicator
QUANTUM TRADING SOFTWARE LIMITED
5 (1)
The Quantum VPOC indicator has been developed to expand the two dimensional study of volume and price, to a three dimensional one which embraces time. The volume/price/time relationship then provides real insight to the inner workings of the market and the heartbeat of sentiment and risk which drives the price action accordingly. The Quantum VPOC indicator displays several key pieces of information on the chart as follows: Volume Profile - this appears as a histogram of volume on the vertical pr
XQ Indicator MetaTrader 4
Marzena Maria Szmit
3.67 (3)
Step into the realm of Forex trading with confidence and precision using XQ, a cutting-edge Forex indicator designed to elevate your trading game to unprecedented heights. Whether you're a seasoned trader or just stepping into the world of currency exchange,   XQ Forex Indicator   empowers you with the insights and signals needed to make informed trading decisions. The signal conditions are a combination of three indicators, and XQ Forex Indicator only display  medium and long-term trends . The
Sense
Ivan Stefanov
SENSE 是一个自动系统,它将选定的 GANN 方法与分形计算相结合。系统会告诉我们在哪里开仓,在哪里平仓。无需再将时间浪费在复杂的计算上 - SENSE 会为您完成一切。只需安装指标即可。 基本原则: 当价格高于白线时,市场看涨 在白线上方买入,在白线下方止损 绿线为上涨目标 当价格低于白线时,市场看跌。 在白线下方卖出,在白线上方止损 红线为下行目标 双绿线或红线表示较强的区域。 为什么是 SENSE? 获利目标: SENSE 自动设置获利目标,帮助您最大限度地提高交易成功率。 自动适应: 该指标可自动重新计算任何时间框架,提供准确可靠的信号,无需手动调整。 非常适合剥头皮交易。 查看演示版! SENSE 是一个自动系统,它将选定的 GANN 方法与分形计算相结合。系统会告诉我们在哪里开仓,在哪里平仓。无需再将时间浪费在复杂的计算上 - SENSE 会为您完成一切。只需安装指标即可。 基本原则: 当价格高于白线时,市场看涨 在白线上方买入,在白线下方止损 绿线为上涨目标 当价格低于白线时,市场看跌。 在白线下方卖出
NextCandlePredictor No Repaint
Martin Alejandro Bamonte
1 (1)
NextCandlePredictor 指标 NextCandlePredictor 是一种带有警报的信号指标,不会重绘,不会改变颜色,不会移动,不会消失且没有延迟。它将帮助您识别任何时间框架内的下一个或即将到来的蜡烛的方向。高度推荐用于纽约、伦敦或甚至两者重叠等高波动市场。 主要特征: 时间框架的多功能性: 提供在任何时间框架内快速准确的信号,从 M1 到 H1 及更长时间。 清晰的买入/卖出信号: 使用 ADX 的 DI+ 和 DI- 线生成清晰的买入和卖出信号,确保您做出最佳的交易决策。 直观的可视化: 信号直接显示在图表上,绿色(买入)和红色(卖出)箭头,允许快速和轻松的读取。 可自定义的设置: 根据您的偏好和交易策略调整分析的柱数和警报选项。请根据您希望使用的 TF 查看下面的建议表。 即时和蜡烛收盘时的可选警报: 默认情况下,警报会在满足 ADX 条件的同一蜡烛上发出,确保信号的及时性。您还可以选择在当前蜡烛收盘时接收警报以获得更多确认。 快速性能: 设计为高效运行,理想用于高频操作和快速决策。 不重绘: 一旦信号发出,它将固定在当前蜡烛上,不会移动、改变颜色或消失。 无延
TrendDecoder Premium
Christophe Pa Trouillas
5 (7)
确定范围和下一步可能的走势   |  获得早期信号和趋势强度   |  在反转之前获得明确的退出   |  了解价格将测试哪些斐波水平 非重绘、非延迟指标 - 手动和自动交易的理想选择 - 适用于所有资产和所有时间单位 剩余 5 份,售价 $69 - 然后 $99 购买后,请联系我以获取您的 免费 TrendDECODER_Scanner MT5   版本: 点击此处 使用   BladeSCALPER   和   PowerZONES   获取我们的完整方法 它是什么? TrendDECODER 集多种创新于一身,使趋势监测变得简单易行。 投射趋势线(Projective TrendLine)--快速参考即将到来的趋势 实时趋势线(RealTime TrendLine)与投射趋势线(Projective TrendLine)的对比 - 与之前的同方向走势相比,市场是加速还是放缓? 实时趋势线交叉 - 趋势正在偏离轨道 使用 GreyBox - 市场不再是趋势并进入新的过渡序列 使用 DecoderSignals 和 Blue/Orange Clouds - 利用作
作者的更多信息
Vortex Trend Indicator
Francesco Petralla
4.33 (3)
Developed by Etienne Botes and Douglas Siepman, the Vortex Indicator consists of two oscillators that capture positive and negative trend movement. In creating this indicator, Botes and Seipman drew on the work of Welles Wilder and Viktor Schauberger, who is considered the father of implosion technology. Despite a rather involved formula, the indicator is quite straightforward to understand and easy to interpret. A bullish signal triggers when the positive trend indicator (VI+ green line) crosse
FREE
Banks Day Levels
Francesco Petralla
This indicator calculates and draws bank levels from a minimum of three days to a maximum of ten days. It is very useful to trade the breakout or the pullback and when the price levels break the highest or lowest level, indicating an imminent explosion of volatility. Best use with Pips Average Range indicator. Parameters settings numbers_of_day - from 3 to 10 (better use on 10 days). levels_High_color - set color for High levels. levels_Low_color - set color for Low levels.
Pips Average Range
Francesco Petralla
This indicator compares the pips of the current day with the average of pips made in the previous three days. The "Percentage today range" is red if today's figure is less than the range of the previous three days, but turns green when the percentage exceeds 100%. When the range exceeds 100% there are good trading opportunities because we are in the presence of increased volatility of the past three days. Best use with Banks Day Levels indicator. Parameters settings corner (indicator display p
This indicator provides useful information for quantitative analysis. It compares the 28 pairs' pips of the current day with the average of pips made in the previous three days. When in the last three days the pips value is low and the value of today's pips is below, we are in the presence of a volatility compression that will explode soon. The "Range Today" is red if today's figure is less than the range of the previous three days, but turns green when the percentage exceeds 100%. When the rang
IDNR4 and 7 28 Pairs Radar
Francesco Petralla
5 (1)
This indicator detects IDRN4 and IDNR7 two powerful patterns on 28 pairs on new daily bar. IDNR4 is the acronym for "Inside Day Narrow Range 4" where "Inside Day" is a lower high and higher low than the previous bar and "Narrow Range 4" is a bar with the narrowest range out of the last 4 bars so "Narrow Range 7" out of the last 7 bars. Hence, ID/NR4 and better ID/NR7 are an objective criterion for identifying days of decreased range and volatility. Once we find an ID/NR4 or an ID/NR7 pattern, we
This indicator detects Inside Bar Narrow Range 4 and Inside Bar Narrow Range 7 two powerful patterns on 28 pairs on all timeframes.  "Inside Bar Narrow Range 4"  is an inside bar with the narrowest range out of the last 4 bars so "Inside Bar Narrow Range 7" an inside bar with the narrowest range  out of the last 7 bars. Hence, IBNR4 and better IBNR7 are an objective criterion for identifying  decreased range and volatility. Once we find an IBNR4 or an IBNR7 pattern, we aim to trade the breakou
This ALL IN ONE indicator detects Inside Bar Narrow Range 4 and Inside Bar Narrow Range 7 two powerful patterns on 17 CFD on all timeframes.  "Inside Bar Narrow Range 4"  is an inside bar with the narrowest range out of the last 4 bars so "Inside Bar Narrow Range 7" an inside bar with the narrowest range  out of the last 7 bars. Hence, IBNR4 and better IBNR7 are an objective criterion for identifying  decreased range and volatility. Once we find an IBNR4 or an IBNR7 pattern, we aim to trade th
This indicator detects IDRN4 and IDNR7 two powerful patterns on 28 pairs on new daily bar. IDNR4 is the acronym for "Inside Day Narrow Range 4" where "Inside Day" is a lower high and higher low than the previous bar and "Narrow Range 4" is a bar with the narrowest range out of the last 4 bars so "Narrow Range 7" out of the last 7 bars. Hence, ID/NR4 and better ID/NR7 are an objective criterion for identifying days of decreased range and volatility. Once we find an ID/NR4 or an ID/NR7 pattern, we
筛选:
无评论
回复评论
版本 1.1 2020.03.24
Upgrade to current compilator