Noize Absorption Index - is the manual trading system that measures the difference of pressure between bears forces and bulls forces. Green line - is a noize free index that showing curent situation. Zero value of index shows totally choppy/flat market.Values above zero level shows how powerfull bullish wave is and values below zero measures bearish forces.Up arrow appears on bearish market when it's ready to reverse, dn arrow appears on weak bullish market, as a result of reverse expectation.
RSI Currency Strength Meter is a powerful and elegant multi-currency indicator that measures the real-time relative strength of the 8 major currencies using RSI logic. By calculating the smoothed performance of each currency across its major pairs and applying the RSI formula, it delivers clean and responsive strength lines that make it easy to spot which currencies are truly strong or weak at any moment. This indicator is particularly useful for visualizing currency correlations and divergence
US30 Ninja is a 5 minute scalping indicator that will let know you when there is a trade set up (buy or sell). Once the indicator gives the trade direction, you can open a trade and use a 30 pip stop loss and a 30 pip to 50 pip take profit. Please trade at own own risk. This indicator has been created solely for the US30 market and may not yield positive results on any other pair.
Was: $249 Now: $99 Market Profile defines a number of day types that can help the trader to determine market behaviour. A key feature is the Value Area, representing the range of price action where 70% of trading took place. Understanding the Value Area can give traders valuable insight into market direction and establish the higher odds trade. It is an excellent addition to any system you may be using. Inspired by Jim Dalton’s book “Mind Over Markets”, this indicator is designed to suit the
Visual CrossPulse Dynamics: Trade with the Market's True Rhythm Unlock a new level of market insight with Visual CrossPulse Dynamics, a sophisticated trading indicator designed to adapt to ever-changing volatility and reveal the true direction of the trend. Are you tired of indicators that lag in fast-moving markets or give false signals during consolidation? The Visual CrossPulse Dynamics indicator solves this problem by using an advanced, adaptive algorithm that intelligently adjusts to the m
TRI Visualizer MT5 – Thermodynamic Market Analysis Overview
The TRI (Thermal Range Indicator) Visualizer Enhanced is a rare market analysis indicator that goes beyond conventional technical analysis, applying principles of thermodynamics from physics. It interprets market price fluctuations as “thermodynamic energy,” enabling the highly accurate detection of subtle market changes that are often overlooked. Innovative Mechanisms 1. Dual Calculation Engines Classic TRI Mode Formula: |Close
Introducing the Power Trade Plus indicator designed by a small group of traders with a few years of experience trading the market profitably. The Power Trade Plus is derived from the Power Trade indicator, the indicator strive in powerful sniper entries and take profit levels, with an algorithm that's can determine the markets volatility and Provides entries based on the current market volatility. This indicator is much more effective in stock ,currencies and indices.
ID Trade_Bot BS - an effective tool for automated trading using RSI Trade_Bot BS is an efficient solution for automated trading based on RSI, allowing flexible parameter customization and risk management. Thanks to the ability to choose a trading mode, dynamic Stop-Loss and Take-Profit levels, and trading mode adjustment (buying, selling, or both), it is suitable for various trading strategies. Key Features: Uses the RSI indicator to determine market conditions. Automatically opens an
You can change the time period of the chart at the touch of a button. You can also change multiple charts at the touch of a button. You can also change multiple charts at the touch of a button, saving you the trouble of changing time periods.
We are live-streaming the actual operation of the system. Please check for yourself if it is usable. Please check it out for yourself. https://www.youtube.com/@ganesha_forex
We do not guarantee your investment results. Investments should be made at you
This Volume Delta Profile is an advanced MetaTrader 5 indicator that visualizes volume delta (order flow imbalance) using a volume profile-style histogram. It shows the difference between buying and selling pressure at specific price levels, helping traders identify supply and demand zones. This indicator provides a unique perspective on market dynamics by visualizing the imbalance between buying and selling pressure, offering insights beyond traditional volume analysis. Core Concept Positiv
Mine Farm is one of the most classic and time-tested scalping strategies based on the breakdown of strong price levels.
Mine Farm is the author's modification of the system for determining entry and exit points into the market...
Mine Farm - is the combination of great potential with reliability and safety.
Why Mine Farm?!
- each order has a short dynamic Stop Loss
- the advisor does not use any risky methods (averaging, martingale, grid, locking, etc.)
- the advisor tries to get the most
** All Symbols x All Timeframes scan just by pressing scanner button ** Discount: The price is $50$, But now it is just $39, Limited time offer is active.
*** Contact me to send you instruction and add you in "Trend Reversal group" for sharing or seeing experiences with other users. Introduction: Trendlines are the most famous technical analysis in trading . Trendlines continually form on the charts of markets across all the different timeframes providing huge opportunities for traders
Welcome to the Ultimate Harmonic Patterns recognition indicator that is focused to detect advanced patterns. The Gartley pattern, Bat pattern, and Cypher pattern are popular technical analysis tools used by traders to identify potential reversal points in the market.
Our Ultimate Harmonic Patterns recognition Indicator is a powerful tool that uses advanced algorithms to scan the markets and identify these patterns in real-time.
With our Ultimate Harmonic Patterns recognition Indicator, you ca
Advanced Volume Profile Analysis Tool for MetaTrader 5 The Kecia Volume Profile Order Finder provides traders with volume profile analysis capabilities. This MT5 indicator combines volume profile visualization with statistical calculations to help identify potential trading opportunities and suggests entry, stop loss, and take profit levels based on market structure. Market Profile Visualization Transform your chart with customizable volume profile visualizations: Multiple visualization options
## ONLY GOLD
## Тiльки Золото
## **Mercaria Professional Trading Zones - Complete Guide** ## **Mercaria Professional Trading Zones - Повний посібник**
### **How Mercaria Zones Work / Як працюють зони Mercaria**
**English:** Mercaria Zones is an advanced trading indicator that identifies high-probability support and resistance areas using ZigZag extremes combined with mathematical zone calculations. The indicator works on multiple timeframes simultaneously, providing a comprehensive view
Harvester Pro Universal Master The Ultimate Volatility Breakout & Trend-Following Solution for XAUUSD and Major Pairs. Harvester Pro Universal Master is a professional-grade Expert Advisor (EA) engineered for high-performance trading on the MetaTrader 5 (MT5) platform. Optimized specifically for XAUUSD (Gold) and major currency pairs like EURUSD , this EA combines a sophisticated Volatility Breakout engine with a robust EMA/TEMA Trend-Following filter to capture explosive market moves with surg
You already have positions open. The question is whether the episode is still under control. Floating P/L tells you the result. It does not tell you the condition. A position group can still show a small gain while inventory load, hold time, adverse drift, weakening recovery, and spread expansion are already building pressure in the background. By the time the P/L number turns negative, the episode is already stressed. Episode Health Monitor was built to surface those conditions before they beco
Trading Utility for Forex Currency Pairs Only not for Gold Functions Auto Lot Calculation based on Risk Auto stoploss Auto TakeProfit Breakeven Auto Close Half % Close in percentage with respect to the PIPs Pending Orders BuyLimit Sell Limit with distances BuyStop Sell Stop with distances Trading Informations Risk in percentage For Multiple trades Combine Takeprofit and Combine Stoplosses
Here our more valuable tools
SMC Trend Trading , Easy SMC Trading , Institutional SMC Architect Volume Analysis Tools , Volume flow Profile , Market volume profile , FVG with Volume , Liquidity Heatmap Profile , Volume Spread Analysis
The Fractals_Price indicator is a technical analysis tool that identifies fractal patterns on price charts. Fractals are recurring patterns that signal potential trend reversals or continuation points. This indicator marks both upward and downward
Weighted average price indicator or VWAP. The well-known standard VWAP with the beginning of the day is added with the function of selecting the periodization. It can be calculated both every day and on other periods. Also the indicator allows to exclude the volume from the calculation, which will allow using it on the cryptocurrencies and forex. There is an alert for a VWAP price crossing. There are 1 and 2 standard deviation. Settings: Volume: turning volume on and off in the calculation mecha
No Demand No Supply This indicator identifies No Demand –No Supply candles to your chart and plots volume bars colored according to the signal. It can be applied to all timeframes or to a specific one only. It can also be used as regular volume indicator with exceptional future of WEIGHTED VOLUME. Furthermore is has an alert notification, sound and email when a signals occurs. The indicator does not repaint but the alert will come on two candles back due to the definition of No Demand No Su
Step into the world of Forex trading with confidence, clarity, and precision using Gold Indicator a next-generation tool engineered to take your trading performance to the next level. Whether you’re a seasoned professional or just beginning your journey in the currency markets, Gold Indicator equips you with powerful insights and help you trade smarter, not harder. Built on the proven synergy of three advanced indicators, Gold Indicator focuses exclusively on medium and long-term trends elimina
Daily Bias Indicator with Statistics and Dashboard Unlock the power of market bias analysis with the Multi-Timeframe Bias Indicator, a versatile tool designed for traders seeking a clear edge in the markets. This indicator provides actionable insights by displaying Daily Bias, Weekly Bias, and Custom Period Bias, enabling you to align your trades with the prevailing market direction across multiple timeframes and symbols. Key Features: Daily Bias Analysis: Identify the bullish, bearish, or neutr
TradePilot Expert Advisor (EA) for MetaTrader 5 TradePilot is a professional and user-friendly Expert Advisor (EA) for MetaTrader 5 (MT5) . It simplifies automated trading , risk management , and trade execution with a smart trading panel . Perfect for beginners and experienced traders looking for a reliable trade manager EA with automated lot size calculation and smart position management. Key Advantages User-Friendly Trading Panel: Customizable panel with buttons and hotkeys for fast ex
Neuro Poseidon is a new indicator by Daria Rezueva. It combines precise trading signals with adaptive TP/SL levels - creating best possible trades as a result!
Message me and get Neuro Poseidon Assistant as a gift to automize your trading process!
What makes it stand out?
1. Proven profitability on all assets and timeframes
2. Only confirmed BUY and SELL signals present on the chart
3. Adaptive TP & SL levels generated by the software for each trade
4. Easy to understand - suitable for al
SignalTech is an unique fully rule based trading system delivers an Institutional approach for both Independent Traders and Prop Firm Challengers. Never Repaint. Push Notification available. No over-optimization. All the winning trades with chart setups are published on the comments page. 2026-05 4107 Pips (Until 05-29 NY Closed) 2026-04 2243 Pips 2026-03 2165 Pips 2026-02 2937 Pips 2026-01 2624 Pips 2025-12 1174 Pips It can generate signals with Buy/Sell Arrows, Push Notification (To Mobile) an
PrimeScalping is a powerful trading companion designed to generate high-probability entry signals with dynamic TP/SL/DP levels based on volatility. Built-in performance tracking shows win/loss stats, PP1/PP2 hits, and success rates — all updated live.
Key Features: Buy/Sell signals with adaptive volatility bands Real-time TP/SL/DP levels based on ATR Built-in MA Filter with optional ATR/StdDev volatility Performance stats panel (Success, Profit/Loss, PP1/PP2) Alerts via popup, sound, push, or e
SmartScalping is a powerful trading companion designed to generate high-probability entry signals with dynamic TP/SL/DP levels based on volatility. Built-in performance tracking shows win/loss stats, PP1/PP2 hits, and success rates — all updated live.
Key Features: Buy/Sell signals with adaptive volatility bands Real-time TP/SL/DP levels based on ATR Built-in MA Filter with optional ATR/StdDev volatility Performance stats panel (Success, Profit/Loss, PP1/PP2) Alerts via popup, sound, push, or e
ARIPoint is a powerful trading companion designed to generate high-probability entry signals with dynamic TP/SL/DP levels based on volatility. Built-in performance tracking shows win/loss stats, PP1/PP2 hits, and success rates all updated live. Key Features: Buy/Sell signals with adaptive volatility bands Real-time TP/SL/DP levels based on ATR Built-in MA Filter with optional ATR/StdDev volatility Performance stats panel (Success, Profit/Loss, PP1/PP2) Alerts via popup, sound, push, or email Cu
MasterTrend Indicator for MT5
A powerful trend-following and signal-evaluation tool MasterTrend is a custom MT5 indicator that combines Moving Averages and ATR-based risk/reward logic to generate clear buy/sell signals. It visualizes dynamic SL/TP levels, evaluates past trade outcomes, and displays win/loss statistics in a clean on-chart panel. Key features include: Buy/Sell signals based on MA crossovers ATR-based SL/TP1/TP2/TP3 levels with visual lines and labels Signal outcome tracking wit
ScalpPoint is a powerful trading companion designed to generate high-probability entry signals with dynamic TP/SL/DP levels based on volatility. Built-in performance tracking shows win/loss stats, PP1/PP2 hits, and success rates — all updated live. Key Features: Buy/Sell signals with adaptive volatility bands Real-time TP/SL/DP levels based on ATR Built-in MA Filter with optional ATR/StdDev volatility Performance stats panel (Success, Profit/Loss, PP1/PP2) Alerts via popup, sound, push, or emai
MasterTrend Indicator for MT5
A powerful trend-following and signal-evaluation tool MasterTrend is a custom MT5 indicator that combines Moving Averages and ATR-based risk/reward logic to generate clear buy/sell signals. It visualizes dynamic SL/TP levels, evaluates past trade outcomes, and displays win/loss statistics in a clean on-chart panel. Key features include: Buy/Sell signals based on MA crossovers ATR-based SL/TP1/TP2/TP3 levels with visual lines and labels Signal outcome tracking wit
Gladiator Indicator: Conquer the Markets Step into the trading arena with the Gladiator Indicator, a robust and highly effective trading tool designed exclusively for MQL5. Built for traders who want clear, actionable insights, Gladiator cuts through market noise to deliver precise Buy and Sell signals right on your charts.
Whether you are a beginner looking for guidance or an experienced trader seeking a reliable confirmation tool, Gladiator provides the edge you need to battle the markets wi
BTMM State Engine Pro is a MetaTrader 5 indicator for traders who use the Beat The Market Maker approach: Asian session context, kill zone timing, level progression, peak formation detection, and a multi-pair scanner from a single chart. It combines cycle state logic with a built-in scanner dashboard so you do not need the same tool on many charts at once.
What it does
Draws the Asian session range; session times can follow broker server offset or be set in inputs. Tracks level progression (L
另有 MT4 版本可供选择 https://www.mql5.com/zh/market/product/170617
M30/H1/H4 波段版已上线 想抓住M5/M15无法捕捉的大行情? Gold Signal Swing Pro(M30/H1/H4)现已发售。 目标每笔$20-$80+。 https://www.mql5.com/en/market/product/177643
KURAMA GOLD SIGNAL PRO(MT5版)— 7层过滤器 XAUUSD完整交易系统
不重绘。不重画。不延迟。每个信号确认后永久固定。
买断版购买者专属福利:购买买断版许可证可免费获得 AI Zone Radar(价值$59)+ PDF使用手册。购买后请在MQL5上给我发消息。
AI Zone Radar: https://www.mql5.com/en/market/product/175834
在真实黄金交易员社区中使用,因
Chronos Fractal Engine is an innovative price projection indicator for MetaTrader 5, designed to transform your technical analysis by intelligently identifying and projecting historical price patterns. Built upon an advanced correlation algorithm and the fractal principles of the market, this powerful tool visualizes potential future price movements, giving you a unique edge in your trading decisions. What is Chronos Fractal Engine? At its core, the Chronos Fractal Engine employs a sophisticat
ARICoin is a powerful trading companion designed to generate high-probability entry signals with dynamic TP/SL/DP levels based on volatility. Built-in performance tracking shows win/loss stats, PP1/PP2 hits, and success rates all updated live. Key Features: Buy/Sell signals with adaptive volatility bands Real-time TP/SL/DP levels based on ATR Built-in MA Filter with optional ATR/StdDev volatility Performance stats panel (Success, Profit/Loss, PP1/PP2) Alerts via popup, sound, push, or email Cust
FlowSeeker is a custom technical indicator for MetaTrader 5 (MT5), developed by Ultron Trading Solutions ( www.ultrontradingsolutions.co.za ). It is designed to identify momentum shifts and directional changes in the market through two primary signals. Providing visual plots, optional buy/sell arrows, reversal crosses, a multi-timeframe trend panel, a candle timer, and alert notifications. It includes user-configurable settings for signals, plotting, trend trading filters, alerts, and display op
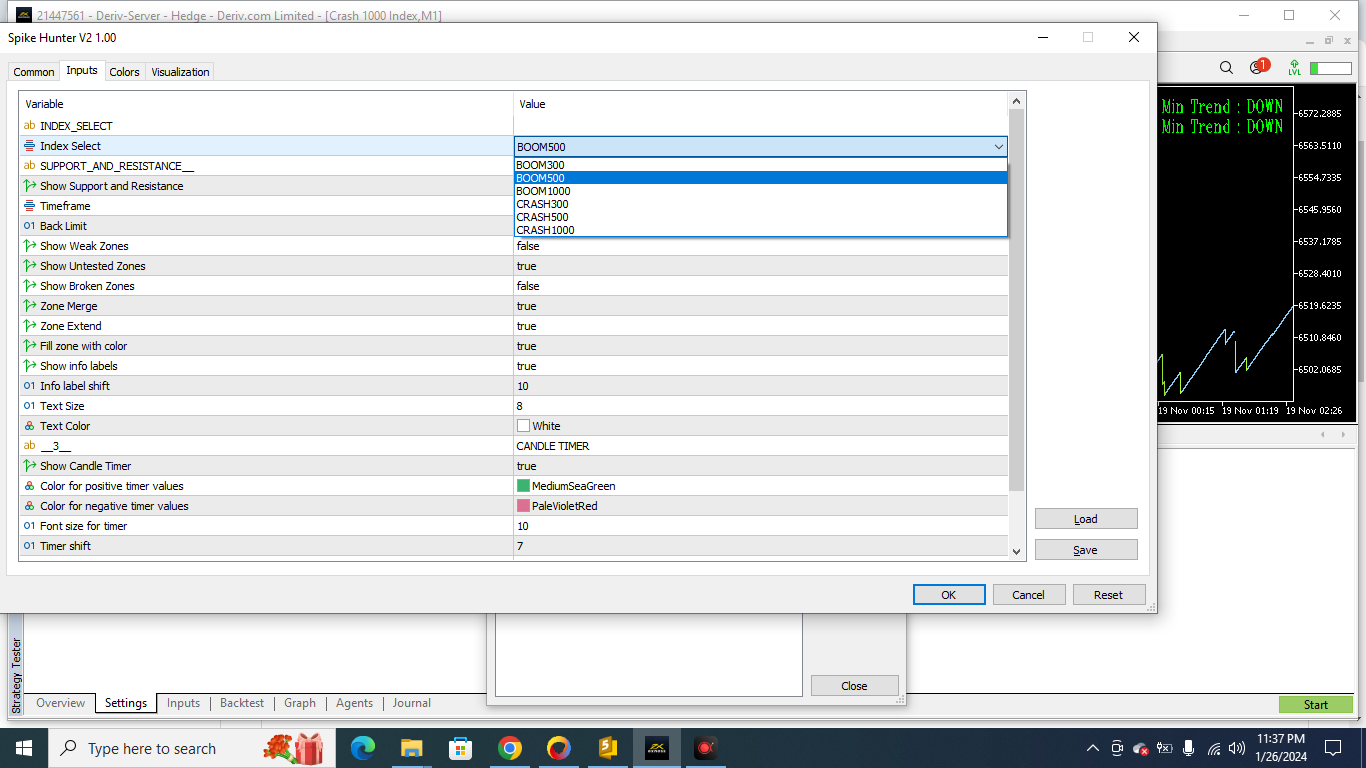
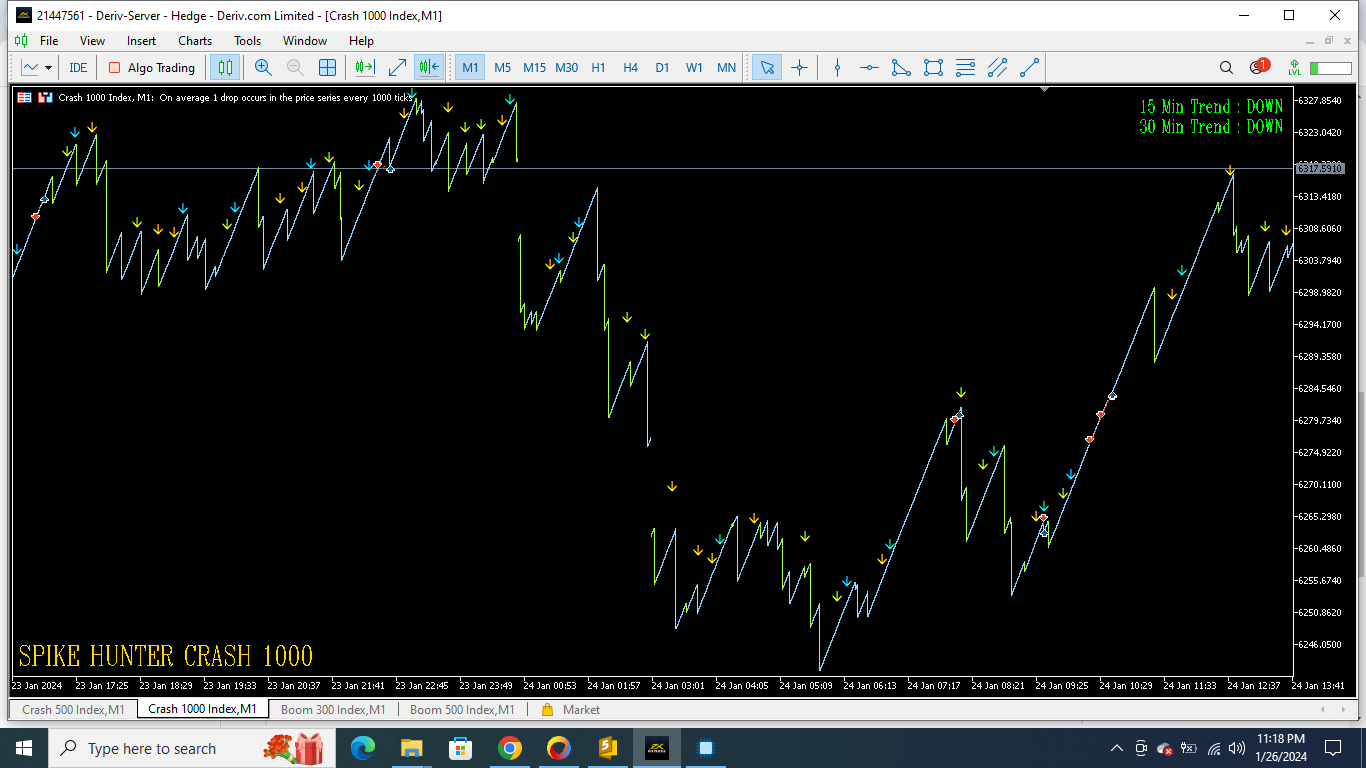
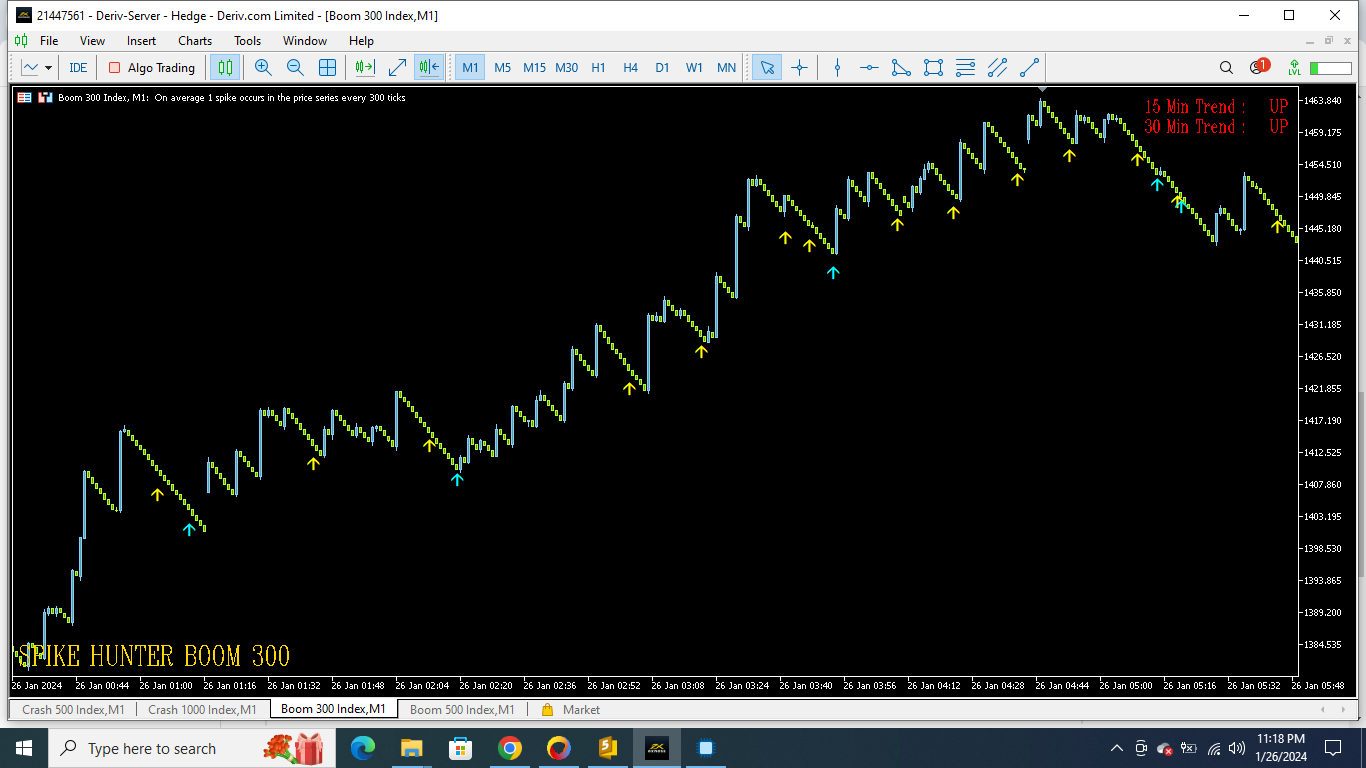
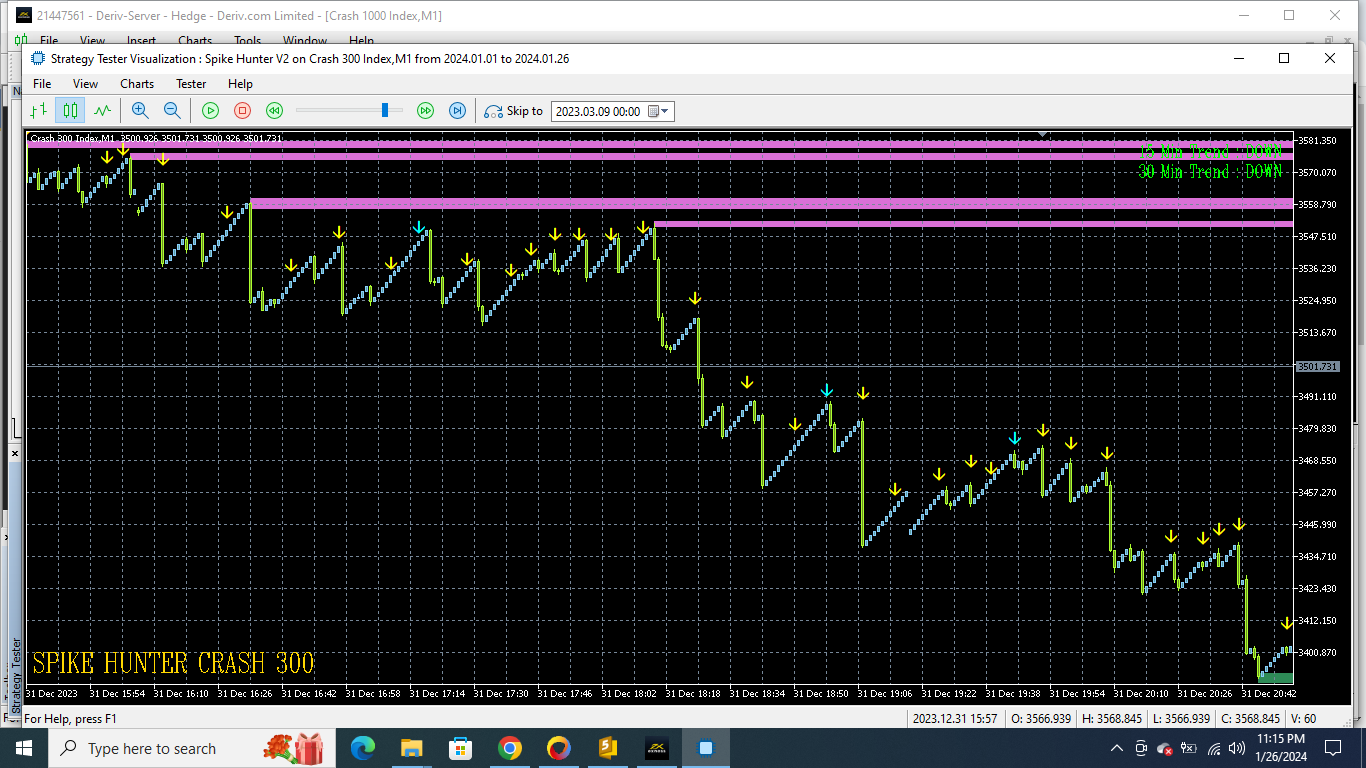
Boom Spike mater is the future for trading Boom markets. It has been designed to run on Boom 300 , 500 and 1000 markets on the 1 minute timeframe. It has 2 different trading modes (Aggressive and Normal) Aggressive mode will plot Yellow and blue arrows. 2 different conditions to help you make the right choice. Enter first trade on yellow arrow and second trade on blue candle. SL in this mode will be 10 Candles from the blue arrow. Normal mode will only plot red arrows on the chart. This mode is
ULTRON TREND MASTER
This Indicator strategy works on any volatility market together with currency pairs and gold. It uses 2 files (Ultron Trend Master 1 and 2) Due to only uploading one file. Please also download Ultron Trend Master 1 free from comment section of this indicator . The purchased file is the main file with the strategy and should be used together with Trend Master 1 File.
The only indicator on the market that will be able to trade any Vix market together with any currency pair or
The UTS Trading Stat indicator, developed by Ultron Trading Solutions, is a customizable tool designed to track and display trading statistics for the current chart's symbol. It presents a visual dashboard on the chart, offering real-time insights into trading performance with a toggleable panel (STAT SHOW/STAT HIDE) for user convenience. Below is a detailed description of its features and functionality: Trading Statistics Displayed : Current Positions : Number of open profit/loss trades and tot
UTS Signal Provider v1.1 – Ultimate Trading Signal Broadcaster for MT5 UTS Signal Provider is a powerful, professional-grade Expert Advisor (EA) for MetaTrader 5 (MT5) designed specifically for traders who want to broadcast their live trading activity as high-quality signals to private or public channels on Discord and Telegram . It turns your MT5 trading account into a fully automated signal provider, allowing followers (VIP subscribers or free members) to receive real-time updates on your trad
UTS TradeGuardian – Smart Trade Management EA (MT5) UTS TradeGuardian is a powerful trade-management Expert Advisor for MetaTrader 5 , designed to protect, manage, and optimize manually opened trades —whether you open them from MT5 on PC, mobile, or tablet . This EA does not open trades for you . Instead, it acts as a professional trade guardian , automatically managing your positions once they are open. What UTS TradeGuardian Does Automatic Stop Loss & Take Profit Once a position is opened