适用于MetaTrader 5的EA交易和指标 - 166

STAR 160 in One (MT5 EA) — 160-Strategy Multi-Market Scalper/Trader All-in-one MT5 Expert Advisor for Forex, Indices & Commodities — 160 built-in strategies, anti-martingale risk, and full automation.
No grid. No martingale. No indicator dependency (pure price-action core). STAR 160 in 1 - User Manual & Set Files Live Signals & Other Products What is STAR 160 in One? STAR 160 in One is a Swiss-army MT5 EA that packs 160 unique strategies —from breakouts and momentum pushes to regressions,

ETE Detector v4.0 (Head & Shoulders) Author: KOUAME N’DA LEMISSA
Version: 4.0
Platform: MetaTrader 5
Indicator Type: Chart / Visual Trading Signals Overview The ETE Detector v4.0 is a technical indicator designed to automatically detect classic and inverse Head & Shoulders patterns (H&S) on MT5 charts. These patterns are widely used to anticipate trend reversals. With this tool, traders can: Detect sell signals (classic H&S) and buy signals (inverse H&S) with accuracy. Easily visualize patterns
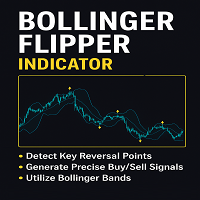
Introducing the Bollinger Flipper Indicator – Your Ultimate Trading Edge!
Are you tired of second-guessing your entries and exits? The Bollinger Flipper Indicator is here to flip the game in your favor.
Built with the power of Bollinger Bands + Level 3 Power System + ZigZag Fractals, this advanced tool is designed to spot high-probability buy & sell signals with precision.
SPECIAL BONUS (VALID TILL JUNE 2026)- OUR DAILY SCALPER EA for BTCUSD and VIX75 •································

Please contact me for the original version. (The original will be sent from my EA Telegram account.)
Hedge Martingale EA. Works only on the MT4 platform. It works on all pairs, but the most ideal symbol is XAUUSD. Recommended broker and account type: Exness Cent account. It is recommended to use it with a minimum balance of $1,000. It provides approximately 40-80% monthly profit. Hedging is more secure. The screenshots are of Exness Cent Real account transactions, not backtest results. I can s

GOLD MAX — 引领黄金交易的智能新纪元 欢迎来到黄金交易的全新境界!我们隆重推出 GOLD MAX ,隶属趋势智能交易系统家族的最新成员,专注于 XAUUSD(黄金/美元) 的精准交易。无论市场如何波动,GOLD MAX 都能以卓越的策略和稳定的表现,助您在黄金市场中把握闪耀的交易良机! 为什么选择 GOLD MAX? 智能交易,专注黄金 基于趋势交易系统,每笔交易提前布局,机会可靠、逻辑清晰 不惧怕任何回测或实盘验证,交易逻辑完全透明,杜绝虚假策略 采用先进的波动触发与价格结构入场机制 ️ 结合固定止损与移动止盈,风险可控 支持马丁、网格等多种资金管理模式 灵活适配,即装即用 支持 M5、M15、M30、H1、H2、H4 等多种时间周期 只需加载至 XAUUSD 图表,设定风险偏好,即可开启全自动交易 专注于交易质量,不追求高频交易,稳健累积收益 技术参数 交易配置 交易品种 :XAUUSD(黄金/美元),兼容 USDJPY 推荐周期 :H1、H2、H4(黄金),M30、H1(美
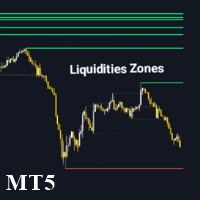
Liquidity Zone Detector 是一款高级技术指标,旨在通过使用 ZigZag 指标来识别和标注市场中的关键流动性区域。该工具通过在 ZigZag 检测到的高点和低点绘制趋势线来定位可能存在显著流动性的价格水平。Liquidity Zone Detector 帮助交易者根据流动性的累积或释放发现潜在的反转或趋势延续区域。 主要特点: 自动识别流动性区域 :在 ZigZag 指标识别的高点和低点绘制趋势线。 高级定制 :可配置流动性线的颜色、厚度和样式。 动态颜色变化 :当流动性水平被突破时,可选择更改线条颜色。 可调 ZigZag 参数 :调整 ZigZag 的深度、偏差和回溯步长以获得更精确的检测。 Liquidity Zone Detector 是分析市场结构并识别可能发生显著价格变动的关键区域的交易者的必备工具。

INDICATOR: TRIBOX SIGNAL GEN Developer: gedeegi General Description GEN TRIBOX SIGNAL is a technical indicator designed to automatically identify and visualize the 1-2-3 Pattern or price reversal pattern. This pattern is a classic price action formation frequently used by traders to detect potential trend reversals. This indicator not only displays the 1-2-3 pattern on the chart but also automatically identifies the breakout signal from the critical level (point 2) and projects Entry, Stop Loss

PS Assistance is hybrid EA. It make trade easier than general trading. It shows necessary value real time for help to trading and has button for Buy/Sell/Close All Buy/Close All Sell/especially close remain 3 orders has profit highest. It has break event line for order buy or sell. It made you get price when you have profit or you plan to order in big lots for close all. I hope you enjoy trading with my "PS Assistance".

This Expert Advisor has been developed to provide consistent trading execution with clear parameters and flexible settings for two different trading styles. Designed for both new and experienced traders, the EA comes with a straightforward setup and easy-to-adjust inputs. A powerful and fully customizable Expert Advisor designed to trade Breakouts from classic fractal patterns. Featuring versatile settings, this EA can be configured for different risk tolerance , from conservative fixed-lot to
Session Bias & Trade Signals in one tool. Detects Asia, London & NY session trends, shows bias strength, alerts bias flips, and plots Entry/SL/TP levels with R:R. Simple dashboard for quick decisions. Simple but powerful trading assistant. This indicator automatically detects the market bias during the Asia, London, and New York sessions .
It helps traders stay on the right side of the trend, avoid neutral zones, and catch bias flips with alerts. Bias Detection – Shows session bias as Bullish

BEHOLDER – 揭示时间中隐藏模式的指标 交易者的真正难题:时间盲区
每周,成千上万的交易者都会陷入同样的困境: 海量的经济事件(非农就业、CPI、利率决议、零售销售……)
极少的时间去分析相关性
只能凭“感觉”做决定,缺乏可靠的历史依据 试图手动完成这些几乎是疯狂的:
翻阅几十周的经济日历
逐一对比每个事件
试着在脑海中推算规律
花费数小时却仍然可能出错 结果呢?
错误建仓
风险管理失效
错失良机
每逢关键周都压力山大 ️ 解决方案:BEHOLDER – 能看见无形的“眼睛”
灵感来自传说中“无所不见”的生物,Beholder 能自动分析时间模式与历史相关性,发现普通交易者完全看不见的机会。 当你只能看到下周的日历时…
️ Beholder 会找到与之高度相似的历史周,并展示市场的真实反应。 全球重大事件
货币对的基础货币
货币对的报价货币
一切仅需数秒,无需手动操作 真正能带来利润的优势 1️⃣ 精准的时间定位
以前:“我觉得第X周和这次差不多……”
现在:“12月04日那周与下周100%吻合,历史

Consolidation Breakout Panel EA Consolidation Breakout Panel EA 是一个 实时智能面板 ,可同时监控多个品种和周期 (M2, M5, M15, M30, H1, D1),自动识别 价格盘整区域 并检测 突破 ,并根据成交量对突破强弱进行分类。 它是使用 突破策略 的交易者的理想工具,帮助您同时跟踪 多个市场 ,并清晰了解 各个周期的趋势方向 。 主要功能 盘整识别:
自动检测由至少 5 根连续K线 构成的盘整区域,且该区域内只有 一个最高点 和 一个最低点 。 突破信号: / → 确认突破(收盘价有效)。 大黄色箭头 = 强突破 (成交量高于盘整平均值)。 小灰色箭头 = 弱突破 (成交量低于盘整平均值)。 EMA55 趋势判定: ↑ 绿色 = 上升趋势(价格在EMA55之上且EMA55上升)。 ↓ 红色 = 下降趋势(价格在EMA55之下且EMA55下降)。 · 橙色 = 中性趋势。 多品种面板:
在一张表格中实时监控所有设置的品种,显示哪些周期正在发生突破。 一键打开图表并绘制水平线:
点击品种

Trend Scope Pro – Precision Linear Regression Channels for Smarter Trading
Trend Scope Pro is a powerful trading indicator built on the concept of Linear Regression Channels, designed to give traders a crystal-clear view of market trends, volatility, and potential reversal zones. This professional-grade tool brings advanced statistical analysis right onto your MetaTrader 5 charts, helping you make smarter, more confident trading decisions.
Unlike traditional moving averages or static trendlin

Alpha Trend Indicator for MetaTrader 5 Check all of our products from mql5 market: What are the specifications of this indicator? Platform: MetaTrader 5 (MT5)
Type of Application: Custom Trading Indicator
Level: Intermediate / Professional
Timeframe: All Timeframes (Multi-Timeframe Support)
Trading Styles: Scalping, Day Trading, Swing Trading, Position Trading
Trading Markets: Forex, Stocks, Commodities, Indices, and Crypto
What does this indicator do? The Alpha Trend Indicator for

LAUNCH PRICE (When it reaches the top of downloads, the price will go up) Take advantage of this opportunity. Description Vivo GOLDm# is a solid and versatile Expert Advisor, designed for traders who seek a clear strategy, discipline, and integrated risk management. Its main goal is to help operate in the gold market (XAU/USD), an asset known for its high volatility, by providing a structured approach that reduces improvisation and improves consistency in decision-making.
This EA is especially t

Dragon Bands Z:可视化趋势分析指标 Dragon Bands Z 是一款旨在通过视觉整合多种技术来源来简化图表解读的指标。其目标是清晰地指示市场方向和强度,而无需使用多个指标使图表过于拥挤。 该指标使用 混合颜色填充 将价格行为转换为四种主要的视觉状态: 绿色: 表示主导的上升方向力量。 红色: 确认主导的下降方向力量。 黄色: 提示低波动性或盘整阶段。 灰色: 表明市场犹豫不决,建议等待方向确认。 这种方法可以快速评估当前趋势。与单独分析多个指标不同,Dragon Bands Z 融合了分析,提供统一的视角。 主要特点 视觉清晰度: 将复杂的技术信息转化为简单的颜色代码。 多时间框架分析: 包含一个面板,用于在其他时间框架上确认信号或趋势,有助于使交易与主要趋势保持一致。 多功能性: 适用于短时间框架(剥头皮交易)和长时间框架(波段交易)的分析,因为其核心功能侧重于确认方向。 Dragon Bands Z 旨在成为一种辅助工具,通过消除视觉噪音,只保留趋势的基本信息,从而增强您的当前策略。 DRAGON BANDS Z (技术信息) Dragon Bands Z 旨在通

Why You Need VLine Alarm
Stop Missing Trade Setups.
News events, session opens, key timeframes - they all happen whether you're watching or not. VLine Alarm keeps you on point.
Set It Once. Forget It.
Drag a line. Walk away. Get alerted. No babysitting charts. No missing opportunities because you switched timeframes or stepped away.
The Problem It Solves:
You know that moment when you realize the news already hit 5 minutes ago? Or you miss the London open because you were analyzing the daily cha
An Expert Advisor that operates in times of high contrast, employing the stochastic indicator and the commodity index indicator, using overbought or oversold points or the ADX indication to exit trades. It also features a stop-loss control that operates on a percentage difference in price, with progressive lot scaling as the balance increases, while keeping an eye on the account's margin call. Learn what parameters are with better performance for each symbol in the strategy tester and find a go

GoldStar EA is a fully automated trading program (Expert Advisor) designed exclusively for trading gold (XAU/USD).
It analyzes multiple timeframes to detect high-probability trading opportunities and integrates advanced trade management tools — all while remaining easy to set up and operate . Key Advantages of GoldStar EA Advanced algorithm scanning multiple timeframes for optimal entry signals. Built-in money management and capital protection to minimize risk. Stable and consistent results ba
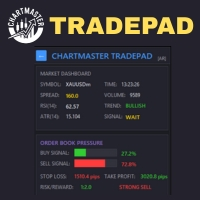
全面掌控交易!ChartMaster TradePad是一款功能强大的全能型交易面板,专为简化下单、风险管理和市场分析而设计。 无论您是剥头皮交易者、日内交易者还是波段交易者,ChartMaster TradePad都能为您提供快速、清晰和精准的操作体验,助力提升交易表现。 核心功能 市场仪表盘 实时市场数据 :交易品种、点差、RSI(14)、ATR(14)、趋势方向、成交量及交易信号一目了然。 趋势与信号提示 :自动识别市场多空趋势,实时显示买入/卖出信号。 订单压力监控 买卖力量百分比 :直观展示市场多空情绪(买/卖压力百分比)。 动态风险回报比 :自动计算止损与止盈水平,并直观显示风险/回报比。 强势交易提示 :当市场明显倾向于买入或卖出时自动发出警示。 持仓状态与风险管理 实时仓位监控 :显示当前持仓、盈亏情况以及账户风险。 手数与风险计算器 :输入风险百分比,系统自动计算合适的下单手数。 一键交易控制 快速下单 :买入、卖出、买入限价、卖出限价、买入止损、卖出止损,一键完成。 高级交易管理 :支持保本、移动止损、移动止盈,轻松锁定利润、降低风险。 紧急

Order Block Pro (MQL5) – 版本 1.0 作者: KOUAME N'DA LEMISSA
平台: MetaTrader 5 描述: Order Block Pro 是一个高级指标,可自动识别图表上的 多头和空头订单块 (Order Blocks) 。通过分析盘整蜡烛及随后强势的冲击蜡烛,该指标帮助交易者识别价格可能加速的关键区域。 适合希望以下目标的交易者: 精准确定进出场点。 发现动态支撑和阻力区域。 提升风险管理和交易策略。 主要功能: 多头订单块检测:
在盘整蜡烛之后的强势上涨蜡烛处显示绿色箭头。 空头订单块检测:
在盘整蜡烛之后的强势下跌蜡烛处显示红色箭头。 完全可自定义: 最大蜡烛实体比例 ( BodyMaxRatio ) 下一根蜡烛最小比例以确认走势 ( NextCandleMinPct ) 箭头偏移量 ( Arrow_Offset_Pts ) Marketplace 准备就绪:
优化且干净的代码,符合 MQL5 Marketplace 标准。 输入参数: 参数 描述 Arrow_Up_Code Wingdings 上箭头代码 (默认: 233

Meta Cipher A:精准的价格行为叠加指标 Meta Cipher A 将流行的 Market Cipher A 概念引入 MetaTrader 5,作为一个高精度的叠加指标。它能够直接在价格图表上显示预警信号,结合 8 条 EMA 均线带 、WaveTrend 分析以及八种不同的信号类型,帮助您在行情完全形成之前识别进场、出场和高风险环境。 虽然 Meta Cipher A 本身已经非常强大,但它被设计为可与 Meta Cipher B 自然搭配,以实现更深入的确认与分析。
功能介绍 该叠加系统绘制动态 EMA 均线,并使用趋势颜色编码及填充区域以增强可视化效果。它包含八种专业信号类型,包括 Blood Diamond(血钻) 反转信号、 Yellow Cross(黄色交叉) 操纵警告信号,以及 Blue Triangle(蓝色三角) 延续信号。 WaveTrend 振荡器在后台运行,将多层分析结果输入 RSI 和 MFI 动量确认中。您可以用它来读取价格结构、预测走势,并判断何时应暂时观望。
为 Heiken Ashi 优化设计 Meta Cipher A 内置 Hei

概述
“TS-MA4F”是一款长期持有EA,采用逆势策略交易AUDCAD,AUDCAD是资源丰富国家的代表货币,对经济指标的影响有限。
该策略基于货币对倾向于形成区间的规律,逻辑简单自然。
没有网格、马丁格尔或对冲,它是一个完全单仓位系统,设置了 TP 和 SL,因此风险有限。 除了占领市场之外,这款 EA 还配备了辅助功能和独特的技术。 具备防止人为失误的各种措施,以及自动传播、交易信息输出等便捷功能。 我们独特的制造工艺减少了回溯测试和真实交易之间的交易差异。 我们独特的重复订单程序提高了执行能力。 通过这些努力,我们的目标是为战略提供全面的支持。
逻辑
入口
主要策略是均值回归的统计方法。
只有当汇率上涨过快、出现逆转的可能,并且长期时间框架内的多个环境识别条件得到满足时,我们才会采取逆向投资立场。
出口
・两种技术条件
・由于波动性导致目标价波动
・固定SL
- 经过一定时间后强制结算(买入 40 小时/卖出 76 小时)
一旦满足上述五个付款条件,就会付款。
除了参考目标平均值的指数外,我们还采用多种结算方法。
不存在尾随,因为利润率不能像趋

Gold Zenith — 黄金(XAUUSD)高级智能交易系统 Gold Zenith — 黄金(XAUUSD)高级智能交易系统 Gold Zenith 是面向 XAUUSD(黄金)的强大且自律的算法交易系统。 它 不 使用高风险手法(如网格、马丁等),并且每一笔交易都由 止损 保护。 逻辑:识别 趋势行情 并交易 回撤 ,每个信号只开 一 单。 无需复杂设置——默认参数已为实盘优化:将 EA 拖到图表即可开始交易。 为什么更可靠 安全结构: 无网格、无加倍、无摊平——仅按纪律性入场并设置 SL。 入场纪律: 一信号 → 一持仓。 聚焦 XAUUSD: 逻辑针对黄金在 M5 周期的波动特性精调。 少见优势(黄金): 固定 TP:SL = 1:1 。
一次 TP 盈利可覆盖一次 SL 亏损,便于控制回撤与规划收益。 限量价格 当前价格仅限 5 份 。之后价格 将上调 。 立即以优惠价格入手 Gold Zenith 。 Live signal 运行环境与用法 交易品种: XAUUSD 周期: M5 账户类型: ECN / RAW / RAZOR(非强制,但点差越低越好) 运行时间: 全天

Overview
Yellow Brick Road for XAUUSD H1 is a purpose-built Expert Advisor that pairs a robust, discretionary-style algorithm with an embedded AI engine. It validates signals, studies trend development, and adapts parameters to your broker’s XAUUSD feed. The goal is a professional workflow that enforces discipline and repeatability—without promises or hype.
Architecture & Execution
The system runs on MT5 hedging accounts with unique magic numbers per strategy, so every position is isolated and

Quantum Flow Scalper - 高频剥头皮交易系统 描述 这是一款用于MetaTrader 5的高频剥头皮智能交易系统,旨在整个交易时段内获取小而频繁的利润。该EA运行双向剥头皮引擎,可同时捕捉买入和卖出方向的价格波动。该系统专为剥头皮操作设计,在整个交易日内开立多个仓位以捕捉小幅价格波动。 核心功能 高频交易 该EA专为剥头皮操作设计,在整个交易日内开立多个仓位以捕捉小幅价格波动。系统追求快速获利,而非长期持仓。由于EA持续监控剥头皮机会,多笔交易可在短时间内执行。剥头皮方法专注于反复积累小额盈利,而非追求单笔大额收益。 双向剥头皮 两个独立的剥头皮引擎分别用于买入和卖出方向。每个引擎可以开立和管理自己的一系列剥头皮仓位。这种双向方法使系统能够在震荡和趋势行情中同时从上涨和下跌的价格波动中获利。两个引擎可在对冲账户上同时运行。 仓位构建 系统使用多种技术构建剥头皮仓位。当满足入场条件时开立初始仓位。随着价格发展,可按预设间隔添加额外仓位。在有利的价格波动期间,可添加更多入场以利用动量。这种分层方法在剥头皮机会期间最大化敞口。最大仓位限制可防止快速累积期间的过度敞口。 快

Regression analysis Candles EA used regress equation degree 5 and equation line from two lower points and two high points draw two straight lines. It make four trends to compare for determine buy/sell orders. we put pending order buy limit/buy stop or sell limit/sell stop when has order. we has limit order least than 99 orders. we close all orders has ten cases it chooses to variable market we has C.V. parameter and we have many functions used in system. we divide our system to four modules. The

Here’s a clear logic explanation and EA introduction in English, formatted in Markdown for easy reading: EA Introduction: Tri_SMA The Tri_SMA Expert Advisor (EA) is a trend-following system that uses three Simple Moving Averages (SMA) for entry signals, stop-loss placement, and trade filtering.
It is designed for single-position control , ensuring only one trade is open per symbol at a time. Trading Logic Entry Conditions Long (Buy): Short SMA is rising ( SMA1 > SMA1_previous ). SMA orde
Expert Advisor that leverages Keltner Channel signals, established by an exponential moving average and an ATR indicator, to enter trades confirmed by an ADX indicator. Trade exits occur when the ADX signal is indicated or, if configured, when the midline is broken at the close of the candle. It features a stop-loss mechanism with a percentage change in price and a mechanism for scaling the lot as the balance increases. Learn what parameters are with better performance for each symbol in the st

黄金 ECN EA 采用先进的人工智能算法设计,可分析市场不确定性。它基于机器学习系统开发,能够适应新闻更新,并在市场持续变化的情况下动态掌控行情。
与预测性人工智能同步,机器学习算法用于识别市场在一段时间内的极高低点、极高高点、极低高点和极低低点,并检查是否存在类似的重复现象;它还能利用价格行为实时研究图表。
立即查看实时信号 查看 MT4 版本 1. 策略概述 策略类型:
此 EA 使用两种策略来适应市场变化:趋势市价单策略和趋势突破单策略。XAUUSD 市场瞬息万变,其随着市场变化而灵活调整的能力使黄金 ECN 在创建入场和离场订单方面具有优势。
结构说明:
当检测到看涨趋势或看跌趋势时,它会寻找确认蜡烛形态,并下达交易订单以捕捉重大的市场波动。当趋势失效时,系统会分析突破点并开立新订单,以补充趋势信号所下达的先前订单;在XAUUSD市场快速波动的情况下,这些操作通常在几毫秒内完成。
交易频率:
为了提高长期可持续性,只有在检测到清晰信号时才会开立交易。低频率交易是最佳选择;这与频繁或随机交易形成鲜明对比。
目标: 该策略并非以投机性短期收益为目标,而是致力于实

Title: EMA Cross RSI TurboTrader – Professional MT5 EA with Safe Stops & AutoLot Short Description:
Experience professional trading with EMA Cross RSI TurboTrader – a smart MT5 EA designed for trend following, scalping, and capital protection . Features Safe Stops, AutoLot, Trailing Stop, and Market-Safe Gap for maximum reliability. Full Description: Welcome to the next level of automated trading! Unlock Your Trading Potential with EMA Cross RSI TurboTrader! Experience the n

O Scartrader é um robô de day trade desenvolvido para o Mini-Índice da B3, combinando os indicadores Williams %R, Z-Score e Filtro VHF com uma camada adicional de análise de correlação entre ativos , garantindo assertividade nas operações. Sua arquitetura inclui gestão de risco , com stop dinâmico, limite diário de perdas e controle de exposição por operação. A correlação pode ser realizada em diversos ativos: dólar, ações, ETF, juros futuros DI. A estratégia foi validada em backtests extensos ,

Ratio X Freshbot Gold EA — 智能趋势与动量系统
Ratio X Freshbot Gold EA 是一款完全自动化的交易系统,专为在 H1 和 H4 时间框架下交易 XAUUSD(黄金) 而精心设计。其架构结合了 趋势预测 与 动量确认 ,将多层次的技术分析整合为一个连贯且有纪律的执行框架。 该系统利用 指数移动平均线 (50 EMA 和 200 EMA) 来确定方向,使用 RSI 进行强度验证,并通过 MACD 进行动量确认。此多因子方法使 EA 能够过滤噪音,仅在高概率信号出现时入场——在精确度与风险控制之间保持平衡。 与许多投机性系统不同,Ratio X Freshbot Gold EA 不使用 马丁格尔、网格或不受控的加仓。每个仓位都是 独立 、 风险可控 的,并由 预定义的结构性规则 触发,确保在不断变化的市场条件下保持一致性和透明度。 主要特点 专为黄金 (XAUUSD) 优化,适用于 H1 和 H4 时间框架。 结构化入场逻辑 :EMA 金叉/死叉, RSI > 50 / < 50 ,以及 MACD 确认。 基于风险的仓位大小 :手数自动按账
Strivex Supply/Demand 指 标 (MetaTrader 5) Strivex Algo 的 Supply/Demand 指 标会自动识别重要的供给和需求区域,标记市场结构突破 (BOS) ,并 实时通知交易者。
一个特 别的特点是:即使切 换图表周期,这些区域也会保持不变。例如,您可以在 M15 图表中显示 H1 区域,而无需重新 绘制或丢失它们。
主要功能 基于 摆动高点和低点的自动区域识别 通 过限制显示的最后区域保持图表清晰 接近 过滤器以避免重叠或过近的区域 Break of Structure (BOS) 明确的 趋势信号 摆动标签 (HH/HL/LH/LL) 可 选显示 通知: 弹窗、推送或电子邮件
️ Input Parameters ( 参数 说明 ) Input Parameter 说明 Timeframe for zone detection 计算供需区域的时间框架 ( 如 H1, H4, D1) 。 这些区域在切换图表周期后仍然可见。 Enable/disable drawing of zones 开启或关 闭区域显示。 S
EURUSD_Gangorra_Risk 说明 EURUSD_Gangorra_Risk – M30 逆趋势交易机器人,带多重共振和百分比风险管理 概述 EURUSD_Gangorra_Risk 是一款专业的 逆趋势(均值回归)EA ,专为 EURUSD M30 设计(可在其他货币对/周期上使用,通过参数调整)。
它识别价格在 支撑/阻力区域 (Donchian/Bollinger)附近的 触碰/接近 ,并通过可配置的 共振条件 (RSI、与EMA的ATR距离、H1反趋势过滤)确认进场。
风险管理完整: 基于“资金”的风险百分比 (Balance/Equity/Free Margin)、 ATR 动态止损/止盈 、 保本/移动止损 、 篮子目标(USD/%) 、 短网格补仓 和 受控马丁策略 。
规则还包括 超时退出 、 反向信号平仓/反手 、 冷却时间 和 日内最大回撤限制 ,确保交易纪律。 主要功能 信号核心(M30 逆趋势) 在 支撑位买入 (Donchian Low / Bollinger Lower),在 阻力位卖出 (Donchian High / Bolling

全新发布优惠!
Gold Algonomics 现以 限时折扣 推出: 起始价格: 200 美元 价格递增: 每售出 8 份,价格上涨 100 美元(以保持独特性与市场优势) 最终价格: 2,000 美元 购买后请直接与我联系 —— 我将亲自提供 参数配置文件 (setfiles) ,以及一份 值得信赖的经纪商清单 ,这些资源帮助我实现了财务独立并提前退休。 特别抽奖: 在发布促销期间的每一位购买者将自动参与抽奖,有机会获得一份 50,000 美元的 FTMO 资金账户 (或同等资金支持)。详情请在购买后联系我! 为什么选择 Gold Algonomics? Gold Algonomics 既不是噱头,也不是普通的工具。它是一款 高精度的智能交易系统 (EA) ,旨在识别 短期市场动能 ,并抓住即时的价格波动。 其交易逻辑源自一套 经过 9 年验证的策略 —— 该策略甚至被 大型金融机构 所采用。所有积累的经验与知识都被谨慎地融入到这一全自动 EA 中,结合了 成熟的方法与稳健的执行 。 核心是 循环流动性分析 (Cyclical Liquidity Fl

ScalpingThink – 剥头皮交易的精准性 ScalpingThink 是一款创新的双向剥头皮系统,专为依赖快速行情与精确入场的交易者设计。目标:通过精确的交易设置,在最短时间内实现可控收益 —— 安全且高效。 立即试用 —— 免费演示版
现在仅需 169 美元 ,赶快抢购,价格即将上涨!
当前价格 169 USD 信号: 链接 指南: 链接 优势一览 无网格,无马丁策略 – 每个头寸单独且受控地开启 固定止损 + 虚拟动态追踪止损 ,最大化安全性 多种追踪止损方案 ,灵活锁定利润 安全缓冲 ,保护保证金,防止账户过载 时间过滤 & 点差过滤 ,仅在清晰的市场阶段中进行干净、可规划的入场 推荐市场与设置 时间周期: M1(1分钟图)– 真实剥头皮的理想选择 交易品种: EURUSD, GBPUSD, USDJPY, NASDAQ 100, DAX, 道琼斯 – 适用于高成交量和快速波动的市场 ️ 功能与特性 交易面板 : 可最小化/最大化,显示: 当前EA状态(激活、暂停) 持仓、挂单、余额与净值 详细交易统计 自动或固定手数选择 点差限制 ,防止在新

Support Resistance Catcher Indicator Features and Explanation
Overview: The Support Resistance Catcher is a custom MT5 indicator designed to identify and visualize supply (resistance) and demand (support) zones based on candlestick price action. It detects zones where price has reversed after rallies or drops, using wick rejections and clustering. The indicator draws horizontal rectangles for active and historical zones, with customizable colors, labels, and alerts.
Key Features:
1. Zone Det

IBOV Dip Buyer EA 描述 IBOV Dip Buyer EA – 巴西B3股票的智能交易机器人 概述
IBOV Dip Buyer EA 是一款专为巴西股市(B3 – IBOVESPA)开发的专业自动交易机器人。
它能够识别每日股票的下跌幅度,并基于两种经过验证的交易策略自动开仓,同时具备完整的资金与风险管理功能。
所有参数均可通过一个简单的 CSV 文件灵活设置,轻松管理多只股票的个性化交易条件。 主要功能 多品种支持 :一个图表即可管理所有 IBOV 股票 两种交易策略 : 策略 1 : 昨日收盘价高于 EMA(N) 策略 2 : EMA5 > EMA10 且 EMA5 > EMA50 (基于昨日收盘) 下跌触发器 :价格相对昨日收盘下跌达到设定百分比时才开仓 缺口过滤 :若开盘跌幅超过触发值,则全天不交易该股票 每日资金管理 : 限制每日最大交易次数(两种策略合并计算) 每日资金上限(以巴西雷亚尔计),支持自动部分建仓 单票自定义设置 :每个股票可单独配置数量与触发条件 时间过滤 : 忽略开盘集合竞价(可设定分钟数) 设置每日最

FLEQBA Pro – 指标说明 此指标为 MetaTrader 5 用户 设计,让您可以直观地追踪自己或机器人交易的表现, 既可回溯查看,又可实时监控 。
图形化显示使策略或机器人运行情况比纯数字更 清晰 、更 易于理解 。 该指标不仅展示数据:它还 分析、评分并生成统计数据 ,可通过图表上的按钮即时查询。
内置的 过滤器 允许您按 时间 、 品种(符号) 、 魔术编号 、 备注 或它们的任意组合对数据进行排序。
这样您几次点击就能分别查看多个机器人或您自己的手动交易结果。 按钮及其功能 左下角 [PS] Period Separator – 切换显示或隐藏图表中的周期分隔线。对设置 Custom time 有帮助。 [SS] ScreenShot – 随时可拍摄屏幕截图。 [TI] Trade Information – 在蜡烛图上以小点和箭头标记交易事件。可开启 / 关闭。 屏幕截图保存在: MQL5\files\FLEQBA\ScreenShots\ 显示模式 [PA] Plot All – 同时显示 Balance 和 Equity。 [PB] Plot Balance –

80% off for 2026 new year gift
GoldenAegis:专为黄金交易与自营公司挑战设计的EA GoldenAegis是Nirvana系列的顶级智能交易系统(EA),是一款专为黄金(XAUUSD)交易和旨在通过自营交易公司(Prop Firm)挑战的交易者设计的系统化交易工具。 核心策略与理念 该EA凝聚了超过十年的实盘市场经验。其核心理念是自动化一个经过验证且纪律严明的交易策略,从而将情绪化决策从交易过程中剔除。GoldenAegis不仅仅是一个机器人,它是一个战略框架,旨在基于M30时间周期执行系统化的交易。 主要特点 为自营公司优化: EA的逻辑经过专门校准,以满足自营公司评估的典型要求,侧重于稳定增长和严格的资金回撤控制。它也完全适用于个人真实账户。 战略性时间周期(M30): 专门在黄金的30分钟图表上运行,该时间周期的选择旨在平衡清晰的信号生成与过滤短期市场噪音。 通用兼容性: 适用于任何MT5经纪商,支持ECN和标准账户类型。没有任何隐藏的限制。 即装即用: 软件包中包含由作者提供的预优化设置文件(.set)。附有详细的说

Algo Octa - Indicateur d'Analyse Technique Avancé Indicateur professionnel combinant ZigZag, SAR parabolique, canaux de tendance et niveaux de Fibonacci pour une analyse technique complète. if you don't understand how to use Technical Support via product feedback or MQL5 messaging system.
Fonctionnalités Principales Analyse Multi-Composants
ZigZag coloré avec détection automatique des extremums Intégration du SAR parabolique pour la confirmation de tendance Création automatique de canau

MetaTraderPro Premium Indicator (MT5) MetaTraderPro Premium Indicator 用于清晰、客观地识别市场中的潜在进出场点。信号直接显示在图表上,操作简单高效。 优势:指标在蜡烛收盘后 不会重绘 和 不会重新计算 ,确保信号稳定可靠。 主要功能: 买卖信号箭头直接显示在图表上 无重绘、无重算 – 稳定可信 可调节 风险等级 (1–10) – 控制信号的选择性或频率 可配置的 计算周期 – 根据交易风格调整灵敏度 易于配置 – 参数简单直观 兼容所有品种与时间周期 ️ 重要提示: 本指标不保证任何财务结果。它应作为 辅助工具 与交易策略结合使用。 MetaTraderPro Premium Indicator (MT5)

Trend-following Expert Advisor that acts based on Ichimoku indicators, programmed to respond for identify strong trend moments and ensure greater precision in entry decisions for better perfomance in ops. It features optional stop-loss control based on the percentage of price change, or "stop and reverse" between these moments, and lot scaling based on balance growth. Learn what parameters are with better performance for each symbol in the strategy tester and find a good linear regression making

Total opened lots calculation & Average price show on chart. You can manage lots size it's helpful who opened many lots in different price leval and it's shows Average price of lots.it's indicator not EA. Available only Mt5. Attach on chart which open positions pairwhich you want to calculate and want to know all lots average price. Excellent indicator which may help to controls your lots size.

MultiChart Pro – MetaTrader 5 图表管理专业工具 MultiChart Pro 是一款为 MetaTrader 5 设计的专业级图表管理工具(智能交易顾问,EA),旨在帮助交易者自动化打开、设置和组织多个图表界面。通过此 EA,用户无需手动配置每个时间周期或模板,即可在几秒钟内建立完整的交易布局,从而显著提高分析效率与执行速度。
该系统最多支持四个图表的自动化配置,包括三个标准在线图表(例如 D1、M1、M15)以及一个离线图表(例如 10 秒图)。EA 还会自动设置当前活动图表(例如 M5),使所有时间周期的分析保持一致性。 主要功能: 图表自动打开: 可在启动时快速加载多个不同周期的图表,无需人工干预。 模板自动应用: 每个图表都会加载用户预设的模板,系统会自动检测模板是否存在,以防止错误。 时间周期选择: 用户可通过输入参数自由选择需要打开的时间周期。 离线图表支持: 可为短周期策略(如剥头皮或高频交易)创建自定义的 10 秒图。 MultiChart Pro 特别适合希望同时观察多时间框架信号的交易者,例如日线趋势配合分钟级入场点的策略。借助此 EA

SR POC VOLUME 指标适用于 MetaTrader 5,用于识别、聚合和可视化从蜡烛图数据中得出的控制点(POC),可在用户可配置的回溯周期内进行分析。该指标旨在通过累积的成交量和 Delta 分布,为交易者提供结构化的方法,以识别潜在的支撑和阻力区域,从而更好地理解市场中关键兴趣点的位置。 核心功能 POC 计算 指标会在指定的回溯范围内为每根蜡烛计算 POC。 POC 定义为蜡烛最高价与最低价的中点。 每个 POC 同时关联一个 Delta 值,该值基于成交量和方向性偏差(收盘价高于开盘价为正,否则为负)。 Delta 值经过缩放,以突出买卖方之间的方向性不平衡。 聚类形成 POC 会根据用户设定的价格百分比容差进行聚类。 容差确定 POC 之间必须多接近才能被视为同一聚类的一部分。 每个聚类会聚合以下数据: 聚类覆盖的最低价和最高价。 累积 Delta 总和,反映买方或卖方的主导情况。 聚类内 POC 的数量。 聚类的最新时间参考。 聚类的最少 POC 要求 聚类只有在包含至少指定数量的 POC 时才被确认。 该功能防止孤立或无意义的数据点被高亮,仅显示有意义的价格集中

ABCD Lemissa + 月线水平 + PinBar + Marubozu 指标 描述 该指标 整合了多种强大工具 ,为市场提供完整的概览: ABCD Lemissa – 自动识别 ABCD 结构 ,标记 A、B、C、D 点、支撑/阻力区域,并显示买入/卖出箭头。 Monthly Levels(月线水平) – 显示月线蜡烛的 High、Low、Open、Close 水平,用于识别关键区域。 PinBar & Marubozu – 自动识别 PinBar 蜡烛 (反转信号)和 Marubozu 蜡烛 (强趋势蜡烛),支持自定义箭头和符号显示。 该指标完全 可视化 ,结合了线条、箭头和矩形,便于分析市场和做出交易决策。 主要功能 ABCD Lemissa 自动识别 A、B、C、D 点 显示 BUY 和 SELL 信号箭头 使用 X1 / X2 矩形高亮支撑和阻力区域 Monthly Levels(月线水平) 显示月线蜡烛的 High、Low、Open 和 Close 每根新蜡烛动态更新 PinBar & Marubozu 自动识别反转蜡烛和强趋势蜡烛 可自定义箭头显示交易信

Trend-following Expert Advisor that operates with the Stoch and Parabolic SAR indicators during periods of volatility monitored by Bollinger Bands, based on the percentage between the upper and lower bands. It always favors a strong trend, as indicated by its RSI indicator and the expected increase between candles. It also includes optional stop-loss control based on the percentage of price changes, or "stop and reverse," between these periods of volatility, and lot scaling based on the balance

This is the Goldborg Gold EA. It trades on the XAUUSD chart in the 1H timeframe. This EA is optimized for the Broker ICTrading only! NO MARTINGALE OR GRID The signal is a combination of both Stonks Go Up EA and Goldborg (both EAs that I sell). The price will be changed to $500 each if the signal hits 210%!
https://www.mql5.com/en/signals/2322075?source=Site
So get the power duo until the price increases! : https://www.mql5.com/en/market/product/135150?source=Site+Market+MT5+Expert+Search+Rat

Fusion Monthly Levels + PinBar + Marubozu 说明
这个独特的指标将三种强大的技术分析工具融合为一体: 月度关键水平 (高点, 低点, 开盘价, 收盘价) —— 用于识别关键支撑与阻力区域。 PinBar 识别 —— 一种可靠的反转形态,提示价格的强力拒绝。 Marubozu 识别 —— 强烈的趋势型K线,显示出明显的方向性动能。 通过这种融合,您将获得一个 直观、全面且高效 的市场预测工具。 优势 融合机构级别水平 + 价格行为 (Price Action)。 清晰的视觉信号:蓝/红箭头表示 PinBar,蓝/红方块表示 Marubozu。 适用于所有交易品种(外汇、指数、加密货币、大宗商品、股票)。 可自定义参数(参考周期、影线大小、箭头样式)。 代码优化,无延迟,即使在多个图表中使用。 完全兼容 MetaTrader 5。 信号说明 看涨 PinBar → 蓝色箭头在K线下方。 看跌 PinBar → 红色箭头在K线上方。 看涨 Marubozu → 蓝色方块在K线下方。 看跌 Marubozu → 红色方块在K线上方。

Golden pot pro - Expert Advisor Professional Trading System for Gold (Limited time offer- just $99) Golden pot pro is a sophisticated Expert Advisor designed for serious traders who want automated, intelligent trading with advanced risk management. This EA combines multiple proven technical indicators with smart position management to deliver consistent performance in various market conditions.This Ea works well with M10 and H1 time frames This EA uses a carefully optimized trading algorithm
FROZEN EMA SCALPER
Frozen EMA Scalper is an advanced moving average indicator designed specifically for scalping in financial markets.
Key Features:
Optimized 200-period for greater stability and accuracy Clear visual signals with directional arrows (green for buy, blue for sell) Dynamic color change of the EMA line based on the market trend Professional interface with customizable background for better visibility Designed for multiple timeframes Competitive Advantages:
Reduces market noise

Support: Profit Smasher 24/7 AI Assistant Disclaimer Liquidity Mapper Pro is an analytical tool for educational and informational purposes only.
It does not provide financial advice or guaranteed signals.
All trading carries risk, including potential loss of capital.
Past performance does not guarantee future results.
You are solely responsible for your trading decisions.

动态RSI卫士 – 精准交易与全面风险管理 动态RSI卫士是一款专为重视稳定性能、严格风险控制和灵活性的交易者设计的专业算法交易系统。基于先进的点差计算和智能RSI驱动的过滤器,它确保每笔交易遵循严格的规则,以最小化风险,同时最大化机会。 主要功能 : 智能入场系统
• 基于RSI的多重过滤器确认
• 检测高概率信号并在图表上以箭头可视化 全面风险管理
• 基于风险百分比的动态手数计算
• 最大持仓量和交易检查(防止过度交易)
• 无效止损水平保护 高级退出策略
• 基于ATR或固定点差的追踪止损
• 可调止损和止盈(基于点差)
• 自动调整止损以适应经纪商限制 可视化HUD仪表板
• 实时状态(买入、卖出、阻止)
• 市场条件显示
• 信号跟踪和分隔线 支持回测与优化
• 专为剥头皮和日内交易设计
• 适用于多个交易对和时间框架
• 易于优化以适应不同策略 策略与使用 :
动态RSI卫士在低延迟环境(ECN/STP经纪商)中表现最佳。
推荐使用: 交易对 :EURUSD、GBPUSD、XAUUSD(黄金)、US30 时间框架 :M1 – M15 低点差经
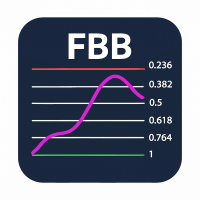
Fibonacci Bollinger Bands Indicator for MT5 The Fibonacci Bollinger Bands Indicator for MetaTrader 5 (MT5) is a powerful trading tool that combines the strength of Bollinger Bands with Fibonacci retracement levels . Since price often reacts strongly to Fibonacci levels, this indicator helps traders identify high-probability reversal zones and breakout opportunities. Key Features & Inputs Bollinger Bands Length – customizable parameter for band calculation.
Price Mode Selection – choose from C

多订单智能 -系统基于 Delta分析逐步添加仓位。并非随机添加,而是当动能沿正确方向持续时才会进行。每交易品种最大4 个订单,并配有智能手数管理。 专业分析面板 -实时监控所有活跃货币对、盈亏分析、风险计量和绩效跟踪。您可以清晰掌握每个货币对的实时动态。 高级平仓逻辑 - 6 种独立的平仓条件:尾随止损、 pokožka hlavy 目标、时间限制、Delta反转、相关性破裂和紧急止损。系统懂得如何自我保护。 手动 SCALP 功能 -一键即时交易并实时对冲。您从面板中选择一个货币对,系统分析节奇伽倶值伻伶从面板中选择一个货币对,系统分析傼奇伶伶 专业资金管理 -保证金控制、手数标准化、风险限制。系统不会允许危及您账户的交易扂 我们的目标用户是谁? 寻求稳定对冲系统的经验丰富的交易者 需要风险分散的投资组合经理 资金量超过 5000 美元的波段交易者 希望通过相关性交易获得被动收入的人士 为什么它能盈利?
对冲交易利用交易品种之间的数学关系。当欧元/美元上涨时,英镑/美元通常也会上涨(正相关)。当相关性暂时失效时,交易机会就出现了。我们的系统能识别并利用这些机

新店优惠:仅限前10名。特价:$30 (原价:$40)。剩余名额:10 为了提高知名度,前10位购买者可享受此折扣。
“以实时动态再现历史图表” Chart Auto Flow 是一款支持以 可变速度 、按 蜡烛图单位 进行 回放和倒放 历史图表的验证辅助工具。 它不仅仅是查看静态图表,而是能以 更接近实时动态 的方式进行再现,从而实现 更贴近实战的训练 。
此外,通过 高速回放 ,您可以从海量的历史图表中 短时间内找寻到目标图表形态 。 适用于所有金融产品,包括外汇、股票、黄金和加密货币。 【推荐人群】
想要提高裁量交易练习和验证效率的用户
可以通过高速回放快速查找双底或头肩顶等特定形态,并通过慢速回放详细分析其形成过程。
想要研究特定形态“出现瞬间”的用户
通过反复倒放和回放(例如指标信号出现的瞬间或价格在趋势线附近的表现),您可以进一步提高入场精度。
想要在周末集中进行验证的用户
与模拟账户交易不同,即使在市场休市期间,您也可以通过移动图表进行模拟练习。 操作界面 按钮 功能 说明 [Pause / Restart] 暂停 / 继续 控制图表重放 [Reset] 重置 重

Genisys FX - Advanced Trading System with Multi-Layer Adaptive Technology Developed by Rayden Labs Srl - Innovation and Precision in Algorithmic Trading KEY FEATURES Feature Description Adaptive Dynamic Grid Technology Automatically modifies multiplier, distance, and take profit based on market conditions and number of open positions. Hybrid Scalping + Progressive Position Recovery System Maximizes profits in strong trends and manages drawdown with progressive layers and adjustable parameters
Slayer Scalper V75. Slayer Scalper V75 is an advanced technical indicator designed specifically for high-precision scalping. It uses a dynamic adaptive channel algorithm that identifies optimal entry and exit points on short timeframes.
Key Features: Clear visual signals: Green arrows for buy and red arrows for sell. Dynamic Channels: Upper and lower levels that automatically adjust to market volatility. Configurable Parameters: Fully customizable Period (7) and Percentage (25%). Anti-Noise Al

2️⃣ Version Chinois ETE Detector – 头肩形指标 (Head & Shoulders Indicator) 将图表转化为清晰可操作的交易机会! 指标介绍 ETE Detector 自动识别 头肩顶 (H&S) 和 倒置头肩 (IH&S) 图形——经典趋势反转形态。
无需手动寻找图形,您的分析将变得 快速、精准、可视化 。 功能亮点 自动检测 趋势反转图形 彩色箭头 :绿色 表示买入(倒置头肩),红色 表示卖出(头肩顶) 自动绘制 颈线 ,显示突破区域 “”标签 标记肩部和头部,直观显示图形 图表上直接显示 文字说明 : "H&S – 卖出" 或 "倒置H&S – 买入" 交易者优势 节省时间 :无需手动寻找图形 决策更可靠 :提前发现趋势反转 清晰可视化 :完整图形一目了然 适用于 所有市场和时间周期 易于自定义 ,适应个人交易风格 ️ 可调参数 参数 描述 默认值 LookBack 分析的蜡烛数量 300 MinDistance 肩与头之间的最小距离 5 Tolerance 肩部对称公差 (%) 2% BuyColor

Trend-following Expert Advisor that operates with exponential moving averages during periods of increasing price strength, monitored by an RSI indicator based on an increase, as well as trading volume, always in favor of the trend. It offers optional stop-loss control based on the percentage of price changes, or "stop and reverse," between these periods of strength, and lot scaling based on the balance's increase. Learn what parameters are with better performance for each symbol in the strategy

Commercial Description – Marubozu Pro (MT5) Description Marubozu Pro is a professional indicator for MetaTrader 5 that automatically detects Marubozu candles (bullish and bearish) directly on your chart.
It helps traders identify strong market momentum where buyers or sellers take full control, by displaying clear visual arrows for buy and sell signals. This tool is designed to be simple, effective, and fast , perfect for manual trading or as a filter in automated strategies. Key Features

尊敬的交易者,您是否厌倦了在复杂的市场震荡中迷失方向?是否曾因错过关键的趋势启动点而懊悔不已?现在,向您隆重介绍我们的智能交易解决方案—— 『Breakthrough King MT5』EA 。它专为捕捉市场动能而生,将经典的“区间突破”策略与严谨的风险管理融为一体,旨在自动化地为您抓住那些最具潜力的趋势开端。 『Breakthrough King MT5』的核心逻辑清晰而强大: 智能识别交易区间 :EA会自动分析近期的价格走势,精准定位市场的“平静期”——即价格在特定范围内波动的整理区间。 静待关键突破信号 :当价格携带着足够的动能(由ATR指标过滤确认)强势突破区间的上轨或下轨时,系统视其为新趋势启动的明确信号。 精准入场与风控 :在突破确认的瞬间,EA会立即执行交易。其精妙之处在于, 止损自动设于区间的另一侧 ,逻辑清晰;而 止盈目标则根据您设定的“风险回报比”(如1:1.5及以上)自动计算 ,确保每一笔交易都潜在盈利大于风险,从制度上追求长期稳定。
告别情绪化交易 :严格执行预设规则,彻底消除因恐惧、贪婪或犹豫导致的人工判断失误。 内置“波动率过滤器” :独家集成ATR波动率

!! Welcome everyone to download and test !! How to achieve steady wins?
Backtests since 2005 show no account blow-ups . Note: use $10,000 margin, 0.01 lot , EURUSD , 1-minute chart , with the current built-in parameters —no need to tweak anything. Other instruments haven’t been tested. Be sure to follow these settings exactly. The biggest risk of a Martingale strategy is blowing up the account. With this system, backtests across all historical phases show no blow-ups . The key is that it remain

FlowMaster EA – Precision Trend Trading with EMA Logic FlowMaster EA is a fully automated trading system designed for traders who want structured setups, controlled risk, and consistency . Built on proven multi-EMA trend logic with intelligent candle confirmation, FlowMaster adapts to dynamic market conditions while enforcing disciplined risk-reward rules. This Expert Advisor automatically scans the charts, filters weak signals, and executes trades only when strong confluence appears – ensurin

FXGrowth2 – Automated Trading Strategy FXGrowth2 is an automated trading strategy developed with a primary objective: maximizing the return-to-drawdown ratio while maintaining strict risk control , with maximum account drawdown kept below 15% . To ensure robustness and consistency, the system has been backtested over 5 years of historical data across 28 currency pairs , derived from the 7 major currencies: USD, EUR, GBP, AUD, CAD, NZD, and JPY . Only when a currency pair meets our predefined per

Trend-following Expert Advisor that operates with the Parabolic SAR indicator during periods of volatility monitored by Bollinger Bands based on a percentage between the upper and lower bands, always in favor of the trend. It offers optional stop-loss control based on a percentage of price change or "stop and reverse" between these periods of volatility, and lot scaling based on the balance increase. Learn what parameters are with better performance for each symbol in the strategy tester and fi

Oracle 震荡指标 (Oracle Oscillator) 是 技术分析 领域的一场真正的革命。它不再要求交易者同时监控多个震荡指标——比如 RSI、Stochastic(随机指标)、Williams %R 和 DeMarker ——而是将每个指标的优点统一到一条 混合线 ( DodgerBlue 色)中,该线条经过完美校准,既能 对市场走势快速反应 ,同时又 保持保守和稳定 ,避免了让许多交易者感到困惑的杂波和虚假信号。 为什么它优于单独的每个震荡指标? RSI :使用广泛,但在横盘市场中往往表现不足。 Stochastic(随机指标) :过于敏感,产生过多信号。 反向 Williams %R :提供有趣的读数,但单独使用时变得不稳定。 DeMarker :有助于检测耗尽,但往往滞后。 在同一图表上同时使用所有这些指标会产生大量的 噪音 ,使它们无法统一。 Oracle 震荡指标 通过 加权数学计算 ,将它们均衡地融合在一起,解决了这个问题。结果是得到 一条单一、可靠的线条 ,它抓住了每个震荡指标的精髓,消除了冗余,放大了真正有用的部分。 信号线( 黄色 )– 高级精度 它不是普

This Expert Advisor (EA) is an automated trading system designed for MetaTrader 5 (MT5). It eliminates emotional trading by executing trades based on predefined strategies and algorithms. The bot continuously monitors the market, identifies entry and exit opportunities, and manages risk with built-in money management rules. Key Features: Fully automated trading – no manual intervention required. Works 24/5 on MT5 platforms. Supports multiple currency pairs and timeframes. Risk managemen
MetaTrader市场是独有的自动交易和技术指标商店。
阅读MQL5.community用户备忘更多地了解我们提供给交易者的独特的服务:复制交易信号,自由职业者开发的自定义应用程序,通过支付系统完成的自动付款和MQL5云网络。
您错过了交易机会:
- 免费交易应用程序
- 8,000+信号可供复制
- 探索金融市场的经济新闻
注册
登录