Volatility Shock Decay
- 指标
- 版本: 1.0
- 激活: 5

# Volatility Shock Decay - Half-life of post-shock recovery
*Category: Volatility | Difficulty: advanced | Window: separate window below the chart | Markets: Universal (Forex, indices, commodities, crypto, stocks) | Suggested timeframes: H1, H4, D1*
## Short description
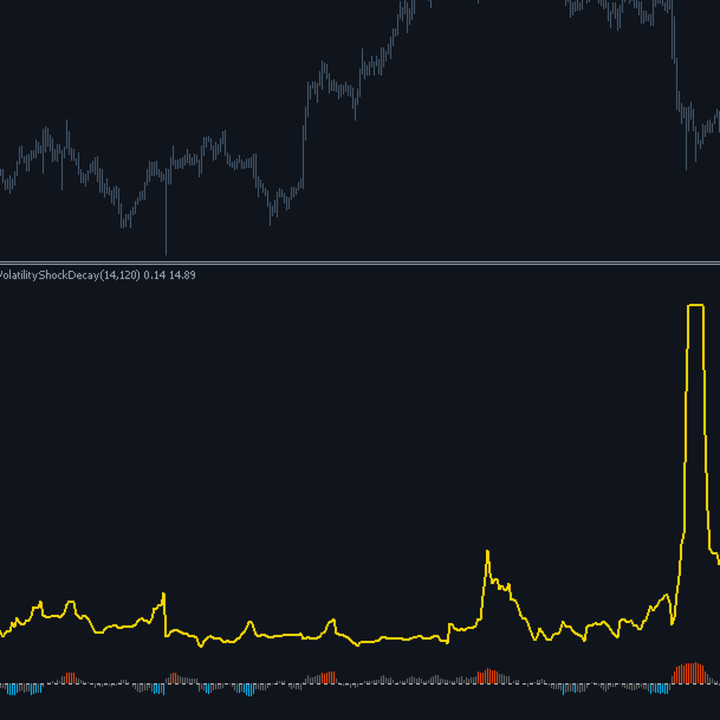
> Estimates the persistence coefficient of volatility and derives its half-life, how many bars a deviation from normal needs to halve. It also shows the size of the current shock.
### Overview
When volatility explodes, the practical question is not how high it is but how long it will take to come back. On some instruments a shock is reabsorbed within five bars, on others the tail lasts dozens of sessions, and that difference completely changes the position size that makes sense to hold and how long to wait before trading normally again. The indicator estimates the persistence coefficient of volatility with a regression of the logarithmic ATR series on its own one bar lagged value, and from that coefficient derives the half-life, the number of bars a deviation from normal needs to halve. The logarithmic transformation is not a technical detail: volatility is a positive and multiplicative quantity, and working in log scale is what makes the regression statistically sensible.
### How the calculation works
1. The ATR is computed bar by bar and log transformed, making its dynamics approximately linear.
2. Over the InpWindow window the mean of the series and of the same series lagged by one bar are estimated.
3. The covariance between series and lagged series, and the variance of the lagged one, are computed.
4. The persistence coefficient is their ratio: how much of yesterday deviation survives today.
5. Half-life is the logarithm of one half divided by the logarithm of the coefficient, a formula valid when the coefficient lies between zero and one.
6. If the coefficient is zero or exceeds one the model does not apply: in the first case the shock fades at once, in the second the cap is reported to signal maximum persistence.
### How to use it
- After a shock, read the half-life to estimate how many bars to wait before conditions become tradable again.
- A short half-life means you can resume trading almost immediately; a long one requires reduced exposure for an extended period.
- The shock histogram indicates how far current volatility is above or below its own norm, in standard deviations.
- The two readings go together: a large shock with a short half-life is far less concerning than a moderate one with a long half-life.
- Comparing half-life across instruments helps build a portfolio where shocks do not overlap for long.
### Who it is for and on which timeframes
This is a tool for quantitative traders and risk managers, not for those seeking entry signals. Its correct use is in planning the return to normal trading after an extreme event, a decision usually made on feeling. It works from H1 to D1: on lower timeframes ATR dynamics are dominated by hourly seasonality and the coefficient estimate is biased. It requires deep history and a minimal understanding of what a regression is, otherwise the half-life risks being read as a forecast rather than a statistical estimate.
### Practical example of reading a signal
On XAUUSD H4 a geopolitical event pushes the shock histogram to +3.1: volatility sits three standard deviations above its own norm. The estimated half-life is 9 bars, about a day and a half of trading. The combined reading says the shock is large but will be reabsorbed quickly: the sensible choice is to halve positions for a day and resume the normal pace the next. In the opposite case, on an equity index in D1, a similar event had produced a shock of only +1.8 but with a half-life of 34 bars: the recovery would take over a month and the exposure reduction had to be maintained for weeks, not days.
## Input parameters
| Parameter | Default | Description |
|---|---|---|
| `InpAtrPeriod` | 14 | Period of the ATR whose dynamics are studied. Short periods make the series more responsive but also noisier to model. |
| `InpWindow` | 120 | Window over which the persistence coefficient is estimated. Below 60 the estimate is too unstable to be usable. |
| `InpMaxHalfLife` | 60.0 | Cap on the displayed half-life. It keeps the scale readable when the coefficient approaches one and the half-life tends to diverge. |
| `InpShockLevel` | 1.50 | Shock beyond which the histogram is coloured, measured in standard deviations of the logarithmic series. |
## Advantages / strengths
- It answers a concrete operational question, how long to wait after a shock, that no other indicator addresses.
- The logarithmic transformation makes the regression statistically correct rather than a crude approximation.
- The two quantities shown, shock size and half-life, are complementary and together describe the event completely.
- It explicitly handles the cases where the model does not apply, instead of producing meaningless values.
## Limitations and warnings
- The half-life is an estimate, not a forecast: it describes past average behaviour and does not guarantee future behaviour.
- When the coefficient approaches one the half-life diverges and the imposed cap conceals part of the information.
- The estimate is itself subject to error: on short windows the coefficient can vary noticeably from bar to bar.
- On intraday timeframes the hourly seasonality of ATR systematically biases the estimate towards greater apparent persistence.
**No repaint:** values printed on a closed bar are never modified afterwards.
**Disclaimer.** This product is a technical analysis tool, not an automated trading system, and it offers no profit guarantee whatsoever. Financial markets carry the risk of total loss of the invested capital. Past performance is not indicative of future results. Every signal must be confirmed with your own analysis, a money management plan and prior testing on a demo account. The author is not responsible for trading decisions taken on the basis of this indicator.
## Suggested tags / keywords for MQL5
`volatility`, `half life`, `mean reversion`, `shock`, `persistence`, `risk management`, `no repaint`, `regression`