 MetaTrader 5
 专家
专家
 指标
指标
 程序库
程序库
 实用工具
实用工具
 窗口小部件
窗口小部件
 规则
规则
适用于MetaTrader 5的新技术指标 - 178
 技术指标的信号外汇和股票市场的开仓交易和平仓交易起着至关重要的作用。指标的本质就是一种交易品种的数学转换,旨在预测未来的价格变化。
测试技术指标可以更有利于预测市场行为并从中获利。
技术指标的信号外汇和股票市场的开仓交易和平仓交易起着至关重要的作用。指标的本质就是一种交易品种的数学转换,旨在预测未来的价格变化。
测试技术指标可以更有利于预测市场行为并从中获利。 
MACros is based on Exponential Moving Average Crossover:
It can be used for: All Pairs: Forex, Cryptocurrencies, Metals, Stocks, Indices. All Timeframe All Brokers All type of Trading Style like Scalping, Swing, Intraday, Short-Term, Long-Term etc. Multiple Chart
*** MT4 Version-->> https://www.mql5.com/en/market/product/87538
Notification Setting: All type of notifications and Pop-Up available with this Indicator. (Can manually ON/OFF the notification as per requirements.)
Special Note: It

This Indicator analyses the Trend and shows signals. When you open the Chart , Indicator shows you Buy or Sell Signal as Alert. Usage: Activate Algo Trading , Activate the Indicator and drag new currencies into chart. Indicator shows you Buy or Sell Signal as Alert.
Results
- Buy Signal
- Sell Signal
- No Signal For any question please don't hesitate to contact.
FREE
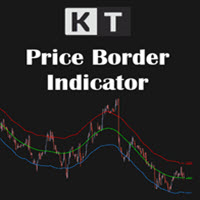
用三条自适应带判断价格位置 KT Price Border 在图表上绘制三条平滑带,用于显示价格在动态市场包络中的位置。默认颜色便于区分各个参考线,可选价格标签会显示每条带的当前数值。 上轨: 标记当前价格包络的上边界。 中轨: 提供趋势和方向的中心参考。 下轨: 标记当前价格包络的下边界。 结合趋势方向与摆动背景 当价格保持在上升的中轨上方时,图表显示看涨方向背景。当价格保持在下降的中轨下方时,背景偏向看跌。价格向外轨移动时,可用于观察价格位置的延伸、回调以及整体方向中的潜在摆动区域。 可将外轨作为动态图表参考,并结合当前价格行为和您常用的确认方法分析每次触及或穿越。出现新的穿越轨道事件时,指标可以发出提醒。 根据市场调整包络 Half Length 控制平滑窗口。Applied Price 用于选择价格来源,ATR Period 和 ATR Multiplier 控制包络对当前波动率的响应。这些参数可根据交易品种、时间周期和图表风格调整轨道的形状与宽度。 您可以使用当前图表或指定时间周期计算轨道,自定义三条轨道的颜色,显示或隐藏实时价格标签,并设置以分钟为单位的最小提醒频率。 选择
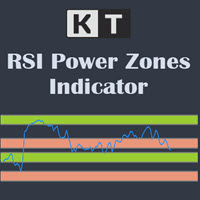
KT RSI Power Zones 将 RSI 的运动划分为四个不同的能量区域,以便通过 RSI 指标识别潜在的支撑和阻力区域。
多头支撑区 多头支撑区范围为 40 到 50,价格有望从该区域向上反转。
多头阻力区 多头阻力区范围为 80 到 90,价格有望从该区域向下反转。
空头支撑区 空头支撑区范围为 20 到 30,价格有望从该区域向上反转。
空头阻力区 空头阻力区范围为 55 到 65,价格有望从该区域向下反转。
如何使用 RSI 能量区域
相对强弱指标(RSI)是一种多功能震荡指标,可以识别超买超卖水平、正负背离、失败波动等现象。 通常来说,RSI 超买意味着价格即将反转下跌,但有时也可能表示趋势依然强劲,反之亦然。 RSI 能量区域应与支撑阻力等其他指标结合使用,以生成更稳健且经过验证的交易信号。
了解相对强弱指标(RSI)
相对强弱指标(RSI)是技术分析中的一种动量震荡指标。它通过衡量近期价格变动的速度和幅度,来评估某项资产是否被高估或低估。 除了识别超买或超卖,RSI 还可以识别即将反转或回调的市场趋势。 它可作为买入和卖出的判断工具。历史数据显示,
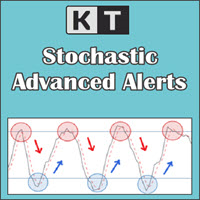
关注对您重要的 Stochastic 事件 KT Stochastic Alerts 将常用的 Stochastic 震荡指标变成实用的图表监控工具。它在独立窗口中显示主线和信号线,并标记您选择的事件,帮助您掌握动量变化,无需持续逐根查看蜡烛图。 Stochastic 看涨和看跌交叉。 进入和离开超买区域。 进入和离开超卖区域。 六种事件均可独立开启或关闭。 按照您的方法调整信号 您可以调整 K 周期、D 周期、减速值、价格字段、移动平均方法以及超买和超卖水平。 选择通知方式 声音、弹窗、电子邮件和手机推送通知可任意组合使用。声音文件可以选择,提醒消息包含交易品种和时间周期,便于快速找到需要关注的图表。 KT Stochastic Alerts 可灵活配合动量、反转和确认型交易方法。清晰的图形标记和可选提醒,让您专注于符合自己交易流程的 Stochastic 条件。
当前8种主要货币的实力 我的#1多功能工具: 包含66+个功能,包括此指标 | 如有任何问题,请联系我 | MT4版本 该指标显示在单独的窗口中,可以移动到图表上的任意位置。 在输入设置中 您可以调整: 界面主题 : 暗色 / 白色; 前缀和后缀, 如果您的经纪商的货币对有这些:
(例如,如果符号为"EURUSD .pro ",请将" .pro "设置为后缀); 面板大小 字体大小 我的#1多功能工具: 包含66+个功能,包括此指标 | 如有任何问题,请联系我 | MT4版本 我的#1多功能工具: 包含66+个功能,包括此指标 | 如有任何问题,请联系我 | MT4版本 我的#1多功能工具: 包含66+个功能,包括此指标 | 如有任何问题,请联系我 | MT4版本
//---
供需区域:价格过去多次接近的可观察区域。 多功能工具: 66+ 功能 ,包括此指标 | 联系我 如有任何问题 | MT4版本 该指标显示价格可能再次反转的区域。 通常,价格从某一水平被拒绝的次数越多,该水平就越重要。 在输入设置中 您可以调整: 启用或禁用 弱势区域; 显示或隐藏 区域描述; 字体大小; 设置 基本颜色: 分别针对支撑和阻力:
选定的颜色对弱势区域将较不强烈,助于您视觉上分析图表; 计算区域的时间框架; 供需区域 是价格图表上的关键区域,之前在此发生了大量买入(需求)或卖出(供应)。这些区域帮助交易者预测价格走势的 潜在反转或延续 。供需交易最好与 其他工具 结合使用,如趋势线、移动平均线或订单流分析。 如何识别供需区域: 需求区域(买方压力) 形成 :下跌后的强劲看涨走势。 标记方法 : 价格急剧上涨(基础)。 上涨前的基础是需求区域。 从最低蜡烛下影线到盘整区域画一个矩形。 供应区域(卖方压力) 形成 :上升趋势后的强劲看跌走势。 标记方法 : 上涨后的急剧下跌。 下跌前的基础是供应区域。 从最高蜡烛上影线到盘整区域画一个矩形。
过去 4 周每日的绝对波动率 我的 #1 多功能工具: 包含 66+ 项功能,包括此指标 | 如有任何问题,请联系我 | MT4 版本 该指标显示在单独的窗口中,可移动到图表上的任意位置。 在输入设置中 您可以调整: 界面主题 : 深色 / 白色; 计算方法: 价格,点数,百分比变化;
面板大小 字体大小 我的 #1 多功能工具: 包含 66+ 项功能,包括此指标 | 如有任何问题,请联系我 | MT4 版本 我的 #1 多功能工具: 包含 66+ 项功能,包括此指标 | 如有任何问题,请联系我 | MT4 版本 我的 #1 多功能工具: 包含 66+ 项功能,包括此指标 | 如有任何问题,请联系我 | MT4 版本 我的 #1 多功能工具: 包含 66+ 项功能,包括此指标 | 如有任何问题,请联系我 | MT4 版本
//--

XFlow shows an expanding price channel that helps determine the trend and the moments of its reversal. It is also used when accompanying transactions to set take profit/stop loss and averages. It has practically no parameters and is very easy to use - just specify an important moment in the history for you and the indicator will calculate the price channel. This is a demo version limited to CHF currency pairs. Designed to familiarize you with the interactive use of XFlow DISPLAYED LINES ROTATE
FREE

XFlow shows an expanding price channel that helps determine the trend and the moments of its reversal. It is also used when accompanying transactions to set take profit/stop loss and averages. It has practically no parameters and is very easy to use - just specify an important moment in the history for you and the indicator will calculate the price channel.
DISPLAYED LINES ROTATE - a thick solid line. The center of the general price rotation. The price makes wide cyclical movements around the
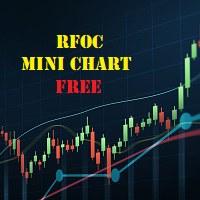
The RFOC Mini Chart was created to project a macro view of the market, which the option to select the timeframe of interest other than the main chart, it is possible to include 2 indicators: 1 - Moving average channel On the mini chart, the moving average will be created based on the prices of the selected time frame for the RFOC Mini Chart. The moving average period must be selected in the indicator settings pannel.
2 - Boillinger Band In the mini chart, a boillinger band will be created based
FREE
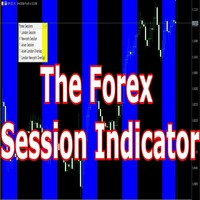
Having trouble marking where the various forex sessions start and end? Or perhaps your strategy requires you trade only in a specific session, then this is for you.
The session indicator shades the session you require in a certain color so that you can identify it easily. The sessions shown include: London session, New York session, Asian Session, Asian - London overlap and London - New York Overlap.
Difference source give varying time ranges for the various session, mostly differing by not m
FREE
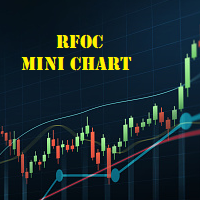
The RFOC Mini Chart was created to project a macro view of the market, which the option to select the timeframe of interest other than the main chart, it is possible to include 2 indicators:
In the full version it is possible to include 2 indicators: 1 - Moving average channel On the mini chart, the moving average will be created based on the prices of the selected time frame for the RFOC Mini Chart. The moving average period must be selected in the indicator settings pannel. 2 - Boillinger Ban
FREE
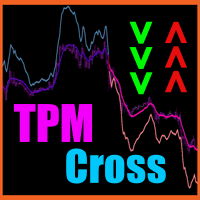
TPM Cross (trend power moving cross) - is a trend following strategy based on custom signal points. Indicator consists from main custom moving chart line and trend power line. Indicator defines up and down movements by it's trend power and custom moving direction. When current market's trend looses it's power and opposite trend starts - power trend line crosses moving and indicator plots an arrow. Main indicator's adjustable inputs : movingPeriod - period of moving line trendPeriod - period

Impulse fractals indicator - is counter-trend oriented complex market fractal pattern. Market creates bull/bear impulse, trend starts, fractals on impulsed wave are an agressive pullback signals. Buy arrow is plotted when market is bearish and it's impulse showed up-side fractal, and sell arrow is plotted when market is bullish and it's impulse showed dn-side fractal. Main indicator's adjustable inputs : impulsePeriod - main period of impulse histogram filterPeriod - smoothes impulse accordi
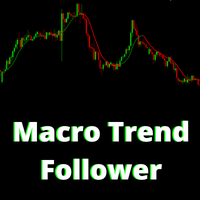
The Indicator assists in decision making along with the user's market reading. By drawing the trend, this indicator becomes very useful on days of high volatility in the market, that is, it offers strategic insights on days of economic data, news or pronouncements. On flat market days it becomes usual to identify possible market reversals. Follow Youtube to understand the most suitable scenarios for its use.
FREE
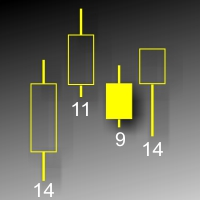
Данный индикатор показывает объем каждого бара (видимый диапазон) в пунктах. Гибкие настройки отображения значений. Возможна настройка параметров показа. Индикатор создавался для личного пользования, анализа графиков. Параметры: Color - цвет текстовых меток; Position - позиция метки: 0 - снизу, 1 - сверху; FontSize - размер шрифта; Angle - угол наклона текста; GapPoints - отступ по вертикальной оси.
FREE

Fast Trade Detector (FTD) - Самый правдивый индикатор, который показывает истинное
настроение Большого Игрока.
На бирже есть Игрок, у которого есть всё для того, чтобы быть в первых рядах в книге торговых
приказов (биржевом стакане). Эти сделки как индикатор рыночного настроения сильного игрока.
Вы поймёте, что всё не совсем так, как представляли раньше. Вам откроются алгоритмы и стратегии
крупного участника рынка. Исполнение индикатора в виде гистограммы в подвале графика. Гистограмма п

The BSI stands for Bar Strength Index. It evaluates price data using a unique calculation. It displays readings in a separate window. Many financial investors mistake this indicator for the Relative Strength Index (RSI), which is incorrect because the BSI can provide an advantage through its calculation method that the RSI indicator does not. The Bar Strength Index (BSI) is derived from the Internal Bar Strength (IBS), which has been successfully applied to many financial assets such as commodit

The KT Tether Line is a trend-following tool consisting of three indicators that work together to generate trading signals. It can correctly identify market trends while signaling trade entries. It was first introduced by Bryan Strain in the Stock & Commodities magazine in 2000 in "How to get with the trend and out at the end."
The Concept
When a market trend is confirmed, the most challenging part is determining the timing of the entries. This indicator alerts you to potential trend reversals

Um Inside Bar é um dos principais sinais de continuidade de uma tendência existente e as vezes reversão, pois nos mostra locais especiais de entrada, possibilitando uma boa taxa de Risco x Retorno. É simples visualizar um Inside Candle. Esse padrão é formado por apenas dois candles. O primeiro deve ser, preferencialmente grande, e o segundo deve estar integralmente contido dentro dos limites de máxima e mínima do primeiro.
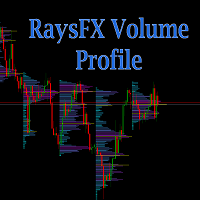
Calculation method The calculation method is summing the number of deals performed at a certain price. Alternatively, the volumes at a certain price can be summed if the real volume type is set in the parameters. The trade data is interpolated based on the most accurate terminal data available (М1 timeframe data). Each bar is divided into several trades based on the estimated price movement inside the bar. This is a distinguishing feature of the product setting it apart from other ones that hav

Ichimoku Aiko MTF is a collection of technical indicators that show support and resistance levels, as well as momentum and trend direction. It is a multi-timeframe indicator so you don't need to change the chart timeframe when you want to see the ichimoku clouds on a higher timeframe. eg. The chart timeframe is M15 and you want to see on the M15 timeframe chart the H1 ichimoku indicators (the ichimoku in Metatrader can't do that) that's why you need to use Ichimoku Aiko MTF.

市场转向时,单看价格并不一定能马上看清变化。KT XMaster Formula 将趋势与动量计算整理成清晰的点状线、黄色转向箭头和多周期面板。您可以查看当前方向、最近一次方向变化的位置,并结合图表上的价格结构判断这个读数。 它的计算结合了移动平均平滑处理以及基于 RSI 和 MACD 的信息。您无需叠加多个指标,只需一个直观参考,就能配合剥头皮、回调交易或趋势跟随方法使用。 一条线,三个清晰提示 绿色点状线: 指标当前判断为看涨方向。 红色点状线: 指标当前判断为看跌方向。 黄色箭头: 读数已从一个方向切换到另一个方向。 面板显示从 M1 到 MN1 的看涨或看跌读数。这样您可以快速确认新的图表信号是否与更快和更慢的周期一致,还是出现在各周期仍然分歧的阶段。 把信号放进自己的交易计划 观察多头机会时,可留意点状线由红色转为绿色时出现的黄色向上箭头。观察空头机会时,可留意点状线由绿色转为红色时出现的黄色向下箭头。随后再根据自己的入场规则、价格结构和常用交易时段判断是否采用该信号。 有些交易者会参考最近的波段低点或高点安排风险,并把下一次反向信号作为可能的离场提示之一。最终的入场、止损和

在MetaTrader中,绘制多个 水平线 并跟踪各自的价格水平可能非常麻烦。该指标可自动在等间距位置绘制多个水平线,用于设置价格提醒、标记支撑和阻力位以及其他手动操作。 这个指标非常适合刚接触外汇交易的新手,帮助他们寻找买卖机会并实现快速获利。无论市场处于趋势中还是震荡状态,水平线都能帮助交易者识别潜在的进出场区域。
功能特点 可根据输入参数中的预设,瞬间绘制多个水平线。 使用鲜明的色彩主题,区分不同的水平线。 是追踪多个交易时段价格区间的必备工具。 当价格触及某条水平线时会自动发出提醒。 可设置提醒之间的间隔,避免重复提醒造成干扰。 支持完全自定义设置。
说明 该指标根据输入参数中的配置自动绘制水平线。观察价格在这些水平线附近的反应,可以帮助识别关键支撑/阻力位附近的潜在交易机会。 例如,在水平支撑位形成一根看涨Pin Bar,通常意味着价格可能会继续上涨,朝最近的阻力位移动。 若价格以一根看跌K线收盘于支撑位下方,则可能表明刚刚发生了一个下行突破。而在水平线上发生的假突破,则说明价格未能突破关键水平,可能即将反转方向。 一些价格反转形态(如Pin Bar或假突破)对于

一个专业的交易工具是RSI和价格之间的背离指标,它允许您及时收到关于趋势反转的信号或捕捉价格回调走势(取决于设置)。 指标设置允许您根据RSI峰值的角度和价格的百分比变化来调整发散的强度,这使得微调信号强度成为可能。 指标代码经过优化,并作为Ea交易的一部分进行了非常快速的测试。
指标不重绘,交易方向的箭头正好位于信号出现的位置--在柱的开口处。 Fractal True . PeriodRSI_P = 14 ; //Period IndentFrom50_P = 10.0 ; //Indent +- from 50 [0...50] LeftBars_P = 1 ; //LeftBars RightBars_P = 1 ; //RightBars IndDivForce_P = 15.0 ; //Divergences force of indicator (not for the Lite version) PriceDivForce_P = 0.01
FREE

The Envelopes M indicator is based on the popular Envelopes technical indicator, which is used to create flexible channels where prices stay most of the time. The boundaries of these corridors are two moving averages. But the application that the price is in the channel most of the time is not completely correct, since the channel often breaks out and the price falls far beyond the channel. The main difference of this indicator is that with each new channel breakout, the channel line expands fo

Trend TD is a trend indicator. Thanks to the algorithm of this indicator, the signal will never go against the trend. Thanks to the two lines forming a narrow channel, the algorithm for analyzing entry points, the algorithm controls the reversal moments at the moment when the upper line of the channel has reversed and it is possible to visually draw a line crossing the upper line with itself in the past, while crossing the lower line at one point. If this rule is fixed, then the signal will b

该指标与对象"趋势线","矩形","文本"一起工作,并允许您创建并将它们从一个图表复制到另一个图表。
它是自动复印机更方便的替代方案,因为它允许您更灵活地选择应该复制的内容和位置。
键盘快捷键:
'1,2,3,4,5,6'-创建细水平线(颜色在设置中设置),与SHIFT-粗线相同 '~'-用随机颜色创建一条线))) '7,8,9'-创建阴影矩形(设置中的颜色变化) '0'-创建与图表时间框架相对应的文本。 例如,M5,M15等。 SHIFT+向上箭头-使所选线条更粗 SHIFT+向下箭头-使所选线条更细 'c'-复制选定的对象 'a'-复制所有对象 'v'-粘贴复制的对象 'h'-水平对齐选定的趋势线(在左边缘) 'r'-从图表中删除所有对象 'q'-关闭指示器
指标应该在所有图表上运行。
專業的交易工具 - AO 和價格之間的背離指標,讓您及時接收趨勢反轉的信號或捕捉價格回調(取決於設置)。指標設置允許您調整由於 AO 峰值的斜率和價格變化的百分比而導致的背離強度,從而可以微調信號的強度。作為 EA 的一部分,指標代碼經過非常快速的優化和測試。
指標不會重新繪製,交易方向的箭頭正好位於信號出現的位置 - 在柱的開盤處。 Fractal True FastPeriod_P = 5 ; //Fast period SlowPeriod_P = 34 ; //Slow period LeftBars_P = 1 ; //LeftBars RightBars_P = 1 ; //RightBars IndDivForce_P = 15.0 ; //Divergences force of indicator (not for Lite version) PriceDivForce_P = 0.01 ;
FREE

The Average Daily Range (ADR) is an indicator that shows how far a currency pair can move in a day.
Automatically displays the upper and lower ADR levels.
Automatically calculates the percentage and distance of ADR achieved by the currency pair for the day.
Changes the color and thickness of the ADR line when the price reaches it.
The payment is made in 14 days. It is displayed on timeframes from M1 to M30.

Demarker pullback system - is the manual trading system for choppy markets. It show 2 colored histogram. When histogram is blue - market is quite bullish, when histogram ir orange - market is more bearish. Up arrow is plotted when histogram is in oversold zone but blue color. Down arrow is plotted when histogram is in overbought zone but orange color. These patterns shows false breakout and possible soon reverse(price is overbought but shows bearish signs and price is oversold but shows bullis

Session Killzone Indicator
Indicator that helps you to identify the killzone times of both London and NewYork sessions which usually is the most times for high volatility and taking liquidity from the market. Killzone times are configurable through indicator parameters. The indicator adjusts the range of the killzones based on the daily trading range.
FREE

The KT Trend Angle helps to identify ranging and trending markets. The idea is to only enter a trade following the market trend if the slope is steep enough.
An angle is the ratio of the number of bars to the number of points: The bars mean the time offered by standard (M1, M5, etc.) and non-standard time frames. Points represent the unit of price measurement with an accuracy of 4 or 5 decimal places.
Input Parameters Period: An integer value to define the intensity of angled trendlines. Angl
A very good indicator for experienced and professional traders . A practical approach to trading. Easy to understand. A helping tool for traders looking for price movements .
Signals: Signal Number 1: When yellow line which is a signal line crossing the zero line towards downward direction is a selling opportunity. Signal Number 2:
When yellow line which is a signal line crossing the zero line towards upward direction is a buying opportunity.

KT Forex Blau Balance combines elements of momentum and volatility. It helps you identify entry and exit points.
Blau Balance consists of two moving averages (a slow-moving average and a fast-moving average) intersecting key transition points in market price. The indicator turns green or red when one is above or below the other, signaling to buy or sell trade signals.
It can be used in currency pairs and other markets that your MT4 or MT5 platform supports. Both short-term and long-term trade

The KT De Munyuk is a trend-based indicator that uses Parabolic SAR to identify the market direction. The indicator shows the PSAR in the form of green/red dots using a separate window. Buy Signal: When a green dot appears after a series of at least three red dots. Buy Exit: When a red dot appears on the current or next higher time frame. Sell Signal: When a red dot appears after a series of at least three green dots. Sell Exit: When a green dot appears on the current or next higher

KT Forex Trend Rider uses a trend following algorithm developed specifically for the Forex market to provide reliable buy & sell signals across the major currency pairs. It works best on major FX pairs and all time-frames.
Features
It comes with a Multi-Timeframe scanner that can search for upcoming signals across all the time-frames. It comes with four preset profiles to facilitate trading for scalpers, tick-trend, swing, and trend traders. It marks the potential reversal points in the market.

波动率分析仪是一种动量指标,它利用价格在狭窄交易区间盘整后强劲突破的趋势。该指标还使用动量振荡器来显示挤压触发时的预期移动方向。该直方图在零线附近震荡,零线上方的动量增加表明有机会买入多头,而动量低于零线则表明有做空机会。
限时优惠:该指标仅适用于 50 美元和终身。 (原价 125 美元) 主要特征 横向趋势检测器。 低挥发性检测器。 看涨高位和看跌高波动率检测器。 使用所有时间框架和所有货币对。 提供弹出警报和推送通知警报。
接触 如果您有任何问题或需要帮助,请通过私信与我联系。
警告 我们所有的指标和工具都只能通过官方 Metatrader 商店 (MQL5 市场) 获得。
溢价指标 通过访问我们的 MQL5 配置文件,您可以找到我们所有的免费和高级指标。要访问我们的个人资料, 请单击此处。
作者 SAYADI ACHREF,金融科技软件工程师,Finansya Lab 创始人。

About the indicator: DALA Forecast is a universal tool for predicting the dynamics of time series of any nature. For prediction, modified methods of nonlinear dynamics analysis are used, on the basis of which a predictive model is built using machine learning methods. To get the trial version of the indicator, you can contact me in private messages.
How to use the indicator: Apply the indicator to your chosen financial instrument or indicator with the settings you need. The prediction will be
FREE

The Roll the Field indicator displays signals in a simple and accessible way in two colors (when to buy and when to sell is determined by changing the color). Knowing the entry point of each currency is very important for every forex trader. The intelligent algorithm of the indicator accurately determines the trend, filters out market noise and generates entry signals.

Point discussion is a fundamental technical indicator - an algorithm that allows you to obtain data on future prices using quotes data for a certain period of time specified in the indicator settings. The technical analysis indicator Point discussion is based on a special formula. It is with its help that the calculation takes place. The indicator is well suited for determining a reversal or a large sharp jerk to one side, thanks to it you will know when this happens, it will notify you by the a

the fundamental technical indicator Informative Trend, which allows you to assess the current market situation in order to enter the market of the selected currency pair in a trend and with minimal risk. It basically uses the process of identifying the rate of change in price growth and allows you to find entry and exit points from the market.
The indicator was created on the basis of the original indicators for searching for extreme points and is well suited for determining a reversal or a la

The movement exhaustion is a color rule that helps indicate when the movement will revert its direction. The darker the color, the greater the probability to revert. The indicator is based on the price statistic. Works on every timeframe, every instrument. Five color options: 0. Natural movement. (Gray) 1 - 4. Movement exhaustion (Yellow to maroon) The trader can use it as reversal or exhaustion signal. In a trend following trade it can be used as an exhaustion signal, indicating the movement ca

Here’s the problem: the default zigzag indicator given in MT5 trading platform does not really capture the most of the highs and lows on chart do draw zigzags. On chart below, notice that some of ther high, low of price have been missed to draw zigzags by this default zigzag indicator (picture 1). It is not so apparent until you compare default zigzag indicator to this SwingZZ indicator. Have a look on picture 2 and 3. The swing zigzag indicator is best because it captures most of the swing high
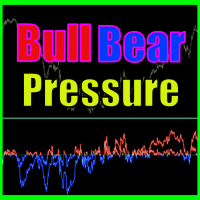
Bull bear pressure indicator - is the manual system which defines bull/bear market. When lines is above zero level - market is strong bullish, and when lines below zero level - market is bearish. First line represents global trend and second one are smoothed and shows local market's mood. Main inputs are : MainPeriod- main indicator's period for global trend calculation; SignalPeriod - period for smoothed and shows local market's trend; Main Indicator's Features Signals are not repaint,non-late
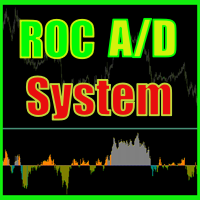
ROC acceleration-deceleration is the manual system for medium-term scalping. Indicator based on custom ROC system which defines bullish/bearish market and especially acceleration-deceleration of tendention in the market's main direction. Buy arrow is plotted during bearish market when current trend decelerates and sell arrow is plotted during bullish market when current trend decelerates. Main Indicator's Features Signals are not repaint,non-late or disappear(exept cases when system recalculat

ASI fractals with DPO filter - is the manual trend-following system. ASI fractals are the base of every trend. System plots an arrow when fractal pattern appears on ASI indcator and DPO direction is same as incomming signal. System has several ways of usage : simply indicator, indicator with suggested arrows, arrows with single targets and arrows with common profit targets. User can simply switch indicator's modes directly from chart. Main Indicator's Features Signals are not repaint,non-late or
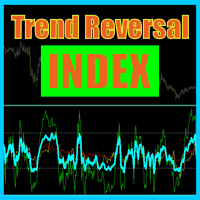
Trend reversal index - is the manual trading system that works with overbought , oversold levels and reversal patterns. Sell arrow is plotted when indicator is higher than overbought level and here forms reversal pattern, all pattern points located higher than overbought level. Opposite with buy arrow : ndicator is lower than oversold level and here forms reversal pattern, all pattern points located lower than overbought level. Main Indicator's Features Signals are not repaint, late or disapp

Theoretical Foundation The Keltner Channels are channels ploted using volatility deviations above and bellow a moving average. The indicator is an excellent tool to help the trader build trend and mean-reversion strategies. Parameters The Orion Dynamic Keltner allows the user to select the Volatility Calculation Type, being ATR or Average Range (not considering price gaps). Also, the user can select the Calculation Period, Number of Deviations, Moving Average Mode and the Moving Average Ca

Theoretical Foundation Similar to the well-known Average True Range (ATR), the Average Range indicator is a volatility measure that is calculated using only the range of the bars (high – low), not considering the Gaps, as with the ATR. The Average Range can be very useful for day traders as it allows one to get the measure of the volatility of the last N bars. Parameters You can select the calculation period of the indicator.

Early WPR divergence - is the manual system to define trend reverse. Green histogram shows main trend, Orange one - shows "short"/local trend. System is looking for clear divergence between both trends and pick up position(plot buy/sell arrows). When main trend is up, but local trend reverses to bearish trend and get's big power - sell arrow is plotted; When main trend is down, but local trend reverses to bullish trend and get's big power - buy arrow is plotted; Main inputs are : mediumTrendPe
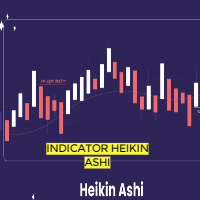
In this indicator, Heiken Ashi candles are calculated with the most optimal method. You can also customize the results by adjusting the amount of period and method input. But the most important advantage of this indicator is the adjustment of the time frame value. You can use this to calculate the Heiken Ashi chandels to See in time frames with lottery in the lower time chart. In this case, you get the best signal to buy or sell using two or more Heiken Ashi indicators with different timeframes
FREE

Normal Parabolic SAR with label of long or short state. Tells also "Parabolic long" and "short". Can be used in multitimeframe layouts together with Swiss HolyGrail indicator or in different timeframes. So, if all the indicators show "long" or "short" you can be sure that the risk of a wrong direction is small. The standard values for Parabolic SAR are 0.02 for step and 0.2 for maximum. You may experiment with changing the maximum to get smother curves. Note that changes in parabolic SAR are la
FREE
Индикатор отображает изменение баланса В правом нижнем углу окна.
Отображаются следующие периоды Сегодня Вчера 3 дня Неделя 10 дней Месяц 3 месяца Полгода Год Все время Есть возможность выставить расчетное время. Удобно пользоваться для расчетов прибыли/убытков с определенного часа.
Будет полезен например ночным скальперам. Данные совпадают с расчетами отчета в терминалее.
FREE

Precision Trading with the Inside Bar Pro Indicator for MT5 The Inside Bar Pro indicator by @Billyenaire is a powerful tool designed for traders who rely on clean, price-action-based setups. It automatically detects inside bar formations—candlestick patterns where the current candle is completely contained within the high and low of the previous candle. Key Features: Automatically identifies inside bars in real-time Highlights inside bars directly on the chart using customizable candle colors W
The Choppiness Index was created by Australian commodity trader E.W. Dreiss. It is designed to determine if the market is choppy (trading sideways) or not choppy (trading within a trend in either direction). A basic understanding of the indicator would be; higher values equal more choppiness, while lower values indicate directional trending. The values operate between 0 and 100. The closer the value is to 100, the higher the choppiness (sideways movement) levels. The closer the value is to 0,

Meet the new generation ichimoku cloud. You can develop hundreds of strategies on it. Or you can open a trade directly by looking at whether it is above or below the cloud.
Now it is much easier to know the trend...
Once you get used to this cloud, you won't be able to look at the graphics without it.
The calculation logic is completely different and you will experience the privilege of looking at the market from a different perspective.
By looking at the chart, set the appropriate paramete

YouTube上的指標直播。更多可信度請點擊下面的鏈接。還有指標的視頻可以觀看。注意直播晚了,不要依賴,只有對指標的回顧僅回顧指標的準確性,幾乎不輸,利潤率達到 95%。我將在 CRASH coin 1000 INDICES 上非常準確地工作 YouTube上的指標直播。更多可信度請點擊下面的鏈接。還有指標的視頻可以觀看。注意直播晚了,不要依賴,只有對指標的回顧僅回顧指標的準確性,幾乎不輸,利潤率達到 95%。我將在 CRASH coin 1000 INDICES 上非常準確地工作 YouTube上的指標直播。更多可信度請點擊下面的鏈接。還有指標的視頻可以觀看。注意直播晚了,不要依賴,只有對指標的回顧僅回顧指標的準確性,幾乎不輸,利潤率達到 95%。我將在 CRASH coin 1000 INDICES 上非常準確地工作
下一代自动化供需区。适用于任何图表的创新算法。所有区域都是根据市场的价格行为动态创建的。
两种类型的警报 --> 1) 当价格触及区域时 2) 当新区域形成时
你不会再得到一个无用的指标。您将获得一个完整的交易策略和经过验证的结果。
新的功能:
价格触及供需区时发出警报
创建新的供应/需求区时发出警报
推送通知警报
以点为单位的区域宽度标签
关于 MTF 的又一个时间表。因此,现在您将能够看到高于当前 3 个时间帧,而不是高于当前 2 个时间帧
启用/禁用警报/区域/MTF 功能的按钮
您获得的优势:
消除交易中的情绪。
客观化您的交易条目。
通过高概率设置提高您的利润。
节省绘图区域的时间。
像专业人士一样交易金融市场。
任何市场的即时多时间框架分析。
你在图表上看到了什么?
蓝色和红色矩形是当前时间范围的供需区。
虚线样式线是当前上方第一个时间范围内的供需区域。
实线样式线是当前上方第二个时间范围内的

DESCRIPTION
The EasyFollowerTrader-Bot3-DayTrade indicator only trades with the trend. Thus, the indicator will, at first, observe the trend of three averages synchronous with the selected time-frame. Then the indicator observes the trend of the daily chart. When these two charts are moving in the same direction, we have the highest probability of winnings. We will call this region the region of high probability of gain.
In the region of high probability of gain, the indicator will indicate t

DESCRIPTION
The EasyFollowerTrader Bot4 DayTrade indicator always trades with the trend. Thus, the indicator, at first, observes the trend of the average of the highs and lows of the candles of the selected time-frame. Then see if this trend is in line with the trend of the daily chart to operate in favor of the major trend. When these two charts are moving in the same direction, we have the highest probability of winnings. We will call this region the region of high probability of gain.
In t

DESCRIÇÃO O indicador EasyFollowerTrader-Bot2-DayTrade opera apenas a favor da tendência. Assim, o indicador, em primeiro momento, observar a tendência de três médias síncrona com o time-frame selecionado. Em seguida, o indicador observar a tendência do gráfico diário. Quando estes dois gráficos estiverem se movimentando na mesma direção, teremos a maior probabilidade de ganhos. Chamaremos esta região como região de alta probabilidade de ganho. Na região de alta probabilidade de ganho, o ind
Simple ATR Modern 一个简化的工具,用于更清晰地跟踪市场波动性,适合日内交易和波段交易。 它是开始交易或初学者的最佳指标。
视觉指标颜色:ATR Daily - 蓝色 通过结合 Volatility Vision 指标增强分析。 精确测量市场状况的波动,对日内交易和波段交易决策至关重要。 利用基础的 14 天(可配置)简单移动平均真实范围指标确保准确性。 适用于在交易系统中实施开仓或退出策略。 为什么 ATR 指标优于其他指标: 使用简单:ATR 指标易于设置和理解,即使是新手交易者也能轻松上手。 多功能性:适用于日内交易和波段交易,在各种交易策略中提供灵活性。 可靠性:ATR 提供准确的市场波动数据,帮助交易者做出更明智的决策。 可定制性:能够调整移动平均周期,使交易者能够根据自己的特定需求和偏好调整指标。 可组合性:ATR 易于与其他指标结合,如 Volatility Vision ,进行更深入的市场状况分析。

Colors generated according to the Height and Depth parameter.
The analysis is carried out following the direction of the price and volume traded if the traded value exceeds the calculation base the system changes the color to green, informing you that the price direction is strong to buy, if the traded value is less than the calculation base the system changes to red, indicating that the price is strong for sale.
FREE

One of the main definitions for monitoring the currency market is a trend, which is why the Megan indicator was created in order to display the trend in a visual form. Forex indicator Megan is a real trading strategy with which you can achieve the desired results. As soon as the indicator is set, the main indicators will immediately begin to be recalculated at the price of the traded pair, based on the postulates of technical analysis. In addition, when potential entry points are detected, visua
TransitGhost Signal indicator, this is one of my best forex trading strategy. The strategy is based on the simple moving average cross, 5 SMA AND 200 SMA of which take a longer time to cross. Whenever the is a cross between the 5 SMA and 200 SMA a signal will be given, when the 5 SMA cross the 200 SMA to the upside ,a buying arrow will appear on chart, and push notification(alert) "Buy now, use proper risk management" will be sent on both the MT5 PC and mobile app, and when the 5 SMA cross the 2
FREE

The Average Daily Range (ADR) is an indicator that shows how far a currency pair can move in a day. Automatically displays the upper and lower ADR levels. Automatically calculates the percentage and distance of ADR achieved by the currency pair for the day. Notifies when the price reaches the ADR level. Changes the color and thickness of the ADR line when the price reaches it.

Everything is simple. The usual Information indicator.
Shows on the chart: Current spread, buy swap, sell swap, time to close the candle, broker time.
The indicator can be placed at the top right or at the bottom right of the chart.
Most often, the spread is called the difference between the sale and purchase price.
Swap is the cost of transferring a position to the next day.

A version based on David Waves' description in his book 'Trade About to Happen' of his adaptation of the Wyckoff wave chart. The indicator directionally accumulates volume, adding to each brick or candle close, with color indication for up and down. it can be used it with tick or real volume, it also changes color when the accumulated value of the previous wave is exceeded, being the trade signal. Yellow color is used for doji candlestick, it will continue with accumulation without zero the sum
MetaTrader市场是 出售自动交易和技术指标的最好地方。
您只需要以一个有吸引力的设计和良好的描述为MetaTrader平台开发应用程序。我们将为您解释如何在市场发布您的产品将它提供给数以百万计的MetaTrader用户。
