 MetaTrader 5
 专家
专家 指标
指标 程序库
程序库 实用工具
实用工具 窗口小部件
窗口小部件 规则
规则适用于MetaTrader 5的免费EA交易和指标 - 35
 使用EA交易和指标,使外汇交易获得更多盈利。EA交易可使您自动开启和关闭交易,而指标将帮助您更准确地预测市场行为。
该页面提供MetaTrader 5应用程序的目录。
使用EA交易和指标,使外汇交易获得更多盈利。EA交易可使您自动开启和关闭交易,而指标将帮助您更准确地预测市场行为。
该页面提供MetaTrader 5应用程序的目录。 
Investment Castle RSI Divergence — Catch the Turn Early
The RSI Divergence Indicator helps you spot potential reversals before they happen by detecting discrepancies between the RSI and price. Divergence is one of the most respected early signals of a trend change — from bullish to bearish or vice versa — now flagged for you automatically.
What it does for you Automatic divergence detection: bullish and bearish RSI/price divergences flagged on your chart. Earlier reads on reversals: see moment
FREE

Our offer also includes a free panel — Indicator Panel — which allows you to show or hide indicators created by BOToBRACIA -> MT4 / MT5 Our offer also includes a version for MetaTrader 4 -> https://www.mql5.com/en/market/product/171225?source=Site+Market+Product+Page
High and Low Points is a practical technical analysis indicator that plots levels corresponding to the highs and lows from previous periods (day / week / month) — levels that, in the Smart Money Concepts (SMC) and ICT appro
FREE

Trade Hunter MT5 - Buy and Sell Indicator
This powerful indicator identifies potential buy and sell signals by analyzing price movements over a customizable period. Blue arrows mark buy opportunities below key lows, while red arrows highlight sell signals above critical highs. With adjustable parameters like bar range, percentage offset, and alert settings, Trade Hunter adapts to your strategy. Optional alerts and notifications ensure you never miss a signal. Perfect for traders seeking a reli
FREE

DOJI CANDLES WITH TRAILING STOP LOSS EA. It is an automated trading program with two main functions. Use all types of Doji candlesticks as entry signals. Combined with a Trailing Stop, moving the Stop Loss protects the profit of the position. This program is only compatible with pairs such as XAUUSD and BTCUSD. It runs on Exness and managed funds like FTMO and Ther 5R. In the time, the program only runs one position. Experimental test results across different timeframes and recommendations. M1
FREE

Fibonacci Pro Fibonacci Pro is an automatic Fibonacci indicator for MetaTrader 5 designed to identify the current market movement and draw clean retracement and extension levels directly on the chart. It detects the relevant swing high and swing low of the active move, then plots key Fibonacci levels with clear labels, making it easier to analyze pullbacks, continuation zones, and potential reaction areas. Main Features Automatic Fibonacci drawing based on the current market movement Detects swi
FREE

AstroCycles: Advanced Financial Astronomy Indicator Overview AstroCycles is a sophisticated technical analysis tool developed for the MetaTrader 5 (MQL5) platform. It bridges the gap between orbital mechanics and financial market analysis by calculating precise astronomical cycles and visualizing them directly on your trading chart. Unlike standard indicators that rely on past price data, AstroMaster utilizes high-precision astronomical algorithms (Keplerian Elements and Brown’s Lunar Theory)
FREE
The RFOC Candle Timer 2x was created for the trader to locate himself in time, having access to the pending time for the formation of a new candle. Additionally, it is possible to include in the chart a second timer that shows the pending time for the formation of a new candle in a time period different from the current one. The user will have the option to select up to 4 different positions for the timer display ("No candle", lower left corner, lower right corner or upper right corner). In ad
FREE

MAKO Achronos 是一款适用于 MetaTrader 5 的 Price Path Intelligence 价格路径智能指标,用于观察市场如何在价格空间中移动并形成结构。
Achronos 不以K线持续时间作为主要分析依据,而是组织价格实际经过的路径,并跟踪其从微小运动到更大结构形成的传播过程。
其目标是提供一种不同的市场观察方式:减少对时间的依赖,更专注于价格实际运行的顺序。
主要功能
• 可视化价格结构路径 • 基于价格运动实际顺序进行分析 • 独立窗口显示 Achronos Path • UP 和 DOWN 方向识别 • Inflection Zone 拐点区域检测 • 结构形成阶段分析 • EARLY、BUILD、ACTIVE 和 MATURE 状态 • 结构保护状态评估 • 可用价格空间分析 • 集成 Price-Path Window 信息面板 • 根据状态变化的结构路径线 • 图形化显示 Inflection Zone • 不将K线持续时间作为信号判断依据
如何理解
Achronos 跟踪价格形成的路径,并同时评估多个结构尺度。
当价格运动开始
FREE

Session Mapper — Free Visual Session Indicator for MT5 Session Mapper draws colored rectangles on your chart showing the exact range of each major trading session: Asia, London, New York, and the London-NY Overlap. Each rectangle spans from the session high to the session low, with a label showing the session name and range in pips. Features: Automatic detection of Asia (00:00-07:00 GMT), London (07:00-16:00 GMT), New York (13:00-22:00 GMT) and London-NY Overlap sessions Adjustable broker GMT of
FREE

Trade2Telegram — 一个用于将MetaTrader交易自动通知发送到Telegram的插件。 该工具适用于管理资金的交易者、运营信号频道的人员或领导教育社区的人。该插件会将终端中的所有交易操作复制并发布到选定的Telegram聊天、群组或频道中。 当开仓或平仓、止损或止盈水平变动、挂单触发或部分平仓时,消息会自动发送。 您可以自定义消息格式,包括:交易品种、交易方向、交易手数、开仓和平仓价格、止损/止盈水平,以及点数和金额的结果。它还支持添加标签和备注,并可选择服务器时间或本地时间。 该插件直接通过Telegram Bot API工作,无需任何第三方服务。连接方式非常简单,只需提供您的Bot令牌和目标聊天或频道的ID即可。 主要优势: 完全自动化的交易通知; 灵活的消息格式和发送频率; 支持所有订单类型; 可维护公开或私人的交易统计。 该插件非常适合信号频道、私募交易办公室、团队交易日志以及透明的实时交易跟踪。
FREE

QuantMatrix Volatility Regime QuantMatrix Volatility Regime is a technical indicator for MetaTrader 5 that evaluates the current volatility of the selected symbol and timeframe. The indicator uses Average True Range (ATR) to compare current volatility with a historical baseline calculated from previous bars. Based on this comparison, the current market condition is classified into one of four volatility regimes: LOW – current volatility is below the historical baseline. NORMAL – current volatil
FREE
用於Boom 和Crash 合成的MFI 和RSI 狙擊進場訊號配備了強大的進場警報系統,對於更高級的過濾訊號,請考慮Harmonic Hybrid Pilot Pro。當交易尖峰時,您有三個訂單邏輯地放置來分配風險,第三個訂單最後是接近峰值的最高機率。 訊號在最終訂單下達十五分鐘後失效,且必須立即平倉。 對於 Tp,我建議您在對您有利的峰值出現後立即退出。 透過私人訊息部分向我發送訊息,以獲得全面的使用者指南。 用於Boom 和Crash 合成的MFI 和RSI 狙擊進場訊號配備了強大的進場警報系統,對於更高級的過濾訊號,請考慮Harmonic Hybrid Pilot Pro。當交易尖峰時,您有三個訂單邏輯地放置來分配風險,第三個訂單最後是接近峰值的最高機率。 訊號在最終訂單下達十五分鐘後失效,且必須立即平倉。 對於 Tp,我建議您在對您有利的峰值出現後立即退出。 透過私人訊息部分向我發送訊息,以獲得全面的使用者指南。
FREE

Adaptive Pulse 是一款适用于 MetaTrader 5 的自适应趋势指标,可帮助交易者识别当前市场方向、过滤较弱的价格波动,并在图表上直接显示经过确认的入场和出场信号。 市场状态始终在变化。在平静时期,价格波动较慢,往往会产生大量虚假交叉信号;而在高波动时期,传统趋势线又可能反应过慢。Adaptive Pulse 会根据当前市场环境自动调整灵敏度,因此在横盘阶段更加平滑,在强趋势行情中则能够更快地响应价格变化。 该指标会分析价格运动效率、短期与长期波动率、自适应趋势线的斜率以及趋势强度。信号仅在当前蜡烛图收盘后确认。已经形成的历史信号不会在之后发生移动、消失或改变。 Adaptive Pulse 的工作原理 自适应趋势线会根据当前市场方向改变颜色: 橙色表示上涨方向; 红色表示下跌方向; 中性色表示当前没有确认的趋势。 当价格确认进入上涨走势时,指标会生成买入信号。当下跌方向得到确认时,指标会生成卖出信号。内置横盘过滤器会在市场缺乏足够趋势强度时,过滤掉部分较弱的信号。 图表上会显示入场箭头、出场箭头以及计算出的交易水平,因此无需手动绘制额外线条,即可快速评估潜在交易机会
FREE

M-Sync EA Description Stop guessing on news days. M-Sync News Trader is a semi-automated tool built for traders who want control and clarity during high-impact events like NFP, CPI, and rate decisions. It helps you plan, execute, and manage a professional news straddle — automatically placing Buy/Sell Stop orders before the event, triggering one as the news hits, and instantly cancelling the other. You define your rules, and M-Sync handles the rest.
Key Features Smart Straddle Setup: Automatica
FREE

Investment Castle 趋势线 — 价格行为,自动为您绘制
出色的交易始于读懂趋势——供需、上升与下降通道、趋势线和吞没K线。Investment Castle 趋势线会在您的图表上自动整合这幅价格行为图景,让您以更少的猜测和更小的压力抓住趋势。
它能为您做什么 自动趋势线: 主导的趋势线为您绘制——无需手动作图。 价格行为背景: 结构、方向和关键转折点一目了然。 更少压力、更快判断: 把时间用在决策上,而非画线。 基于经过验证的价格行为: 专业交易者抓趋势所用的同一方法。 处处适用: 任何品种、任何周期。
适合人群: 希望入场前就看到趋势的价格行为交易者。
风险提示: 交易存在重大亏损风险。请务必先在模拟账户上测试,并使用您能接受的风险设置。过往表现不代表未来结果。
FREE

MT5 To Telegram Signal Bridge — Free Utility What it does This Utility ea connects The REVERSION KING Indicator to your Telegram bot or channel in real time. It runs silently on one chart and automatically forwards trading signals, TP hits, and SL events as formatted messages — no manual copy-pasting, no screen watching. Features Sends new signal alerts with entry, TP1, TP2, TP3, SL levels and R:R ratio Sends TP1, TP2, TP3 hit confirmations with points gained Sends SL hit notifications with poin
FREE
Pivot Point Supertrend (corresponds to Pivot Point Super Trend indicator from Trading View) Pivot Point Period: Pivot point defined as highest high and highest low... input 2 = defining highest high and highest low with 2 bars on each side which are lower (for highest high) and are higher (for lowest low calculation) ATR Length : the ATR calculation is based on 10 periods ATR Factor: ATR multiplied by 3
FREE

Golden Delta Library — Free MT5 Tools Market Description Short Description Golden Delta Library is a free MT5 toolkit for traders who want cleaner chart structure, Renko-based context, risk planning, and practical execution panels. Renko EDGE EA Golden Delta | Algo Trading Research
Updates, research and new developments:
https://www.mql5.com/en/channels/golden-delta
What It Does
The collection includes Renko indicators, SuperTrend / ADX Renko variants, XAUUSD helper panels, and RiskLab Trade
FREE

注意:此免費版本只可使用到2026/09/30
交易最怕的不是虧損,而是「方向不明」
為什麼很多交易者會被掃出場?因為他們只看單一時框。本指標透過 AI 降噪技術,將 H1 的穩健與 M15 的靈敏結合,為您打造一個自動化的趨勢過濾網。
「讓數據說話,讓 AI 帶路,您只需負責收穫成果。」本指標在商品行情圖表中顯示H1(圓點)與M15(箭頭)兩個時間段的趨勢方向,其他時間段的計算結果會顯示於下方的曲線圖中。行情的走向、震盪、強度、交易量等請參考Stochastic, MACD, RSI等指標,指標可精準地判斷波段的方向與合適的進出場時機。
指標特色如下:
1. AI 多重時框(MTF)動態演算
本指標搭載 AI 趨勢過濾算法,自動同步 H1 (長期趨勢監測) 與 M15 (精準進場導航)。AI 會自動過濾掉已知趨勢方向中不具備獲利空間的微小波動,確保你始終站在大趨勢的正確一邊並且減少盤整時的心理壓力。
H1 圓點: 您的導航雷達,鎖定大波段方向。
M15 箭頭: 您的開火按鈕,精準捕捉發動瞬間。
2. 雙週期行情圖,一眼看出方向與
FREE

HOW TO USE
Draw a profile: Hold CTRL + Left Click and drag across any area on the chart. Release the mouse to generate the volume profile. Delete last profile: Press the DEL key on your keyboard. Delete specific profile: Click the red button at the top-left corner of any profile. Cancel while drawing: Press ESC to abort a drag in progress. Switch timeframes freely: Profiles persist when switching between timeframes (e.g., 4H → 1H → 15M and back). Change settings live: Open indicator properti
FREE

Golden Range 基于价格区间与交易水平的黄金交易 EA,适用于 XAUUSD H1 Golden Range 是一款结构化的交易机器人(Expert Advisor),基于价格区间与交易水平设计,专为 Gold / XAUUSD 的 H1 时间周期 打造。 该 EA 使用计算出的交易区间、价格水平以及结构化挂单方式进行交易。它并不是为了追逐每一根K线,而是等待价格到达特定区域后再进行交易,同时保持简单、清晰、易于使用的设置方式。 Golden Range 适合希望使用简洁黄金交易 EA 的交易者,提供简单参数、风险模式、点差保护、最大单笔手数控制以及回撤管理。 免费早期版本 Golden Range 目前作为免费早期版本提供给早期用户。 此早期版本旨在让交易者测试 EA、了解其交易行为,并在未来更新前提供真实反馈。 如果您测试 Golden Range 后认为它有帮助,您的 评分、评论、反馈或消息 都将非常宝贵。您的反馈有助于支持开发并改进未来版本。 交易理念 Golden Range 不是为了追逐每一根K线而设计的 。 相反,EA 会等待价格到达计算出的交易区间和价格水平,
FREE

Советник для скальпирования фьючерса BR на ММВБ. Внутридневный, в 23=45 закроет позицию. Работает на 15-ти минутках. По появлению отфильтрованного индикаторами сигнала на покупку/продажу выставляет отложенный ордер. Более короткий вариант таймфрейма выбирать не рекомендую из-за введенных ограничений для переменных в примененных индикаторов. Мартингейл не применён, EA тестирован на ММВБ на срочном рынке и только на фьючерсах BR. Для демонстрации результатов на склейке, параметры дооптимизир
FREE

ChartMarker
is a chart-window indicator for marking up your charts with trend lines and order blocks. You draw directly on the chart with mouse clicks instead of switching MetaTrader drawing tools on and off. ChartMarker keeps markup fast and consistent during review and live trading. One compact panel controls the active tool, visibility, cleanup, and backup. Drawings stay on the chart as standard objects you can still select and adjust in MetaTrader when needed. Main features Trend lines fro
FREE

Solarwind No Repaint是一个技术振荡器,将费舍尔变换应用于标准化价格数据,创建基于直方图的指标来识别潜在的市场转折点。该指标将价格变动转换为高斯正态分布,使周期性模式和动量变化对交易者更加可见。 工作原理 该指标通过几个计算步骤处理价格数据: 高低分析 :计算指定周期内的最高价和最低价 价格标准化 :取每根K线高低价范围的中点,并根据周期范围进行标准化,将数值缩放到-1和+1之间 费舍尔变换应用 :应用数学费舍尔变换公式 0.5 * ln((1+x)/(1-x)) 并进行平滑处理 趋势信号处理 :基于数值变化和动量阈值生成方向性信号 主要特征 直方图显示 :在单独的指标窗口中显示为彩色柱状图 基于趋势的着色 :绿色柱表示看涨动量,红色柱表示看跌动量 无重绘设计 :仅使用已完成的K线以防止当前K线上的信号变化 自适应敏感度 :可配置的阈值系统以过滤市场噪音 信号持续性 :保持趋势方向直到发生显著的动量变化 参数 周期 (Extperiod):用于高低计算的回望周期(默认:10) 信号敏感度 :新信号所需的变化阈值(默认:0.05) 使用完成K线 :通过仅使用完成的K线防
FREE
具有多时间框架支持、可自定义视觉信号和可配置警报系统的OsMA(MACD柱状图)指标。
自由职业编程服务、更新和其他TrueTL产品可在我的 MQL5主页 获取。
非常欢迎您的反馈和评价!
什么是OsMA? OsMA(移动平均振荡器)是MACD与其信号线之间的差值,也称为MACD柱状图。正值表示MACD位于信号线上方(看涨动量),负值表示MACD位于信号线下方(看跌动量)。零线穿越对应MACD/信号穿越,标志着潜在的趋势转变。增长的柱体显示动量增强,缩小的柱体显示动量减弱。 OsMA信号在零线穿越(趋势转变)、OsMA与价格之间出现背离以及检测到柱状图峰谷时生成。该指标帮助交易者高精度地测量动量运动的强度和方向。 功能特点: 带箭头和垂直线的视觉信号标记 三个独立信号缓冲区,具有可配置触发器 信号检测选项:方向变化、级别穿越、峰/谷 每个信号可配置警报(电子邮件、推送、声音、弹出窗口) 具有插值方法的多时间框架(MTF) 柱状图或折线图显示模式 多种颜色模式(单色、基于方向、基于级别) 通过iCustom访问缓冲区,可与专家顾问(EA)集成 输入参数: 基本设置: 快速EMA周期
FREE

Draw On Liquidity (DOL) – PDHL, PWHL & Kill Zones Liquidity levels often act as magnets for price movement. The highs and lows of the previous day (PDHL) and week (PWHL) are key reference points where stop orders and institutional activity tend to cluster. Identifying these levels manually is time-consuming and prone to error. The Draw On Liquidity (DOL) indicator automatically plots these essential levels on your chart and highlights high-probability trading windows through session kill zones.
FREE

Failed Auction — Professional Failed Auction Detection MT5 Version 1.05 The Problem With Volume in CFDs Every serious trader understands that volume is the lifeblood of market analysis. It is the one variable that reveals intention behind price movement. Yet the vast majority of CFD instruments — indices, forex pairs, commodities — operate without access to centralized exchange volume. What brokers provide is tick volume: a raw count of price changes per bar, devoid of directional context. Most
FREE

//+------------------------------------------------------------------+ //| WAHLA GOLD SPEEDOMETER — Product Description (MQL5 Indicator) | //+------------------------------------------------------------------+
/* WAHLA GOLD SPEEDOMETER is a real-time market speed and behavior analytics indicator designed for XAUUSD and fast-moving instruments.
It does not simply show price movement — it interprets market velocity, volatility, and structural behavior in a single unified dashboard.
---
CORE
FREE

If you love this indicator, please leave a positive rating and comment, it will be a source of motivation to help me create more products <3 Key Takeaways Provides both trend and momentum signals in a single view. Entry and exit signals are based on the crossover of the RSI and Signal Line. Market Base Line offers insight into the overall trend direction. Volatility Bands help identify overbought and oversold market conditions.
FREE

ATR Smart Levels – 清晰了解市场可能达到的真实区域 许多交易者亏损并不是因为策略不好,而是因为错误的入场位置: 过早、在区间中间、没有合理的盈亏比结构。 ATR Smart Levels 用一个指标和三个按钮解决这一问题。 指标会自动绘制价格上下的 三个 ATR 目标区间 (TP1、TP2、TP3)。 你可以立即判断入场是否合理,以及是否有足够的波动空间。 ATR Smart Levels 的功能 基于所选周期计算 ATR。 绘制向上的 ATR 目标区。 绘制向下的 ATR 目标区。 显示市场当前的实际波动潜力。 帮助更合理地规划 入场、止损、止盈 。 三个简单按钮 DRAW – 实时生成 ATR 目标区。 FREEZE – 固定当前目标区。 DELETE – 一键删除所有 ATR 线(切换周期后也有效)。 适合的人群 初学者 :需要明确入场区域。 进阶交易者 :将波动性纳入计划。 价格行为交易者。 日内交易者与剥头皮交易者。 波段交易者。 为什么 ATR 目标区有效 ATR 测量 真实市场波动 ,因此这些区域: 客观 数学上合理 适用于所有市场 非常适合交易规划 优
FREE
能量潮(OBV)指标,支持多时间框架,可自定义视觉信号及可配置警报系统。
自由职业编程服务、更新和其他TrueTL产品可在我的 MQL5主页 获取。
非常欢迎您的反馈和评价!
什么是OBV? 能量潮(On Balance Volume)指标由乔·葛兰碧(Joe Granville)开发,基于成交量先于价格的理论。在上涨日加入成交量,在下跌日减去成交量,创建累积成交量指标。价格横盘或下跌时OBV上升表明看涨积累。价格稳定或上涨时OBV下降则预示看跌分发。OBV与价格的背离可能是即将发生趋势变化的强烈领先指标。 OBV信号通过OBV指标的趋势线突破、OBV与价格之间的背离以及OBV平均水平穿越来生成。该指标对于确认趋势强度和检测价格走势的早期信号特别有用。 功能特点: 带箭头和垂直线的视觉信号标记 三个具有可配置触发器的独立信号缓冲区 信号检测选项:方向变化、穿越水平线、峰值/谷值 每个信号的可配置警报功能(邮件、推送、声音、弹窗) 支持插值方法的多时间框架(MTF)功能 柱状图或折线图绘制模式 多种颜色模式(简单、基于方向、基于水平) 通过自定义指标调用(iCustom)访问缓冲区
FREE

GoldRankers - 高级人工智能网格交易系统 SET FILE 6M 标语 凭借尖端人工智能技术,跻身黄金交易精英行列 主要描述 GoldRankers 是一款革命性的AI驱动型智能交易系统,专为资深黄金交易者打造。该系统运用尖端的神经算法分析和基于机器学习的市场情报,代表了新一代XAUUSD自动化交易技术。 为什么选择 GoldRankers? 我们 先进的人工智能技术 利用以下方式处理实时市场动态: 智能电网配置 :基于ATR波动率分析和K线形态识别的AI优化入场点 智能趋势检测 :机器学习算法分析 10M 时间框架的价格走势,以识别高概率的方向性偏差。 自适应风险管理 :基于神经网络的仓位管理,可根据市场波动和账户净值自动调整。 自优化止损 :基于动态人工智能的止损计算,能够从市场状况中学习。 预测性手数调整 :利用人工智能驱动的手数倍增,以强信号确认,最大化高胜算交易的利润 主要特点 先进的人工智能技术栈 量子算法分析 :同时处理多个市场因素,以实现最佳交易执行 基于机器学习的入场信号 :通过学习市场模式来识别最高概率的网格水平 自适应市场情报 :利用人
FREE

FiboEvo FX: Hybrid Fibo & Adaptive Grid Strategy USE ON HEDGE ACCOUNTS ONLY Short Description "Graybox" Expert Advisor specialized in Forex . It combines technical Fibonacci entries, Flow Filters (VWAP/ADX), and an ATR Adaptive Grid system for position recovery. Overview FiboEvo FX was designed for dynamic Forex market conditions. It trades breakouts and Fibonacci retracements in favor of the trend. Its key differentiator is the Auto-Adaptive (ATR) system: instead of using fixed distances for th
FREE
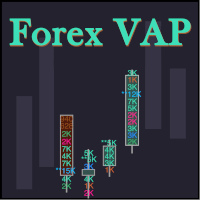
What do you see inside a candle? How to interpret the fight between bulls and bears? The candlestick chart brings a lot of information, but the volume is lacking in the candlestick body. This is where the Forex Volume At Price Expert Advisor comes in. This advisor searches for a set of recent trades, calculates the buy and sell attack volumes and prints on the candles, the volume value in each price range. You can also define up to ten colors to filter volumes and make it easier to
FREE

VTX OMNIBOARD 是一款专为 MetaTrader 5 设计的全功能多品种、多周期趋势监控面板(Dashboard)。基于 Vortex (VTX) 涡流趋势算法与价格动量分析,帮助交易者在单一图表上一眼掌握整个市场的多空结构与强弱变化,无需频繁切换图表。 无论您是剥头皮交易者、波段交易者还是长线交易者,VTX OMNIBOARD 都能将复杂的市场动态转化为直观的趋势方向、动量强度及高胜率反转预警。 核心优势与主要功能 多品种 & 多周期扫描器: 在单个主图上同时监控多个货币对、黄金贵金属或指数在不同周期(M1 至 MN1)的走势。 高精度 Vortex (VTX) 算法: 精确测量正向 (+VI) 与负向 (-VI) 市场涡流动态,提早捕捉新趋势启动,有效过滤震荡噪音。 一键图表直达: 点击面板上的任意品种或周期按钮,立即快速切换当前图表。 全方位智能提醒: 支持趋势金叉死叉与多周期共振(Confluence)实时推送:桌面弹窗、手机 MT5 Push 推送及邮件提醒。 极低资源占用: 代码深度优化,即使同时扫描 20 个以上品种,也不会造成图表卡顿或 CPU 负载过高。
FREE

Imagine a professional system that patiently weaves its web on the currency market, waiting for the perfect moment to strike. Stochastic SpiderNet is an intelligent trading robot (expert advisor) for the MetaTrader 5 platform, created for traders who understand the power of grid trading but want to secure it with powerful protection algorithms. This is not just a "grid trader." It is a symbiosis of the classic Stochastic oscillator and an adaptive grid controlled by artificial constraints. How
FREE
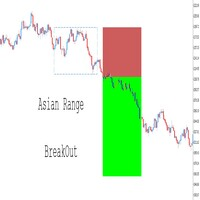
完全可定制 – 通过调整范围时间、颜色、线条样式和风险回报设置,使该指标适应您的个人交易风格。 交易水平可视化 – 根据突破条件自动绘制入场价格、止损 (SL) 和止盈 (TP) 水平。 与智能交易系统 (EAs) 无缝集成 – 通过添加额外的确认信号(如 RSI、均线、结构突破 (BOS) 等)来完全控制您的自动交易策略。您还可以 自定义缓冲区名称 ,以匹配您的 EA 需求,从而实现更大的策略灵活性。 多资产 & 多时间框架回测 – 在 外汇货币对、加密货币及其他交易工具 上测试不同配置,找到最适合您的交易策略的设置。 清晰简洁的界面 – 以非干扰性的显示方式关注价格走势,使交易信号更易于理解。 该指标为交易者提供了 突破策略的坚实基础 ,但其真正的优势在于灵活性。您可以 修改和增强 它,结合额外的指标或逻辑,以适应您的独特交易方法。 试用、回测,并优化它,以匹配您的个性化交易策略! 立即在 MQL5 上获取完整版,让您的交易更进一步!
FREE
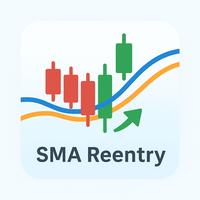
什么是 SMA Reentry SMA Reentry 是一款专业指标,通过两条简单移动平均线(SMA),一条快线和一条慢线,提示顺势重新入场的关键点。该指标能够清晰地显示价格在慢速SMA定义的趋势下,何时重新回到快速SMA之上或之下。非常适合需要明确回调(pullback)、突破(breakout)和趋势回归信号的交易者。 工作原理 通过快慢SMA交叉识别主要趋势。 明确标记回调与重新入场信号,每当价格回到快速SMA之上(或之下)时显示箭头,确认趋势延续。 提供周期、线条和箭头颜色、箭头与价格距离等可自定义输入。 直接在图表上显示两条SMA,便于可视化分析。 适用对象 采用趋势跟随策略或想优化回调入场点的交易者。 突破与趋势回归策略用户。 需要捕捉价格在修正后恢复趋势关键点的交易者。 适合主观和系统化交易者。 主要特性 明确的趋势跟随入场信号。 简单且完全可定制的配置。 图表直观显示两条移动平均线。 直观箭头提示重新入场信号。 适用于所有时间周期和金融品种。 推荐搭配 提升你的交易策略,推荐搭配以下指标使用:
Candlestick Pattern Analyzer: https:/
FREE

Советник основанный на сигналах индикатора Relative Strength Index (RSI) и Stochastic в зоне перекупленности - продаем, в перепроданности - покупаем. Я рекомендую использовать этот советник только на VPS. Добавляйтесь в друзья, присылайте свои интересные стратегии. Возможно после обсуждения всех нюансов напишу советника бесплатно . Параметры: "_Slippage" - Проскальзывание; "_ Magic" - Идентификатор ордера;
FREE

产品概述 Grok Z-Score 是一款基于严谨数学统计学——**“均值回归”**原理开发的自动化交易系统。它通过高频监控两个具有强相关性的交易品种,利用标准差(Z-Score)算法精准计算价格偏离度。当两个品种的价格走势出现非理性偏离时,EA 自动进场对冲;当价格回归常态(均值)时,获利了结。 核心卖点 纯数学驱动逻辑 :实时计算标准差偏离,不依赖任何滞后指标,完全基于价格分布的统计概率捕捉交易机会。 独立网格修复系统 :本 EA 的核心特色。两个品种拥有互不干扰的独立加仓逻辑,根据各自的盈亏状态进行动态管理。在控制整体风险的同时,极大提升了极端行情下的回撤修复能力。 净利润算法(含佣金) :止盈算法已内置实时佣金与库存费扣除。仪表盘显示的“Total Profit”即为扣除交易成本后的 纯利润 ,确保所见即所得。 可视化监控面板 :内置深色专业仪表盘,实时监控: 实时 Z-Score 与目标阈值的对比(仅在新蜡烛图产生时更新采样)。 入场 Z 值锁定,方便分析每一波行情。 各品种的独立层数(Comment 记录为 Grid X level)、手数、盈亏及账户实时净值回撤。 合规
FREE

Donchian曙光趋势突破系统
我的其他产品: https://www.mql5.com/zh/users/bitksk/seller 一、它解决什么问题 手动识别趋势突破往往依赖主观判断,缺乏一致性。本指标将唐奇安通道的突破逻辑程序化、可视化,解决三个核心问题: 信号标准化 :价格突破动态通道上下轨时,自动产生箭头信号,消除主观臆测。 持仓管理可视化 :以矩形色块标注当前趋势的运行边界,让止损和目标位一目了然。 策略复盘数据化 :自动记录每一次模拟交易的入场点、出场点和盈亏结果,并汇总统计胜率和盈亏比,让你无需手动回测即可评估策略表现。 二、适合什么人 正在寻找一套 规则明确、可复现的趋势跟踪策略 的交易者 希望 减少对主观判断的依赖 ,用客观信号辅助决策的技术分析用户 需要对 现有策略进行趋势方向过滤 ,避免逆势操作的交易者 习惯了唐奇安通道、海龟交易法则等突破类策略,希望获得MT5现代化实现的用户 追求图表简洁, 不希望同时加载多个指标 造成视觉混乱的用户 三、使用场景 场景 说明 趋势市 通道扩张、价格持续运行在通道一侧时表现最佳 突破确认 盘整后首次突破通道边界,信号可靠性
FREE

DCA Master — Automated Dollar Cost Averaging for MT5
Important: This EA is designed for swap-free accounts or accounts with no overnight fees. Holding positions for weeks or months on standard accounts will result in significant swap costs that reduce your returns.
This is a long-term investment tool, not a trading bot. It does not speculate, scalp, or chase short-term moves. It buys at regular intervals and holds.
WHAT IT DOES
FREE

Monte Carlo Equity Projection (蒙特卡洛权益预测)基于您账户自身的历史平仓交易运行自助法(bootstrap)模拟,并直接在图表上绘制未来权益路径的百分位锥形区间——无需假设收益分布,也无需外部数据源。 将其附加到任意图表后,指标通过原生 MT5 API 读取账户的真实平仓交易记录,进行数千次有放回重采样,绘制出当前统计特征所隐含的真实结果区间,而非固定的回测曲线。所有计算均在本地完成:不连接外部服务器,不使用 WebRequest,也无需联网权限。 为何采用重采样而非单一回测 一份回测报告只展示一条路径:事情发生的经过及顺序。它无法展示如果同样的交易以不同顺序出现会怎样,也无法显示结果在多大程度上依赖于少数几笔极端的盈利或亏损。自助法重采样直接解决了这个问题:将同一批平仓交易反复打乱重排数千次,生成一组可能的权益曲线分布,而不是单一曲线。这个分布的宽度——而不仅仅是其中位数——才能说明某项优势在统计上是否足够稳健以支持加大仓位,还是当前的交易记录尚且太少或运气成分太重,尚不足以下结论。 方法论 模拟器对已平仓交易进行有放回抽样(自助法重采样——不假设任何
FREE

Deriv Synthetic Indices Symbol Changer Developed by Tshepo David The Symbol Changer for Deriv Synthetic Indices is a professional utility designed for MetaTrader 5 (MT5) to streamline your market analysis. Instead of manually dragging symbols from the Market Watch or right-clicking to change timeframes, this tool places a sleek, interactive dashboard directly on your chart. It is specifically pre-configured for synthetic indices (Step Index, Jump Index, and Volatility Index), but it is fully c
FREE

FTU Moving Average Alert mt5
Alert for price touch and close of moving average Any moving average type Alert sound file option Alert on touch or close over
Usage : Attach indicator from market folder, change type of moving average, style etc
Set alert type
Note: sound folder location is within appdata folder see image, copy wav file into this folder, then change file name within input eg: news.wav / chime.wav / 'anysound'.wav
FREE

Flash Alert 是一款面向短线与剥头皮交易者的实时行情监控与预警工具。它持续监测市场的快速价格变化,自动识别 暴跌、暴涨以及暴跌/暴涨后的反转 ,并在市场出现关键异动时及时提醒交易者,支持多种提醒方式。 Flash Alert 也是 XAUUSD M1 Snipion 短线双向交易 EA 的核心辅助工具 ,但本身可以用于任何交易品种,例如: XAUUSD、XAUUSD247、Gold、EURUSD、GBPUSD、USDJPY 等。 Flash Alert 适合谁? Flash Alert 特别适合 短线/超短线/剥头皮交易者 。 在超短线交易中,市场可能在几秒或几十秒内快速移动。普通价格观察往往难以及时发现这些异常波动,而 Flash Alert 会持续分析 M1 ATR 与实时价格变化,在达到设定条件时立即发出提醒。 它可以作为交易者的实时行情预警核心,帮助交易者更快发现市场变化,发现可能影响交易决策的暴涨、暴跌和反转行情,并及时做出判断。 参数列表 Detection Settings / 检测设置 Sudden move threshold (ATR multiplier
FREE

CM Ultimate MA MTF V2 Triple 是一款高性能多时间框架 (MTF) 移动平均线指标,专为 MetaTrader 5 平台设计。它在同一图表上绘制三条独立的移动平均线(短线、中线、长线),每条线都基于动量变化呈现动态的三色趋势可视化效果。
通过计算上下斜率的变化,该指标帮助交易者识别趋势方向,并过滤市场噪音,从而实现快速执行。
主要技术优势
6 缓冲区动态颜色逻辑:采用 6 个严格的指标缓冲区,可无缝跟踪数值和颜色索引。三条线会立即改变颜色,分别代表看涨、看跌或中性/动量持稳状态。
视觉层级布局:优化的线宽设计带来直观的心理感知:
MA 1(短线):宽度 4(实线)——对当前价格变化高度敏感,可快速识别入场信号。
MA 2(中线):宽度 2(实线)——作为动态支撑/阻力锚线。
MA 3(长线):宽度 1(实线)——代表宏观趋势和整体市场倾向的最终基准。
高级多时间框架支持:将更高时间框架的数据(例如 H4 或 D1)直接叠加到当前较低时间框架的图表(例如 M5 或 M15)上,以追踪主导的机构趋势。
4 种多功能移动平均线类型:原生支持简单移
FREE

Description: This utility automates Take Profit (TP) and Stop Loss (SL) levels for your trades, calculated in % of Balance. Example : if you type 1, it means 1% of your Balance . It ensures consistent risk management for all your positions. Crucial Note for Manual Traders: If you intend to use this utility on trades opened manually (without an Expert Advisor), you must change the 'Magic Number' setting to 0 (zero) . This allows the utility to correctly identify and manage your manual orders.
FREE
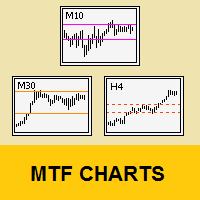
Tool that allows viewing more than one timetime in the same window (up to 3 timeframes). Then, the tool helps the analysis in multiple timesframes.
This is another product developed by Renato Fiche Junior and available to all MetaTrader 5 users!
Input Parameters
- Timeframes 1, 2 and 3: Timeframes of sub-charts
- Show Dates: Shows the dates on the sub-charts on the X-axis (Yes / No)
- Show Prices: Shows on the Y-axis the prices in the sub-charts (Yes / No)
- Show Subwindow: Shows the s
FREE

Introducing Nitro Scalp the premier institutional grade trading solution engineered specifically for XAUUSD Nitro Scalp represents a significant leap in automated trading technology by combining multi timeframe trend analysis with micro momentum precision. At its core Nitro Scalp is built on a triple layer filtration system designed to eliminate the common pitfalls of automated trading. Unlike standard expert advisors that struggle during market consolidation Nitro Scalp utilizes an advanced AD
FREE

MTF RSI Fusion Basic MTF RSI Fusion 是一款多时间框架 RSI 振荡器,旨在将多个 RSI 计算结果整合到一个结构化指标中,用于分析市场动量。 该指标并非依赖单一 RSI 数据源,而是可以将最多三个不同时间框架的 RSI 数据融合为一条 “Fusion RSI” 线。同时还可在同一系统中启用自适应超买超卖区域、趋势偏向显示、背离检测、信号生成以及可选 VWAP 过滤等功能。 该指标旨在将动量分析、趋势分析与确认工具整合到一个工作流程中,同时保持图表结构清晰。 Main Features 多时间框架 RSI Fusion 引擎 最多三个独立 RSI 数据源 每个 RSI 可独立设置时间框架、周期和权重 多种 Fusion 与 Combine 模式 自适应超买超卖区域 基于 ATR 的动态波动率调整 趋势偏向着色 高时间框架 K 线趋势分析 移动平均线斜率分析 多头与空头背离检测 买卖信号系统 可选 VWAP 振荡器 可选 VWAP 信号过滤 主图背离绘制 主图信号绘制 性能与图形管理控制 Multi-Timeframe RSI Fusion Engine
FREE

This indicator is especially for the binary trading. Time frame is 1 minutes and exp time 5 or 3 minutes only. You must be use martingale 3 step. So you must put lots size is 10 % at most. You should use Mt2 trading platform to connect with my indicator to get more signal without human working. This indicator wining rate is over 80% but you may get 100% of profit by using martingale 3 step. You should use MT2 Trading Platform to connect meta trader platform and binary platform . You can get mt2
FREE

Gold Squeeze Trapper EA Gold Squeeze Trapper is a premium, fully automated Expert Advisor designed exclusively for trading Gold (XAUUSD)(H1). Built on advanced market volatility analysis and pure price action, it is engineered to capture high-probability market movements efficiently. Designed with capital protection in mind, this EA operates purely on logic and strict risk management, completely avoiding toxic or dangerous trading methods. It is a "Plug and Play" system with a highly simplified
FREE

XAU Turn of Month D1 Expert Advisor for MetaTrader 5 — Gold / XAUUSD focus
Version: 1.00 What it is XAU Turn of Month D1 is an Expert Advisor for gold on the D1 chart. It focuses on structured participation around the turn-of-month calendar rhythm — a low-frequency calendar-window style, not a high-churn scalper. Built for structured automated participation — not grid , not martingale . Evaluate on demo with your broker's spreads and your own risk profile. This product is a technical calendar s
FREE

XAU Structure Pullback H1 Expert Advisor for MetaTrader 5 — Gold / XAUUSD focus
Version: 1.00 What it is XAU Structure Pullback H1 is an Expert Advisor for gold on the H1 chart. Architecture is simple and deliberate: Impulse — a clear directional displacement is identified on structure. Pullback band — price retraces into a mapped structure participation band. Continue — the system joins the continuing direction with selectable exit style. Built for structured automated participation — not grid
FREE

是否厌倦了复杂的指标,尤其是在交易波动剧烈的黄金市场时?EasyTrend Gold MT5 指标专为驾驭黄金在任何时间周期上的波动性而设计。它利用 ATR (平均真实波幅) 的力量,将黄金的剧烈波动转化为一条清晰、动态且能过滤市场噪音的趋势线。 无论您是在 M1 周期上进行剥头皮交易,还是在 H4 周期上进行波段交易,您都可以直观地看到趋势的方向和强度,轻松识别盘整期,并获得关于何时对 XAU/USD 采取行动的直观洞察。 其他推荐资产 虽然 EasyTrend 针对黄金等高波动性资产进行了优化,但其逻辑在众多以强劲趋势著称的市场中同样非常有效: 主要外汇对: EUR/USD, GBP/USD, USD/JPY 股票指数: US500 (标准普尔500指数), US100 (纳斯达克100指数), GER30 (德国DAX指数) 加密货币: BTC/USD (比特币), ETH/USD (以太坊) 大宗商品: WTI/USOIL (原油) 1. 策略:指标的实际运作方式 EasyTrend 是一款趋势跟踪指标,它使用平均真实波幅 (ATR) 来创建一条能够适应市场波动
FREE
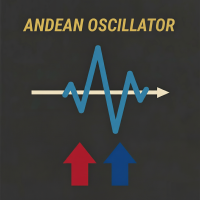
Andean Oscillator – 趋势变动振荡器 清晰显示市场的强弱和方向。 Andean Oscillator 是一个 高级振荡器 ,通过其主要组件测量每个资产的上涨和下跌变化: Bull(多头) 、 Bear(空头) ,以及用于过滤虚假信号并确认趋势的 Signal Line 。 利用 指数通道 和移动平均线,Andean Oscillator 提供了清晰、稳定的趋势强度及变化视图,帮助您获得交易优势。 主要特征 Bull 和 Bear 组件: 反映价格的上涨和下跌变化。 信号线: 过滤虚假信号并确认趋势。 简单解释: 多头组件高于空头 → 上升趋势;空头组件高于多头 → 下降趋势。 反应灵敏的振荡器: 基于指数通道和移动平均线计算,实现最大灵敏度。 兼容所有资产和时间周期。 使用方法 趋势识别: Bull > Bear → 市场上升,Bear > Bull → 市场下降。 入场确认: 组件与 Signal Line 的交叉。 过滤虚假信号: 等待 Bull/Bear 在 Signal Line 上方交叉。 实用示例 如果 Bull 组件穿过 Bear 并保持在 Signal
FREE

Phoenix Engine — Hybrid Advanced SMC • Liquidity • Multi-Timeframe Trading EA for MT5 Phoenix Engine — Hybrid is an automated and semi-automated trading system combining Smart Money Concepts, liquidity analysis, multi-timeframe market structure, Phoenix confirmation scoring, dynamic risk management, adaptive trade protection, and direct manual execution controls . Core Trading Engine Phoenix SMC Engine Multi-Timeframe Market Structure H4 / H1 / M15 / M5 Market Analysis Advanced Market Bias & Dir
FREE
Native Session Volume Splits traded volume by trading session: Asia, London, the London/New York overlap, New York, and everything outside those windows. Free tools that show session times only paint a coloured box on the chart. None of them tell you how much volume actually happened inside each session, because MetaTrader 4 never had real volume at all. MetaTrader 5 does, and this indicator uses it.
WHAT IT SHOWS
A histogram in a sub-window, one bar per candle, coloured by the session it fal
FREE
Advanced Dynamic RSI The **Advanced Dynamic RSI** indicator builds on the classic Relative Strength Index (RSI) developed by J. Welles Wilder. It incorporates volatility-adaptive overbought and oversold levels using moving averages and standard deviation calculations. This adaptation helps the levels adjust to current market conditions, offering a more responsive oscillator compared to fixed thresholds. The indicator is suitable for various instruments and timeframes, supporting analysis in diff
FREE

top finder, bottom finder, market structure, price action, trend reversal, trend continuation, support resistance, swing high, swing low, frequency analysis, price projection, breakout detection, pullback trading, swing trading, market turning points
EXPERIMENTAL VERSION – UNDER ACTIVE DEVELOPMENT
Smart Top Bottom Finder is a market structure and frequency analysis indicator designed to identify potential tops and bottoms based on recurring price movement patterns. The indicator does not rely
FREE

The Weis Wave first takes the market volume and then organizes it with the price into Wave charts. It is the only software that will present the true picture of the market before you. If anyone of you, has watched an intraday price movement then you must know that it unfolds in a series of selling as well as buying waves-a procedures tearing down and building up. Wave analysis is an integral part of the trading method. The indicator helps to deal with today’s volatile market. Moreover, it works
FREE

LAUNCH PRICE (When it reaches the top of downloads, the price will go up) Take advantage of this opportunity. Description Vivo GOLDm# is a solid and versatile Expert Advisor, designed for traders who seek a clear strategy, discipline, and integrated risk management. Its main goal is to help operate in the gold market (XAU/USD), an asset known for its high volatility, by providing a structured approach that reduces improvisation and improves consistency in decision-making.
This EA is especially t
FREE

EMA Multi Timeframe (MTF) – MT5 Indicator Description: The EMA Multi Timeframe (MTF) indicator for MT5 allows you to display an Exponential Moving Average (EMA) from a higher (or lower) timeframe directly on your current chart. Example: You can see the Daily (D1) EMA 9 plotted directly on your H1 chart, or even on an M5 chart, helping you align your entries with higher timeframe trends without switching between charts. Key Features: Display EMA from selectable timeframes (M1, M5, M15, M30, H1
FREE

Simple Trade Utility Join the Group Chat - Community Group Need an indicator? Check out ZeroLag T3 Signal Suite The Simple Trade Utility is designed to make trading straightforward and efficient , without unnecessary complexity. This tool provides a clean, easy-to-use panel that simplifies the process of placing and managing trades. It focuses on essential functions traders use every day —nothing more, nothing less. Despite its simplicity, it offers powerful features such as: Trailing stop Part
FREE

Tillson's T3 moving average was introduced to the world of technical analysis in the article ''A Better Moving Average'', published in the American magazine Technical Analysis of Stock Commodities. Developed by Tim Tillson, analysts and traders of futures markets soon became fascinated with this technique that smoothes the price series while decreasing the lag (lag) typical of trend-following systems.
FREE

News Radar Pro transforms MT5’s built-in economic calendar into a live, on-chart trading tool. View upcoming macroeconomic events directly on your chart with impact-based filtering, countdown timers, and intelligent alerts, all in your chosen timezone. No external websites, APIs, or data feeds required. How It Works Economic Calendar Integration
Access MT5’s global economic events database directly on your chart. Event Filtering
Filter economic events by impact level (High, Medium, Low) and cu
FREE

Moving Average Convergence/Divergence — схождение/расхождение скользящих средних — технический индикатор, разработанный Джеральдом Аппелем (Gerald Appel), используемый в техническом анализе для проверки силы и направления тренда, а также определения разворотных точек. Встроенный в MetaTrader 5 индикатор MACD не соответствует задумке автора (Gerald Appel):
-линия MACD графически изображена в виде гистограммы, однако гистограммой отражается разница между линией MACD и сигнальной линией;
-сигнальн
FREE

受到2016年(05月份)ICT私人辅导课程在YouTube上的启发,我们的创新工具赋予交易者精准驾驭市场的能力。通过标记60、40和20天的周期,它有助于识别重要的市场变动,借鉴了ICT传授的智慧。 这个指标真正与众不同的地方在于它的前瞻能力,这一特点基于对历史数据的深入分析,提供宝贵的未来市场行为洞察。这种前瞻性方法赋予交易者做出明智决策所需的远见,为他们在当今充满活力的交易环境中提供了独特的优势。 此外,我们的指标提供了定制选项,允许交易者根据自己的特定偏好和交易策略进行调整。凭借这种高度的适应性,交易者可以自信地预测市场趋势,利用ICT的教导保持领先地位,并抓住有利可图的机会。 体验我们的指标的前瞻性和定制化能力,开始一段旅程,提升您的交易技能,实现您的财务目标
FREE
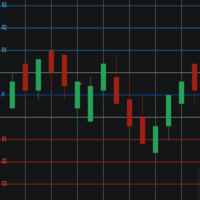
Pivot Points Levels Description The Pivot Points Levels indicator is an advanced and comprehensive tool for technical analysis based on support and resistance levels calculated from pivot points. This free indicator combines 6 different calculation methods with support for multiple timeframes, offering a robust solution for identifying key price reversal and continuation areas. Key Features 6 Calculation Methods : Traditional, Fibonacci, Woodie, Classic, DeMark (DM), and Camarilla Multi-Timefram
FREE
MetaTrader市场是独有的自动交易和技术指标商店。
阅读MQL5.community用户备忘更多地了解我们提供给交易者的独特的服务:复制交易信号,自由职业者开发的自定义应用程序,通过支付系统完成的自动付款和MQL5云网络。
