 MetaTrader 5
 专家
 指标
 程序库
 实用工具
 窗口小部件
 规则
适用于MetaTrader 5的免费EA交易和指标 - 26
 使用EA交易和指标,使外汇交易获得更多盈利。EA交易可使您自动开启和关闭交易,而指标将帮助您更准确地预测市场行为。
该页面提供MetaTrader 5应用程序的目录。

Master PSAR for MetaTrader 5 说明 Master PSAR 是一款为 MetaTrader 5 开发的技术指标,基于 J. Welles Wilder 创建的经典 Parabolic SAR 方法。 该指标根据 Parabolic SAR 公式计算出的方向状态,在价格上方或下方显示动态点。 当计算状态为看涨时,PSAR 点显示在价格下方。当计算状态为看跌时,PSAR 点显示在价格上方。 趋势分析 Master PSAR 使用 Parabolic SAR 计算中的加速因子和极值价格来跟踪价格方向的变化。 随着方向性运动持续,加速因子可以逐步增加,直到达到设定的最大值。这使 PSAR 点可以随着价格运动的发展逐步调整。 当价格穿越计算得到的 SAR 水平时,指标会改变方向状态,并在价格的另一侧开始新的 PSAR 序列。 视觉显示 看涨状态下的 PSAR 点显示为浅蓝色。看跌状态下的 PSAR 点显示为红色。 点的位置和颜色用于直观表示指标计算出的方向状态。该指标不会执行交易,也不会创建自动订单。 Score 和 State 除了图表上的 PSAR 点之外,Mas
FREE

Hi-Lo is an indicator whose purpose is to more precisely assist the trends of a given asset - thus indicating the possible best time to buy or sell.
What is Hi-lo?
Hi-Lo is a term derived from English, where Hi is linked to the word High and Lo to the word Low. It is a trend indicator used to assess asset trading in the financial market.
Therefore, its use is given to identify whether a particular asset is showing an upward or downward trend in value. In this way, Hi-Lo Activator can be tran
FREE

一款免费的 MetaTrader 5 一篮子平仓工具。如果你在跑网格、做对冲,或者围绕同一个想法持有好几笔单子,你在意的是整篮子的合计,而不是单张票。把它挂到图表上、设好合计目标,一旦持仓加起来达到这个数,它就 全部 一次性平掉。它不开仓,也不发信号。 它做什么 到达目标就平掉整篮子。 当你持仓的合计结果达到目标时,它会一次性把它们一起平掉。 可选的亏损上限。 设一个合计亏损额,合计结果跌到那里时它就把整篮子平掉,相当于给整篮子设一个简单的止损。 平仓会做到底。 一旦触发目标,它会清掉整篮子并一直盯着,直到每一笔都平掉,所以经纪商一时的拒单绝不会留下一笔落单的还开着。 目标用你习惯的单位 账户货币 的固定金额。 余额的百分比 ,或者 净值的百分比。 合计按整篮子的浮动盈亏计算,含隔夜利息(也可以把它排除在外)。 哪些单子算在篮子里 只管本图表的品种,或者所有品种。 一个开关。 按幻数筛选,或者全部。 只盯某一个智能交易系统的单子,或者留在 0,把账户里所有持仓都算进去,包括你手动下的单。 只买单、只卖单,或者两者。 为安全而设计 读数不对时它不动。 它会等到账户
FREE

VWAP Volume Profile Pro 专业市场结构分析工具 VWAP Volume Profile Pro 是一款专业级市场分析指标,将 VWAP(成交量加权平均价) 、 Volume Profile(成交量分布) 、 Point of Control (POC) 、 Value Area High (VAH) 和 Value Area Low (VAL) 集成于一个强大的分析工具中。 该指标基于成交量分布与市场公平价格(Fair Value)进行客观的市场结构分析,帮助交易者识别关键支撑与阻力位、主力资金成交区域、买卖双方力量平衡,并寻找高概率交易机会。 适用于: 外汇(Forex) 差价合约(CFD) 股票 指数 期货 贵金属 原油 加密货币 为什么选择 VWAP Volume Profile Pro? 大多数交易者需要分别使用 VWAP 和 Volume Profile 两种工具进行分析。 VWAP Volume Profile Pro 将二者完美结合,让您能够同时分析: 市场公平价格(Fair Value) 成交量分布 主力资金关注区域 市场平衡状态 关键支撑与阻力位
FREE

" Outro " is an expert in automated " multi-symbol " trading that requires the trader to test on the pair of his choice and modify the entries according to his convenience. This Expert Advisor has been designed with non-optimized inputs, and uses a Martingale system for risk management. It is very important to read the blog post before you start. Enter to the private group . Outro uses two main indicators, Relative Strength Index and Stochastic Oscillator , for input decision making
FREE

概述 Yen Range Breakout是面向USDJPY和GBPJPY的H1区间突破型EA。它构建亚洲时段的价格区间,当确认该时段结束的那根K线收盘在区间之外时,顺着突破方向入场。只有当区间相对近期日线波动足够宽时才会交易。每个品种只持有一个仓位,使用固定止损和止盈。无马丁格尔,无网格,无加仓摊平。
工作方式 1. EA自行将纽约时间换算为经纪商的服务器时间(自动检测GMT偏移以及美国/欧洲夏令时),因此在任何经纪商、一年四季都使用同一根K线。 2. 确认K线收盘后,EA将其收盘价与之前亚洲时段K线的最高价/最低价进行比较。 3. 收盘价高于区间则买入,低于区间则卖出。订单在K线收盘后立即以市价发送。EA从不使用未收盘的K线,因此没有重绘,也没有未来函数。 4. 区间宽度过滤:当亚洲时段的区间相对于最近一根已完成日线的ATR较窄时,跳过当天的交易。 5. 固定止损和止盈以实际入场价为基准设置。止损位会遵守经纪商的最小距离。
每个品种同一时间只持有一个仓位。每根新K线只做一次判断。
主要特点 - 基于已确认K线的逻辑:无重绘,无未来函数 - 自动转换服务器时间,包括夏令时切换
FREE

以周开盘价作为偏向线,并在周偏向方向上交易该线的拒绝形态。 工作原理 EA 在信号时间周期(默认 H1)的每根已收盘K线上评估一次规则,因此信号不会重绘,测试器与实时图表上的逻辑完全一致。当形态出现且该品种上没有本 EA 的持仓时,它会开立一笔带有止损和目标的市价单。 主要功能 基于风险的手数计算(按余额百分比),带最大手数上限和可用预付款检查 基于 ATR 的止损,带最大距离限制,目标为止损的倍数 基于 ATR 的保本和追踪止损 交易之间的最少K线数 每次仅一个持仓,无网格,无马丁格尔,无加仓摊平 每笔交易都带有 SL 和 TP 图表上的小型状态面板 推荐 主要外汇货币对、XAUUSD 和指数。信号时间周期默认为 H1;可在输入参数中更改。 输入参数 风险管理: 每笔交易风险(余额的 %),最大手数上限,魔术号。 信号: 信号时间周期,价格须接近周开盘价的距离(x ATR)。 止损与目标: ATR 周期,默认 SL 距离(x ATR),最大 SL 距离(x ATR,0 = 关闭),TP 为 SL 距离的倍数。 交易管理: 保本触发(x ATR,0 = 关闭),ATR 追踪距离(x A
FREE

Trading Session Zones Alert is a free visual session indicator for MetaTrader 5. It highlights the major trading sessions directly on the chart so traders can quickly see how price moved during each session and where session ranges overlap.
The indicator draws clear session zones and time labels for: - Sydney - Tokyo - Frankfurt - London - New York
Each session can display its own colored zone, label, and optional high/low lines. The session labels show the active time window on the chart, ma
FREE

Overview Auto Fibonacci EA is a professional trading tool designed to automatically detect swing points and draw Fibonacci retracement levels on your charts. This indicator helps traders identify potential support and resistance zones based on the golden ratio principles. Key Features Automatic Swing Detection Intelligent algorithm identifies swing high and swing low points automatically Customizable swing detection sensitivity (SwingBars parameter) Works on all timeframes: M1, M5, M15, M30, H1
FREE

Adaptive RSI Supertrend Is your RSI telling you one thing while price action tells you another? Tired of switching between multiple indicators just to understand the trend? Adaptive RSI Supertrend — A Trend and Momentum Analysis Indicator for MetaTrader 5 Markets don't always move in straight lines, and momentum alone doesn't always tell the full story. Adaptive RSI Supertrend is a technical analysis indicator for MetaTrader 5 (MT5) designed to help traders evaluate market direction, RSI moment
FREE

自适应斐波那契追踪系统 (AFT) 自适应斐波那契追踪系统 (AFT) 是一款专为 MT5 和 TradingView 设计的高级非重绘(non-repainting)趋势 shadow 指标。 它结合了自适应斐波那契结构、 智能移动止损(trailing)逻辑和基于波动率 junction 的确认, 旨在帮助交易者捕捉高概率的买入(BUY)和卖出(SELL)机会。 与传统的移动止损指标不同, AFT 通过将市场结构分析、 ATR 波动率过滤、 ADX 趋势强度检测以及斐波那契回调位融为一体, 构建出一套专业的交易系统, 从而能够针对不断变化的市场环境做出动态调整。 该指标专为外汇、 黄金 (XAUUSD)、 股指、 大宗商品和加密货币市场设计, 提供更干净的入场信号、 更强有力的趋势确认、 动态移动支撑/阻力、 实时警报以及内置的风险管理功能(自动绘制止损位 Stop Loss 和 TP1/TP2/TP3 目标 trade )。 无论您是高频头寸持有人(黄牛/scalper)、 日内交易者还是波段交易者, AFT 都能帮助您在所有主要时间周期内提高趋势准确性、 减少市场噪音并更高效地
FREE

English — Product description Explore how market activity is distributed across price levels within a selected range. Arixis Fixed Range Profile allows MetaTrader 5 users to select a specific chart region and visualize its horizontal activity distribution. The indicator calculates and displays a profile with key reference levels. Key features Interactive fixed-range selection. Horizontal activity histogram. Point of Control (POC). Value Area High (VAH) and Value Area Low (VAL). High Volume Nodes
FREE
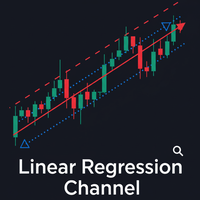
The Linear Regression Channel is a powerful technical analysis tool that helps visually identify the prevailing trend and potential price zones. Essentially, the indicator performs two main functions: It draws a trendline through the center of price action over a specified period. This line is calculated using the linear regression method, which results in the best possible "line of best fit" for the price data. From this center line, the indicator plots two parallel lines above and below, creat
FREE

UT Bot Gold ATR Trailing Stop MT5
Free MT5 port of the well known UT Bot Alerts indicator, tuned for gold (XAUUSD) on M15. Buy and sell signals from an ATR trailing stop, with alerts.
Original Pine Script by Yo_adriiiiaan, core idea by HPotter, alerts version by QuantNomad. The algorithm is public and this port is free.
WHAT IT DOES
An adaptive trailing stop follows price at a distance set by the Average True Range. When price crosses the stop line, the indicator prints a buy or sell arrow
FREE

Divergence Scanner Multi Oscillator 同时在十个振荡器上搜索常规背离(regular divergence)和隐藏背离(hidden divergence),并标记出多个振荡器同时出现背离的K线。您无需在多个窗口中分别观察 RSI、MACD 和 Stochastic,本指标会在每根K线上扫描全部振荡器,并在图表上标注出现背离的振荡器名称,让共振情况一目了然。
扫描范围涵盖 MACD、MACD Histogram、RSI、Stochastic、CCI、Momentum、OBV、VWMACD、CMF(Chaikin Money Flow)和 MFI(Money Flow Index),还可读取您自选的外部自定义指标。每个振荡器都有独立开关,因此您可以只保留自己实际使用的那些。可搜索常规背离、隐藏背离或两者,而 Minimum Indicators in Agreement(最少共振指标数)参数会要求同一根K线上有设定数量的振荡器同时背离才绘制,从而过滤掉孤立信号。
背离以已确认的枢轴高低点(pivot high/low)为锚点。Pivot Perio
FREE

New MT5 gold EA released: RealCostXauBasketQualityMT5.
Built for XAUUSD-ECN / XAUUSD / GOLD M1, with session-based entries, EMA/RSI/ATR filters, capital-adaptive lot sizing, basket exits, spread filtering and drawdown controls.
Best for ECN / RAW low-spread gold accounts. Broker conditions matter, so real-tick backtest and demo forward test are recommended before live use.
Product page: https://www.mql5.com/en/market/product/183919
RealCost Xau Session Lite Free is a free MetaTrader 5 Expe
FREE

Volume Profile Delta — Indicator for MetaTrader 5 Volume Profile Delta is an indicator that displays the difference between buying volume and selling volume recorded on each bar, represented as a histogram at the bottom of the chart. What this indicator does On each bar it calculates the difference between the volume associated with upward movements and the volume associated with downward movements. The result is shown as a bar in the lower histogram, making it possible to observe whether buying
FREE

Apex Point
is a trend-following indicator for MetaTrader 5, transforming complex market data into signals for traders. It displays blue dots for uptrends, red dots for downtrends, and yellow crosses at potential reversals, helping users identify momentum shifts quickly. Key features include a confirmation system requiring multiple bars (default: 3) to validate changes, reducing false signals; dynamic ATR-based offsets for adaptive trailing, with instant ratcheting in the trend direction and smo
FREE

BKT Pro Tooco 一款适用于 MetaTrader 5 的多方法支撑阻力工具,使用四种可选检测算法实时识别摆动区间,已确认信号不重绘。 BKT Pro Tooco 是一款面向 MetaTrader 5 的支撑与阻力指标,专为需要在多种市场结构中可靠识别区间的交易者而设计。该指标提供四种独立的检测方法,允许交易者根据自己偏好的交易风格选择算法:基于枢轴的结构分析、唐奇安通道反转、连续K线序列,或 ZigZag 摆动识别。所有已确认区间均基于已收盘的K线计算,不会重绘。 概述 该指标扫描历史价格行为和当前K线,以定位重要的摆动高点和摆动低点。当识别到摆动点时,系统使用基于 ATR 的深度计算构建对应的支撑或阻力区间。区间宽度由两个参数决定:一个控制区间主体,另一个为可配置的突破缓冲区,使交易者能够控制区间对价格短暂突破边界的敏感程度。 每个区间持续追踪价格互动情况。指标记录价格进入区间的次数、已确认扫盘次数(价格短暂突破边界后收盘回到区间内),以及区间内的累计成交量。当价格收盘突破区间边界时,该区间被标记为已测试,可根据用户偏好显示或隐藏。活跃区间可在图表上向右延伸,并附带统
FREE

"PPR PA" is a technical indicator for the MetaTrader 5 platform, designed to automatically identify the PPR (Push-Pull-Rejection) pattern on the chart. This is a three-candle reversal pattern that can signal the end of a correction and resumption of the trend, providing traders with entry signals.
What is the PPR Pattern:
PPR is a three-candle reversal formation:
• Bullish PPR: two consecutive bearish candles (the second with a lower high and low), then a bullish candle that closes above the
FREE
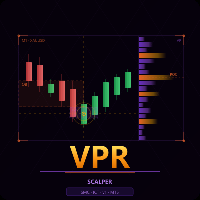
VPR Scalper: Volume Price Relationship Expert Advisor VPR Scalper is a precision scalping EA built on the relationship between tick volume and price action across three timeframes. Rather than chasing price, it reads the intent behind each candle, using smoothed, spike-capped volume analysis to distinguish genuine momentum from weak pullbacks and only enters when all three layers align. How It Works The EA operates through a structured three-layer state machine: Layer 1 — Trend: A volume-weighte
FREE

Simple Gold EA — XAUUSD 自动交易系统 Simple Gold EA 是一款专为 XAUUSD(黄金) 开发的全自动交易系统。 最新版本经过全面重新设计,不使用网格(Grid)或马丁格尔(Martingale)策略。EA 结合了多个独立的交易模块,包括亚洲交易时段策略、反转逻辑以及日内动量和回调策略。 主要特点: 无网格(Grid),无马丁格尔(Martingale) 使用预设止损(Stop Loss)进行风险保护 动态 Runner 和移动止损(Trailing Stop)管理 多个独立的 XAUUSD 交易策略 当月末账户余额创出新高时,自动增加交易手数 对最大手数增长进行限制和控制 全自动交易,无需人工干预 重要提示: 交易存在风险。历史回测结果并不能保证未来的盈利表现。请始终根据您的账户资金规模选择适当的风险设置。
FREE

FI Gold Framework is the free public entry point to the FintechInvest Trading Systems Framework. It runs one protected native H1 strategy module with fixed-lot execution, standardized CME Central Time sessions and optional protective exits. No external indicators, iCustom dependencies or intermarket drivers are required.
NO Grid Trading
NO Reverse Grid
NO Compoundin Extreme
NO Trading on High Volatility
NO Aggressive Scalping
NO Masked Martingale
NO Martingala
Designed for
FREE

Trades the classic break and retest: price closes through a key level, comes back to test it, and continues. How it works On each closed bar of the signal timeframe (H1 by default) the EA looks for a candle that closed above the high, or below the low, of the previous range (20 bars by default). It then waits for price to return to the broken level within a few bars. The retest candle must touch the level within an ATR based tolerance and close back on the breakout side. If price closes back ins
FREE

Fair Value Gap Finder detects fair value gaps and generates a signal when price returns to one. Set the minimum and maximum fvg size, customize the colors, style, and length, then let the indicator highlight them for you.
Key Features: Automatic FVG highlights - The indicator detects all fair value gaps that fit your criteria and marks them on the chart.
Entry Signal - A signal is created whenever price retests a fair value gap.
Notification - Alerts notify you when a fair value gap or a new
FREE

Swing Structure MS shows market structure as a clean line of confirmed swing highs and swing lows. Swings can be taken from any timeframe (for example H1) and displayed on any chart, so you can follow the higher-timeframe structure while working on M5 or M15. How it works A swing high/low is a bar whose high/low is not exceeded by N bars on each side (Depth). A new leg is accepted only if its size is at least X times ATR, or a fixed number of points. Small noise is ignored. On a lower-timeframe
FREE

Big Move Map 在图表上为每一次大幅波动着色并加以统计:该品种出现大幅波动的频率、距上一次大幅波动已过多少根K线、两次大幅波动之间的通常间隔、每月的大幅波动次数,以及10次纪录波动及其日期。大幅波动往往成群出现:在 US500 D1 上,一半的大幅波动日出现在前一次之后的4天之内,而平均间隔为19天。2012年以来的纪录日是2020年3月12日的-10.62%。仅使用已收盘的K线,因此从不重绘。每次发布前,每个数字都会与一个独立实现进行核对。 功能 每根出现大幅波动的K线都会在价格图上以颜色重新绘制:青绿色表示大幅上涨,粉色表示大幅下跌。10次纪录波动标有其排名和幅度。一个小面板显示:在此图表上波动需要多大才算大幅波动、距上一次大幅波动的K线数及其日期、大幅波动之间的典型间隔和"每10次中1次"的间隔、大幅波动中上涨所占的比例、本月的大幅波动次数与每月通常次数的对比,以及纪录波动。左下角的一条色带显示过去12个月中每个月的大幅波动。 工作原理 每根K线的波动是其收盘价相对前一收盘价的变化,以百分比表示。当某次波动大于该品种和周期上95%的全部波动时(可设为80%至99.5%)
FREE

Smash the Crash A dual-timeframe, non-repainting sell signal indicator purpose-built for Deriv CRASH synthetic indices — with an adaptive Fibonacci channel and a volume-aware Order Block engine built in. Key Features Dual-Timeframe Confirmed Sell Signals: Every signal is built on a proprietary oscillator that is evaluated independently across two separate timeframes which provides 2 distinct sell signals for a chosen CRASH index. Automatic Index Detection: Attach it to any CRASH or DEX DOWN char
FREE

Average Range Projection (ADR / AWR / AMR) – Milana Trades
This indicator shows how far price can still move today, this week or this month, based on its average range.
THE IDEA Every market has a normal size of a day. If the market usually moves 100 points a day and the low of the day is already in, the high of the day is likely to be about 100 points above that low. The indicator draws this for you.
WHAT MAKES IT DIFFERENT Most ADR tools draw fixed levels from the open. This indicator uses
FREE

ALYAS WaveTrend – Professional Momentum & Reversal Signals for MT5 ALYAS WaveTrend is a clean and practical momentum oscillator for MetaTrader 5, designed to help traders identify momentum shifts, WaveTrend crossovers, overbought and oversold conditions, and potential reversal opportunities directly from a dedicated indicator window. The indicator combines two WaveTrend lines, WT1 and WT2 , with customizable overbought and oversold levels. BUY and SELL signals are generated when the WaveTrend li
FREE
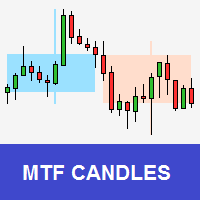
Tool that allows viewing candles in multiple timeframes. This way, it helps the analysis in multiple timeframes.
This is another product developed by Renato Fiche Junior and available to all MetaTrader 5 users!
Input Parameters
- Option 1 - TimeFrame: Standard MT5 timeframe - Option 2 - Custom TimeFrame (in minutes): Or, if this value is different from zero, the timeframe will be customized. This allows you to choose timeframe other than the MT5 standard. - Total Candles: Number of candles. -
FREE

GEX Options Radar — Options-Based Market Structure for US Indices (NDX / SPX) GEX Options Radar displays real-time-ish key levels derived from market maker positioning in index options — directly on your USTEC or US500 chart, with no paid data subscription required. What it calculates Zero Gamma (Gamma Flip) — the price level where dealers' net gamma exposure flips from positive to negative. Above it: "long gamma" regime (volatility typically dampened). Below it: "short gamma" regime (moves ofte
FREE

Quantitative Zeus Scalper —— 强大且自适应的量化剥头皮交易系统
Quantitative Zeus Scalper 专为捕捉短期市场机会而设计,结合多指标分析与动态风险管理。该智能交易系统整合多种技术信号,并采用自动手数计算系统,以持续适应账户资金变化及市场环境。 Quantitative Zeus Scalper 的优势: 高级多指标分析:
该EA结合多种技术工具(EMA、RSI、MACD、一目均衡表、布林带、ADX 以及K线分析),在每次交易前识别最有利的市场条件。 智能趋势过滤:
基于多个指标的投票系统用于确认市场方向,避免在不确定或无明显趋势的市场环境中进行交易。 自动风险管理:
根据账户余额及所选风险百分比自动重新计算手数,确保始终与账户规模保持匹配。 符合 Prop Firm 规则的资金保护:
系统内置每日、每周和每月亏损限制,以满足严格的风险管理要求。 使用说明: !! 使用前 !!
请务必使用推荐参数。任何重大修改都可能影响机器人的表现。并请按照以下链接中的说明进行设置: https://www.mql5.com/en/blogs
FREE

Investment Castle 支撑与阻力 — 自动买卖位
不再手动绘制支撑与阻力。该指标自动为您标出关键的买入和卖出价位,并按方向为K线着色,让市场倾向的一侧一目了然。它与 Investment Castle EA 内置的支撑与阻力引擎完全相同。
它能为您做什么 自动买卖位: 支撑与阻力自动检测并绘制——无需手动画线。 方向颜色提示: K线默认买入变蓝、卖出变红(可在参数中调整)。 更快决策: 立刻看清价格可能反应的位置以及偏向哪个方向。 体系的一部分: Investment Castle EA 的支撑与阻力核心,与心理关键价位配合使用。 处处适用: 任何品种、任何周期。
适合人群: 希望获得干净、客观的支撑/阻力位而免去手动绘图的交易者。
风险提示: 交易存在重大亏损风险。请务必先在模拟账户上测试,并使用您能接受的风险设置。过往表现不代表未来结果。
FREE

ZAMOLXE GOLD NEURAL AI Advanced Gold Trading Expert Advisor | MetaTrader 5 ZAMOLXE GOLD NEURAL AI is an advanced Expert Advisor developed for automated gold trading (XAUUSD) on MetaTrader 5. It combines market structure, technical analysis, liquidity zones, Volume Profile, and intelligent trade management in one powerful trading system. Key Features Multi-Timeframe Trading – Supports M1, M3, M5, M15, M30, and H1. Smart Entry System – Supply & Demand zones, Volume Profile, trend analys
FREE

Prior Day Week Month Levels with Touch Alerts 以 TradingView 的风格,在您的 MetaTrader 5 图表上把前一日、前一周和前一月的最高价与最低价画成整洁的水平线,并在右端显示标签。它还可以显示前一日收盘价和今日开盘价。
水平 - PDH / PDL:前一日最高价和最低价(蓝色 #2962FF,实线) - PWH / PWL:前一周最高价和最低价(橙色 #FF9800,虚线) - PMH / PML:前一月最高价和最低价(紫色 #9C27B0,点划线) - PDC:前一日收盘价(灰色,点线,默认关闭) - DO:今日开盘价(青色,点线,默认关闭) 每个水平都可以单独开关并有自己的颜色;线型和线宽按组设置。
计算方法 - 数值是最近一个已完成的日、周或月的最高价、最低价和收盘价,以及当日的开盘价——与 TradingView 脚本用 request.security(..., high[1]) 读取的"前一周期"数值相同。 - 这些数值由 D1 K线构建,因此 M5、H1 和 H4 图表显示的水平完全相同。 - 日、周、月
FREE

Liquidity Pool Heatmap – 止损在哪里等待:以热力图和分布图显示买方与卖方流动性
Liquidity Pool Heatmap 显示止损单可能聚集的位置:摆动高点上方(买方流动性,BSL)和摆动低点下方(卖方流动性,SSL)。每个流动性池都以热力线绘制在图表上——池越强,线越粗越亮。右侧的分布图显示未被扫除的流动性在价格上的分布。
您将看到 - 摆动高点上方(买方)和摆动低点下方(卖方)的热力线,从摆动点延伸到当前K线。 - 以粗细和不透明度表示强度,强池周围有光晕,最强的池会被突出显示。 - 价格上方和下方最强池的标签:价格、占全部未扫除流动性的百分比,以及合并的等高点/等低点数量(例如 "x3")。 - 最近被扫除的池以淡色虚线保留,并在扫除K线处标出圆点,让您看到流动性刚刚在哪里被拿走。 - 右侧分布图:每个价格区域占全部未扫除流动性的比例,最强区域突出显示。
流动性池如何形成 - 每个确认的摆动高点/低点(摆动强度可调,默认左右各5根K线)都会生成一个池,位于摆动点之外一个小的止损缓冲处(x ATR)。 - 权重 = 摆动点附近的相对成交量与平均成
FREE

Object Synchronizer for MT4 & MT5 Never redraw your analysis again. Object Synchronizer automatically synchronizes your manually drawn chart objects across all open charts of the same symbol in real time. Whether you're a scalper, swing trader, or multi-timeframe analyst, you no longer need to repeat the same analysis on every timeframe. Draw once. Analyze everywhere. Why Use Object Synchronizer? Most traders use multiple timeframes to analyze a single instrument. For example: • XAUUSD M1
• XAUU
FREE

Don't forget to try my other EAs. Goblin Golden Greedy v2.50 On The strategy tester can turn $100 into $1,000,000 in a month.
Elevate your XAUUSD trading with AutoTraderGold AI , a high-performance Expert Advisor designed exclusively for MetaTrader 5. This EA combines robust candle-based trend analysis with an optimized, direction-aligned Anti-Martingale (Reverse Martingale) strategy on the high-frequency M1 timeframe. Built for both automated efficiency and strategic control, AutoT
FREE

Free EA with Real Edge? In a world of lies and shiny names, I want to give a little light—a small light in the darkness. I want to show that a real robust bot doesn't have to cost thousands, but in fact can be found in the free section. XAUUSD is not my best project, but it is reliable, and simple. It might not make millions, but has a real edge. No promises, no "Future-AI-never-losing system"—but a real Expert Advisor. Trading Approach Multi-system logic Mean reversion strategies Diversificatio
FREE

SnR CC Level by RWBTradeLab
A clean, non-repainting Confirmation Candle (CC) level detector for MetaTrader 5, built for price action traders who don't just want Support/Resistance levels — they want levels the market has already CONFIRMED with a proper reaction candle. Every level on the chart comes with its own confirmation, all from CLOSED candles only.
What This Indicator Does
The indicator detects 6 types of SnR CC levels. A CC (Confirmation Candle) is a candle that touches a key level w
FREE

Aurex Resistance & Support Dynamic PRO An adaptive support/resistance zone indicator built on swing-pivot detection, ATR-scaled zone sizing, volume validation, and an automated mitigation protocol that removes zones once they've been invalidated. Zone detection Zones are anchored to confirmed swing highs and swing lows (symmetric pivot window, default length 10). Each zone's thickness is derived from a 50-period ATR rather than a fixed pip/point value, so zone width automatically adapts to the c
FREE

Pivot Points Classic and Camarilla 直接在图表上绘制经典枢轴点位(P、R1-R3、S1-S3)和 Camarilla 位(H1-H4、L1-L4)。这些价位根据所选时间周期(默认 D1)上一个周期的最高价、最低价和收盘价计算,每个周期都会在其适用的时间段上绘制一条水平线,因此您可以看到价格在之前的几天、几周或几个月对这些价位的反应。 功能 经典枢轴点 - 中心枢轴 P,以及三个阻力位(R1-R3)和三个支撑位(S1-S3) Camarilla 枢轴点 - 八个价位 H1-H4 和 L1-L4;H3/L3 和 H4/L4 绘制得更粗,因为这是 Camarilla 交易者最关注的价位;在经典模式中,枢轴 P 和外侧价位 R3/S3 更粗 经典、Camarilla 或两者同时显示 在同一图表上;经典线条为实线,Camarilla 线条默认使用虚线样式(线条样式可在输入参数中更改) 任意来源时间周期 - 日内图表上显示日线枢轴点,更大周期的图表上显示周线或月线枢轴点 过往周期历史 - 1 到 200 个周期,便于研究价格在这些价位附近的表现 价位根据上一个已收
FREE
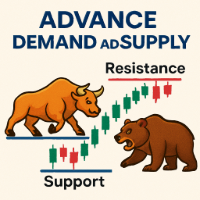
This Demand & Supply Zone Indicator with Volume Filtering is a technical analysis tool for MetaTrader that identifies key price zones where buying (demand) or selling (supply) pressure is concentrated. It uses fractals, volume analysis, and price action to detect and highlight these zones on the chart. Key Features: Zone Detection Based on Fractals Identifies demand (support) and supply (resistance) zones using fractal patterns (local highs/lows). Zones are formed from open prices ar
FREE

如果您喜欢本产品,请不要忘记发表评论并给予评分! Advanced Market Cipher B Advanced Market Cipher B 是一款面向 MetaTrader 5 的高级指标,旨在通过单一工具提供对 动量、市场资金流、趋势和背离 的综合分析。 该指标 基于 TradingView 上由 vumanchu 发布的 “VuManChu Cipher B + Divergences” 的概念和视觉结构 开发,并将其主要概念适配到 MetaTrader 5 环境,同时加入了额外功能、视觉优化和自主开发的功能。 Advanced Market Cipher B 的目标是将不同的技术信息集中在一个窗口中,使交易者能够更加清晰地观察 动量、强度、资金流、趋势和背离 之间的关系,从而更容易识别市场行为可能发生的变化。 主要组件 • WaveTrend — 动量分析、交叉信号以及超买和超卖区域识别。 • 背离 — 使用包括 WaveTrend、RSI 和 Stochastic 在内的不同指标组件,识别普通背离和隐藏背离。 • Money Flow Index (MFI) — 用于
FREE
# Indicador Daily High - Danilo Monteiro - MT5
## Descrição O Daily High/Low Labels é um indicador personalizado para MetaTrader 5 que exibe automaticamente as máximas e mínimas diárias no gráfico, facilitando a identificação rápida dos níveis importantes de preço. O indicador marca os preços com etiquetas e linhas horizontais, permitindo uma visualização clara dos níveis críticos do dia atual e anterior.
## Principais Características
### 1. Marcação Automática - Exibe automaticamente as máxi
FREE

TradeInfo is a utility indicator which displays the most important information of the current account and position.
Displayed information: Information about the current account (Balance, Equity, Free Margin). Current spread, current drawdown (DD), planned profit, expected losses, etc. Number of open position(s), volume (LOT), profit. Today’s and yesterday’s range. Remaining time to the next candle. Last day profit information. MagicNumber filter. Comment filter.
Indicator parameters: ShowPro
FREE

ICT Silver Bullet CRT EA: Master the Market's True Rhythm Are you an ICT student who understands the power of timing and liquidity, but struggles to be present for every high-probability setup? Do you want to automate the precision of the "Silver Bullet" strategy to ensure you never miss an opportunity? Introducing the ICT Silver Bullet CRT EA , the ultimate tool for traders who think in terms of liquidity, market structure, and fair value. This Expert Advisor was meticulously programmed to repl
FREE

IBI Vwap draws the Volume-Weighted Average Price calculated on the real volume of the exchange , with ±1 and ±2 standard-deviation bands. What you see VWAP : the average price paid by all participants since the session start, weighted by real traded volume. Institutions use it as a benchmark: above it buyers are in control, below it sellers are. ±1 and ±2 standard-deviation bands : how far price stretches from its average. The ±2 band marks an extension zone. Short labels on the right: VWAP (wit
FREE

Eabuilder Bitcoin Breakout is a quantitative trading system engineered specifically for BTCUSD on the H1 timeframe. Designed through multi-threaded genetic optimization with strict 1:1 mathematical parity in MetaTrader 5, it combines dynamic volatility breakout logic with four orthogonal, uncorrelated confirmation filters. Quantitative Performance Metrics (BTCUSD H1 | Score 85/100):
• Total Return: +806.9%
• Profit Factor: 2.49 (high statistical edge and robustness)
• Max Drawdown:
FREE

Zakirulbd Candle Timer V7 Professional trader utilities. Minimal design. Maximum clarity.
Zakirulbd Candle Timer V7 is a professional MT5 indicator designed to display the remaining time of the current candle directly on your chart in a clean, distraction-free format. One of the most common frustrations among traders is not knowing exactly how much time remains before a candle closes. Many traders moving from other platforms actively look for a reliable candle countdown timer before fully ado
FREE

COSMOS BTCUSD – 全周期耐力型·特殊马丁格尔EA
COSMOS是一款专为BTCUSD设计的耐力型自动交易EA,它彻底重新审视了传统马丁格尔策略的弱点,旨在兼顾长期运营所需的稳定性和盈利性。普通马丁格尔EA虽然在短期盈利能力上表现优异,但往往容易因市场剧变或趋势偏离而面临破产风险。而COSMOS通过对其结构本身进行改良,实现了“全周期耐久”这一理念。
本EA的最大特点在于其针对BTCUSD这一高波动性市场所优化的逻辑设计。通过分析加密货币特有的暴涨暴跌、流动性变化以及不同时段的价格波动偏向,并以此为前提进行入场及仓位管理。由此,不仅能避免单纯的均仓或加仓,还能根据市场状况实现灵活的仓位控制。
此外,OSMOS采用了“特殊马丁格尔结构”。这并非简单的加倍下注,而是融入了考虑市场走势及持仓间平衡的仓位调整算法。该设计旨在即使在浮亏扩大的局面下,也能抑制风险偏度,并瞄准适当时机进行回本。同时,通过追踪止损功能及多逻辑组合,构建了在积累细微盈利的同时规避大幅回撤的机制。
在风险管理方面,仓位数量、加仓间隔、追踪止损起始点等均经过战略性设定,采取了避免过度风险敞口的措施。特别
FREE

真正在起作用的那个支撑与阻力水平,是数出来的,而不是凭眼睛画上去的。S/R Channels MTF收集已确认的枢轴,找出其中容纳枢轴最多的那条带子,发布它里面有几个,并标出从中突破的位置。强度是一个可读、可比的数字,而不是一条凭手感拉出来的线。它是免费的:没有试用期,没有锁定功能,没有升级页面。 由两侧K线确认的枢轴,被收进一个由最近若干个枢轴组成的环。所谓一条通道,就是在给定宽度内邻居最多的那个枢轴,而这个宽度取的是最近价格区间的一个百分比,而不是点数,因此同一个设置在任何品种上都能用。 落在通道内的枢轴有多少个,就是它的强度,这个数字作为缓冲区发布,并用来给扫描器的单元格评级。信号是突破:价格离开了它此前一直在其中运行的那条通道。 图表上有什么 在价格窗口里绘制:最强那条通道的中部画成一条线,按价格处在哪一侧上色并跨越突破而不断开;通道的顶部和底部画成细线;价格在通道之上时覆一层阴影,在通道之下时覆另一层;以及突破那根K线上的箭头。 面板 价格图表上的画布面板,可拖动、可折叠、可关闭。它显示当前生效的时间周期,以及实际参与计算的设置数值。它告诉您最近一根已收盘K线上发生了什么:一
FREE

一个只花一条公式、一个设置的支撑与阻力通道,不用一个滑动窗口就能跟上价格。G-Channels MTF用递推搭出它的两条边界,每一条都向极值伸手,又在每根K线上稍稍落回一点,而信号取自价格穿过它们的均线。它内部既没有数组也没有窗口,而这正是它在任何时间周期上都保持灵敏的原因。它是免费的:没有试用期,没有锁定功能,没有升级页面。 两条边界以递推方式搭建,而且完全不用窗口。上面那条向价格的最高点伸手,然后按当前宽度除以长度的量落回;下面那条向最低点伸手,并上升同样的量。两者的均值就是通道的中心。一条公式、一个参数、一个数组也没有:这个通道被发明出来,图的正是这份廉价。 信号是价格穿过均线,作者画出这条均线正是为此。两条边界仍旧是它们本来的样子,也就是支撑与阻力,并不参与信号。 图表上有什么 在价格窗口里绘制:按价格处在哪一侧上色、跨越穿越而不断开的通道均线;两条边界,画成细线;两者之间的两处阴影;以及价格穿过均线那根K线上的箭头。边界可以单独关闭。 面板 价格图表上的画布面板,可拖动、可折叠、可关闭。它显示当前生效的时间周期,以及实际参与计算的设置数值。它告诉您最近一根已收盘K线上发生了什
FREE

Grid baskets rarely break in a quiet market. They break when a trend starts and nobody notices it in time.
LTS Trend Strength is the market-regime filter from LTS - Legacy Trading System. In one look it tells you whether the market is ranging, in transition or in a strong trend, on your chart and on four higher timeframes at the same time. It is built on the same ADX and ATR principles we use to protect our Expert Advisors, and it is free. It is a market filter, not an entry signal: it tells yo
FREE

Fully automated multi-currency trading algorithm that works only at night during a calmer market period with a unique market entry point search system. Does not use dangerous trading methods - martingale, grid and averaging. The main parameters for self-optimization are available in the EA settings. Default currency pairs USDCHF,GBPUSD,EURUSD, recommended TF: M5. Recommendations: in the Market Watch window, the currency pairs used in trading should be loaded. Attach an adviser to one chart (USDC
FREE

Fibonacci Auto Levels 自动绘制斐波那契回撤位,图表每次移动时,您都不必再手动拖动斐波那契工具。
工作原理 - 指标查看最近 N 根K线(默认 100 根),找出其中的最高价和最低价。 - 方向取决于哪个极值出现得更晚。 - 低点在高点之后:最近一段波动向下。0 位在低点,1 位在高点,因此各水平显示价格向上反弹了多少。 - 高点在低点之后:最近一段波动向上。0 位在高点,1 位在低点。 - 绘制的水平:0、0.236、0.382、0.5、0.618、0.786(可选)和 1,另有可选的扩展位 1.272 和 1.618。 - 0.5 和 0.618 突出显示,两端水平使用品牌绿色,扩展位为虚线。 - 每个水平都带有显示比例和价格的标签。可用一条点线连接两个极值。 - 每根新K线出现时重绘一次水平;若正在形成的K线创出新极值,则立即重绘。
输入参数 - 波段:搜索的K线数量。 - 水平:扩展位开/关,0.786 开/关。 - 显示:颜色、向右延伸、标签、波段线。
局限 - 当新的高点或低点进入窗口,或旧的极值移出窗口时,水平会移动。 - 极值纯粹按固定窗口内的
FREE

Auto Triangle Patterns 概述 Auto Triangle Patterns 是一款用于 MetaTrader 5 的图表指标。它会扫描当前图表的价格历史,寻找三种经典三角形形态:上升三角形、下降三角形和对称三角形。找到形态后,指标会绘制两条边界线,填充两条线之间的区域,并添加一个写有形态名称的文字标签。形态会保留在图表上,并随每根新 K 线向右延伸。 当价格向上或向下离开形态,或形态在没有突破的情况下走到顶点时,指标会标注结果并停止更新该形态。已经结束的形态会保留在图表上,便于回顾此前的形态。 本指标不会开仓或管理仓位,不会下单,也不产生交易信号。它是技术分析与图表可视化工具,所有标注都只是对已有价格数据的解读。 工作原理 形态搜索分为几个步骤。 摆动点。指标先寻找摆动高点与摆动低点。摆动高点是指其最高价不被左右两侧 K 线最高价超过的 K 线,摆动低点以同样方式寻找。左右两侧检查的 K 线数量由 InpPivotLeft 和 InpPivotRight 设定。由于右侧 K 线必须先收盘,一个摆动点只有在它之后出现 InpPivotRight 根 K 线后才会被
FREE

Check Out All Our Products: Click Here TradingCalendar Visualize Your Trading Performance: TradingCalendar automatically transforms your MetaTrader trading history into a clean monthly calendar, making it easy to see your trading performance at a glance. Daily Profit & Loss: Each trading day displays your daily P&L and number of trades. Profitable and losing days are clearly highlighted for quick performance review. Monthly Statistics: View your total monthly P&L and number of active trading
FREE

Deriv Synthetic HTF Candle Projection GMT2 Higher Timeframe Candle Projection & Previous Levels Tool for Deriv Synthetic Indices (MT5) Overview Deriv Synthetic HTF Candle Projection GMT2 is a professional MetaTrader 5 indicator built specifically for Deriv Synthetic indices . It projects the current forming Higher Timeframe (HTF) candle onto the chart and automatically draws key reference levels from previous candles. This indicator is designed to help traders maintain higher timeframe context
FREE

Squeeze Breakout Trader - 波动率挤压 + 突破型 EA Squeeze Breakout Trader 是一款完全自动化的智能交易系统,交易经典的"波动率挤压"(volatility squeeze)形态:它等待市场压缩至低波动区间,然后在价格随波动率扩张突破时入场。挤压状态通过比较布林带(Bollinger Bands)与肯特纳通道(Keltner Channel)来判断——当布林带收缩到完全位于(更宽的)肯特纳通道内部时,说明波动率异常偏低,此后往往会出现强劲的方向性行情。 交易方式 在每根新K线上计算布林带(价格波动带)和肯特纳通道(EMA中线 +/- 基于ATR的包络线)。 确认"挤压":前一根已收盘K线的布林带完全被包含在肯特纳通道内。 挤压后价格收盘价高于肯特纳通道上轨时开多单(向上突破);挤压后价格收盘价低于肯特纳通道下轨时开空单(向下突破)。 止损和止盈按ATR倍数设置,因此交易风险会自动适应当前市场波动率。 可选的基于ATR的移动止损会随着交易盈利移动止损位,并内置检查,确保永远不会尝试将止损设置超过经纪商的最小距离限制或过于靠近现有止盈。
FREE

默认扫描最近 300 根K线,为每个由三根K线构成的公允价值缺口画出方框,绘制其 50% 水平线,并标出价格首次回到近端边缘的位置。 功能 看涨与看跌的公允价值缺口,各自在第三根K线收盘后形成。 50% 的 Consequent Encroachment(CE)线,点线样式,在 InpShowCE 打开时显示。 触及时:裁剪到触及的那根K线、删除、变暗或保留;未被触及的缺口延伸 InpExtendBars 根K线。 该次触及的可选提醒,每个缺口一次。 参数 InpLookbackBars 300; InpMinGapPoints 0.0; InpMitigationMode MITIGATION_TRIM; InpShowCE true; InpExtendBars 20. InpBullishEnabled true; InpBullBorderColor clrMediumSeaGreen; InpBullFillColor C'220,245,230'; InpBullCEColor clrSeaGreen. InpBearishEnabled true; InpBearBord
FREE

Contextualize the Narrative: Multi-Timeframe Structure Simplified The HTF Period Cycles is a high-performance visualization tool designed for traders who need to anchor their intraday analysis to Higher Timeframe (HTF) levels without the friction of switching tabs. By projecting the Open, High, Low, and Close (OHLC) of completed HTF cycles directly onto your lower timeframe (LTF) chart, you can maintain a crystal-clear bias while executing in the "now." Why This belongs in Your Toolkit Successfu
FREE

使用布林帶和隨機震盪指標進行策略交易
布林帶主要用於跟踪趨勢。
隨機主線和信號線用於未結掛單買入或賣出
顧問 Auto3M Lite MT4 可以在 VPS 上工作。
Pro version MT4
Pro version MT5
特徵
沒有鞅 每個頭寸的硬止損和止盈 追踪止損 按間隔時間自動刪除掛單 對掛單使用買入止損和賣出止損功能 交易策略
AUTO3M Lite MT4 交易 9 種貨幣對 EURUSD, GBPUSD, AUDUSD, NZDUSD, USDCHF, USDCAD, USDJPY, EURJPY,GBPJPY
僅使用掛單買入止損或賣出止損。
隨機震盪指標僅用於報價分析和新柱分析。
當隨機主線大於 90 且出價小於上帶時,準備賣出止損掛單。
當 Stochastic main 小於 20 且 Ask more than Lower band 準備買入止損掛單。
當隨機指標主線超過隨機指標信號值時跟隨買入止損。
當隨機指標主線小於隨機指標信號值時跟隨賣出止損。
導出顧問測試結果
在 2021 年 10 月 1 日至 2021 年
FREE

让基准线在噪音中放慢、在行情中加速,帮您留在趋势里。五种自适应均线。No repaint。
任何品种,任何市场,任何周期。可在 Strategy Tester 中免费演示。
Get more indicators here
Baselines, volatility filters and oscillators. No repaint.
为什么需要它 固定速度的均线在强势行情中滞后,在噪音中跳动。您要么入场太晚,要么在小幅波动上入场。这两种入场都不符合您所交易的市场。每一次过晚或受噪音影响的入场,都会让您损失一次止损。 您将获得什么 Fabii Adaptive Trend Baseline 是一款带有五种自适应移动平均线的基准线指标,让您不必再与速度固定、不适合市场的线条较劲。 一个菜单包含五种自适应均线,让您选出最能跟随您市场的那一种。 KAMA、VIDYA 和 ADXVMA 会根据市场状况调整速度,让线条平滑噪音并跟随真实行情。 只有当收盘价越过偏差带时才出现趋势反转,价格仅触及线条不算,因此弱反转被过滤。 阴影区域显示价格沿趋势方向突破偏差带的位置,让您看到动能确认的地
FREE

A deterministic Renko engine for MetaTrader 5. It builds a real, custom Renko symbol from broker M1 tick/candle history using a fixed brick size (in pips) — so the chart plays out identically whether it's running on your VPS or your local PC, restart after restart. No ATR-based sizing, no drift between terminals. Key features Fixed brick size in pips — no ATR drift, same lattice every time Creates its own custom Renko symbol in Market Watch — works on any broker or symbol Optional wicks — toggle
FREE

Wave Breath Indicator 是一款适用于 MetaTrader 5 的 不重绘 自适应趋势流动工具。它基于典型价格 (HLC/3) 应用一快一慢两条指数移动平均线跟踪市场方向,在得到的基准线外侧包裹按波动率缩放的灵敏度通道,并锁定一个只有在收盘价穿越反向通道时才翻转的“状态型”趋势。输出是一幅干净、按颜色编码的主导趋势图:双色基准线、紧贴当前通道的水平线、填充在二者之间的半透明云层、按趋势上色的 K 线、随同向趋势连续延伸而逐步加深的背景渐变,以及标记每次确认反转的 ASCII L(多头)和 S(空头)标签。 查看 MT4 版本: Wave Breath MT4 更多产品请访问: 全部产品 想查看实盘示例和最新工具,请访问我的个人主页并添加好友,这样就不会错过任何更新! 工作原理 自适应趋势流动引擎 指标通过五个步骤构建核心视图。第一步,对每根 K 线计算典型价格(最高价 + 最低价 + 收盘价,再除以 3)。第二步,在这条序列上运行两条指数移动平均线,一条使用设定周期,另一条使用其两倍周期,然后将两条均线再平均成一条平滑的基准线。第三步,在同一长度区间上计算典型
FREE

Smart Band Classic An adaptive multi-layer trading indicator combining dynamic price zones, intelligent BUY and SELL signals, and professional chart visualization in one streamlined MetaTrader 5 workspace. Smart Band Classic is a technical analysis indicator designed to help traders navigate market movements, recognize potential trading opportunities, and evaluate price behavior through a clean and coordinated visual environment. The indicator brings together an adaptive band system and a propr
FREE

StatsMood Position Sizer Short Description Calculate position size instantly based on your risk and stop loss distance. Simple, fast and precise. Full Description Position sizing is one of the most important aspects of risk management. StatsMood Position Sizer is a free MT4/MT5 indicator that helps you calculate the appropriate lot size in real time based on your account balance, selected risk percentage and stop loss distance. It removes the need for manual calculations and helps maintain cons
FREE

AlgoLens Analyst is a FREE edition built to let you try the AlgoLens approach on your own charts. It is a lightweight on-chart dashboard that reads the market across several timeframes and shows the picture in one clear, movable panel — fast, honest context before you decide, with no signals that promise the impossible. FREE EDITION — WHAT YOU GET Multi-timeframe read: trend and market structure on each timeframe, side by side (M15, H1, H4, D1). Nearby support and resistance: the closest levels
FREE
MetaTrader市场提供了一个方便,安全的购买MetaTrader平台应用程序的场所。直接从您的程序端免费下载EA交易和指标的试用版在测试策略中进行测试。
在不同模式下测试应用程序来监视性能和为您想要使用MQL5.community支付系统的产品进行付款。
