 MetaTrader 5
 专家
 指标
 程序库
 实用工具
 窗口小部件
 规则
适用于MetaTrader 5的免费EA交易和指标 - 22
 使用EA交易和指标,使外汇交易获得更多盈利。EA交易可使您自动开启和关闭交易,而指标将帮助您更准确地预测市场行为。
该页面提供MetaTrader 5应用程序的目录。

Smart Market Flow Detector (SMFD) v4.0 — Professional Edition Four Algorithms. One Signal. Zero Repainting. Smart Market Flow Detector combines four analytical engines into a single indicator that identifies institutional order flow patterns across all timeframes. Every signal is generated on closed bars only — what you see in back-testing is what you get live. What It Does SMFD scores every bar on two axes: Smart Money Flow (institutional accumulation/distribution) and Dumb Money Flow (retail
FREE

Relative Volume or RVOL is an indicator that averages the volume of X amount of days, making it easy to compare sessions volumes.
The histogram only has 3 colors:
Green - Above average volume
Yellow - Average volume
Red - Below average volume
The default setting is 20 days, which corresponds more or less to a month of trading.
In this version is possible to choose between tick and real volumes (if you are using a broker which offers future contracts)
With the data obtained from this in
FREE
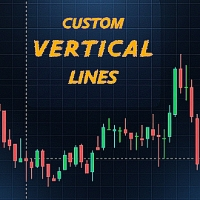
该指标会在您设定的时间自动绘制垂直线,并可选择性地在这些时刻的开盘价处添加水平线。它帮助交易者标记关键事件,例如市场开盘时间、策略时间或自定义的日内水平。 Features: 每天最多绘制 两条可自定义的垂直线 。 可选择从指定时间的开盘价绘制 水平线 。 完全可自定义 颜色、样式和线条宽度 。 轻量、快速,不会拖慢图表。 适用于任何 交易品种和周期 。 如果只需要 一条线 ,将第二个时间留空即可。 如果不想要任何线条,请将两个时间都留空。 How to Use: 将指标加载到任意图表。 在输入参数中设置所需时间(如 07:00, 14:30)。 调整线条的样式、颜色和宽度。 可选:选择哪个时间生成水平线。 如果需要更少甚至不需要线条,请留空输入。 该工具非常适合需要 清晰视觉标记 的交易者,用于标注交易时段、策略或日常操作。
FREE

StatsMood Position Sizer Short Description Calculate position size instantly based on your risk and stop loss distance. Simple, fast and precise. Full Description Position sizing is one of the most important aspects of risk management. StatsMood Position Sizer is a free MT4/MT5 indicator that helps you calculate the appropriate lot size in real time based on your account balance, selected risk percentage and stop loss distance. It removes the need for manual calculations and helps maintain cons
FREE

Professional Trading Dashboard 一款专业的 MetaTrader 5 账户监控面板,将实时账户数据、每日交易记录和月度统计整合到图表上的单一显示界面中。 Professional Trading Dashboard 是一款适用于 MetaTrader 5 的实用工具指标,旨在让交易者随时对自己的账户状态一目了然。无需在多个终端窗口之间切换,所有关键信息均以结构清晰的画布面板直接呈现在图表上。该指标涵盖实时账户指标、持仓汇总、每日盈亏历史、月度绩效统计以及近 30 天的滚动余额图表。 功能概述 面板基于 MetaTrader 5 Canvas API 构建,渲染一个 1030x530 像素的覆盖层,无论切换何种交易品种或时间周期,该覆盖层始终固定在图表窗口中。显示区域分为四个主要部分。账户区域显示实时余额、净值、保证金、可用保证金、杠杆倍数、保证金水平、当前浮动盈亏以及当日已实现盈亏变动。每项指标均附有颜色编码的状态标签,随市场条件变化自动更新。 账户区域下方的持仓汇总栏显示多头和空头的持仓数量、合计交易量,以及各方向和总计的浮动盈亏。每日分析表列出最多
FREE

概述
公允价值缺口 (FVG) 指标 v3.0 是一款适用于 MetaTrader 5 的专业工具,旨在实时检测和可视化市场失衡(低效)情况。该指标可识别价格留下的流动性缺口区域,这些缺口通常会形成价格磁石或支撑/阻力区域。
主要功能
自动检测:准确识别看涨和看跌的公允价值缺口。
多时间框架 (MTF):可在单个图表上同时监控多达 8 个时间框架。
反向公允价值缺口 (IFVG):检测公允价值缺口区域何时被突破并转变为反向区域(支撑位变为阻力位,反之亦然)。
高级缓解逻辑:可定义何时将区域视为“已缓解”(影线、实体或 50%)。
全面的警报:当价格触及某个区域或检测到汇合点时,会弹出窗口、推送通知(移动设备)和声音通知。
优化性能:高性能图形渲染系统,不会降低平台速度或导致闪烁。
视觉解读
1. 实心矩形(活跃 FVG)
这些矩形代表尚未完全缓解或消除的不平衡区域。
蓝色(可配置):看涨 FVG。潜在需求区。预期价格将反弹。
红色(可配置):看跌 FVG。潜在供给区。预期价格将下跌。
2. 虚线
矩形中心的虚线标记了该区域的 50%(连续突破),这是机构
FREE

This indicator consist of
Standard BBMA
Standard signal Sign on chart
added
EMA50 Behavior Tracking: The chart background changes color based on the EMA50 (default is black) and shifts to white when a breakout of the Bollinger Bands occurs. Three Engulfing Color Change: Automatically adjusts colors to help you easily determine market zones. default yellow/white High-Low Line Sign: Highlights the potential trading range and key price levels for better visual MHV
FREE

RelicusRoad Multi Timeframe Trendbar 是适用于 MetaTrader 4 和 MetaTrader 5 的多周期趋势指标,在图表角落以一行彩色圆点显示 M1 至 MN1 共九个周期的 Uptrend、Neutral 或 Downtrend 状态。 每个周期在图表右下角都有一个圆点,其名称显示在上方。颜色表示该周期的状态,因此无需切换图表即可看出哪些周期方向一致。 工作原理 对每个周期,指标都会在该周期当前 K 线上比较两个标准工具:步长 0.02、最大值 0.2 的 Parabolic SAR,以及周期为 14 的 ADX 中 +DI 与 -DI 两条线。只有二者一致时才会显示方向: Uptrend:Parabolic SAR 位于收盘价下方,且 +DI 高于 -DI,默认柠檬绿。 Downtrend:Parabolic SAR 位于收盘价上方,且 -DI 高于 +DI,默认红色。 Neutral:其他所有情况,包括 SAR 与 DI 意见不一致,默认黄色。 ADX 主线未被使用,因此这一行只显示方向,不显示趋势强度。ADX 与 SAR 的设置是固定
FREE
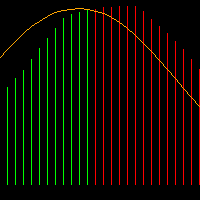
The Impulse MACD is a technical indicator that combines the power of multiple moving averages to create a unique momentum oscillator. Unlike traditional MACD indicators, this tool uses three different moving averages applied to high, low, and weighted price data to generate more precise market impulse signals. Its strength is its excellent filtering capability during ranging markets. Visual Elements Color-coded Histogram : Dynamic green/red bars that change color based on momentum direction Sign
FREE

Nadaraya Watson Envelope MTF 在价格中画出一条平滑的中心线,并在其周围画出一条包络带,然后标出价格在包络带之外成交后又重新回到带内的那些柱。 它回答的问题很窄,而且这是它唯一声称能回答的问题:价格已经远离自己近期的中心,而且刚刚停止远离。您把这看作均值回归的入场、趋势持仓的止盈位置,还是根本什么都不算,由您自己决定。指标只负责定位这个事件,不对它评级。 这条线是怎么算出来的 中心线是 Nadaraya-Watson 核回归:每一根柱都是其之前各柱的加权平均,权重由随距离衰减的高斯核给出。包络带位于该中心上下各若干个平均绝对误差处,数量可选,因此价格在线附近躁动的地方它会变宽,价格老实的地方它会收窄。 估计是因果的。第 i 根柱由第 i、i-1、i-2 根及更早的柱计算,绝不使用其右侧的柱。这是对图表网站上常见做法的有意背离:那里的拟合是双边的,新柱到来时线会在您脚下移动。在这里,一根柱收盘之后,中心线就不再改变。 图表上有什么 中心线按自身斜率着色,上行一种颜色,下行另一种颜色。包络带的上下边界以点线绘制。BUY 与 SELL 标记出现在价格重新进入包络带的
FREE

SMART GOLD PULSE 5M Automated Gold Trading with Built-In Risk Control
Gold Focused
XAUUSD M5 Controlled Entries
EMA + Fibonacci + Candle Reversal Filter Risk Management
Max DD + Emergency Equity Stop + Daily Order Control Stay Connected
Telegram alerts directly to your mobile
SMART GOLD PULSE 5M (SCALPING) Introducing SMART GOLD PULSE 5M , an automated Expert Advisor designed specifically for trading XAUUSD (Gold) on the 5-minute timeframe (M5) . The EA monitors the market and automatical
FREE

设置风险百分比,在图表上点击(Market 模式):点击一次设定止损,再点击一次设定止盈。手数由系统自动计算。
Click Risk 是直接显示在 MetaTrader 5 图表上的简约交易面板。您只需设置风险,点击三个价格(Limit 模式),手数便会自动计算。无需计算器,无需手动输入手数,无需订单窗口,没有多余的步骤。
如何开仓 1. 用 - / + 按钮设置风险百分比(默认步长 0.5,可在设置中修改,最小 0.1)。 2. 点击 BUY 或 SELL。 3. 在图表上点击:入场价(Limit 模式)、止损、止盈。
手数根据到止损的距离和您设置的风险百分比计算,随后发送订单。在 Market 模式下,入场价即当前价格,因此只需点击 SL 和 TP。选择价格时,光标旁的提示会显示点数、手数和风险金额。选择止盈时还会显示 RR。
一键管理持仓 • BE:将止损移至保本位(入场价加上可设置的小幅偏移;已计入每手佣金)。 • BE at:放置一条可拖动的线。价格触及该线时,止损会自动移至保本位。 • Close 50%:平掉一半仓位(比例可在设置中修改)。 • TP:可设置任意
FREE

Imbalances get revisited. This EA trades the retest with defined risk. How it works On each new bar of the signal timeframe (M15 by default) the EA scans the last three closed candles for a fair value gap. A bullish gap appears when the low of the newest candle is above the high of the candle two bars earlier, with a bullish middle candle. Bearish gaps are the mirror image. Gaps smaller than a fraction of ATR are ignored. Up to N unfilled gaps are tracked and drawn on the chart. When price retra
FREE

ZoneEdge finds the support and resistance levels that price has actually tested on your chart, ranks them by how many times they held, and draws them as zones.
What it shows - Where price sits relative to the nearest levels: near support, near resistance, in the middle of the range, and so on. - The nearest support and resistance, with the distance in pips and the number of tests. - Every level found, up to the eight nearest, in a table of type, price, pips away and number of tests. - A check
FREE

黄金市场的波动不仅仅来自价格本身,更来自买卖双方的主动进攻、市场失衡以及资金流向。Delta 指标正是为揭示这些核心变化而打造。
RBM Trader 的 XAUUSD Delta 指标能够识别主动买盘与主动卖盘之间的差异,帮助交易者在价格走势变得明显之前,提前发现真实的市场压力。
大多数交易者只关注K线,而 Delta 能够展示价格背后真正发生的资金行为。
该指标专为 XAUUSD 黄金市场开发,充分考虑了黄金在美盘、亚盘和欧盘期间的高波动特性与市场行为。
主要功能:
* 主动买卖压力识别 * 市场动能衰竭检测 * 潜在反转确认 * 突破有效性验证 * 更精准的资金流与动量分析 * 简洁直观的界面 * 针对剥头皮、日内交易和短线交易优化
Delta 指标并不是随机发出交易信号,而是帮助交易者理解市场背景与真实资金力量,避免情绪化入场,并识别机构资金真正活跃的位置。
非常适合希望在黄金市场中获得更高精准度、更专业资金流分析以及更好入场时机的交易者。
FREE

Tabajara Rules for MT5 , based on Professor André Machado’s Tabajara Setup, indicates the market direction using moving averages when there are candles aligned with the direction of the moving average.
The indicator contains the color rule applied to the candles and the moving average.
It allows changing the parameters: period and smoothing method of the moving average.
It also allows changing the colors of the candles (borders and filling) and of the moving average.
Professor André Machado’s
FREE
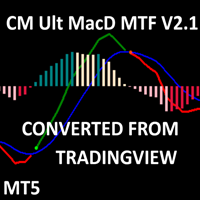
CM MACD Custom Indicator - Multiple Time Frame (V2.1) This advanced MT5 indicator, adapted from ChrisMoody’s TradingView script, delivers a powerful Multi-Timeframe MACD with customizable visuals and alerts. Plotting MACD lines, signal line, and a color-coded histogram, it highlights trend direction and momentum with distinct colors for growing/falling histograms above/below zero. Cross signals are marked with arrows, and users can enable alerts, email, or mobile notifications for buy/sell oppo
FREE

一次点击规划每笔交易:Entry、Take Profit 和 Stop Loss 自动画出。不重绘。
任何品种,任何时间周期。2 分钟加到图表。免费下载。
Get more indicators here
Baselines, volatility filters and oscillators. No repaint.
为什么需要它 你手动按平均真实波幅(ATR)规划交易。你读取 ATR,做乘法,换算成价格,再计算手数。每一步都可能出错,而且每笔交易的数字都不同。 放错的 stop loss 或算错的手数,比你省下的几分钟代价更大。 你将获得 Fabii NNFX Atr Levels 在图表上画出完整的交易计划,所以你不必手动计算水平。 点击任意K线,得到 Entry、Take Profit 和 Stop Loss 线,让你一次点击就有完整计划。 两个独立的 ATR 设置,一个用于 Take Profit,一个用于 Stop Loss,让你分别控制每个距离。 根据你的风险百分比计算手数,在角落显示为 LOT,让你入场前就知道仓位大小。 标签可显示价格或距入场点的点数,让你用喜
FREE

VEXOR — 适用于 MetaTrader 5 的高级交易面板与风险管理工具 使用 VEXOR 掌控每一笔交易,这是一款专为重视精准、速度和更佳交易体验的交易者设计的现代化 MetaTrader 5(MT5)交易面板。通过直观的图形界面下达市价和挂单、计算仓位大小、管理风险,并设置止损和止盈水平。 MT4 Version 与传统交易面板僵硬的布局和过时的界面不同,VEXOR 将时尚的深色设计、交互式控制、实时价格信息、动态风险计算和直接图表交互整合到一个精简的工作空间中。 VEXOR 在 MetaTrader 5 中是什么? VEXOR 是一款先进的 MT5 交易面板,旨在简化手动交易并使订单配置更加直观。直接从图表上的单一界面管理手数、订单类型、风险设置、入场价、止损和止盈。 通过交互式控制和可视化订单验证,VEXOR 帮助您更高效地准备交易,同时将关键交易信息保持在触手可及的范围内。 VEXOR MT5 交易面板的核心功能 1. 现代深色界面 VEXOR 采用精心设计的深色用户界面,为传统 MetaTrader 交易面板提供现代化替代方案。 现代深色主题图形界面。 带悬停效果的交
FREE

Vertex Aurum Gold — Smart Money Concepts (SMC) Auto-Trading System for XAUUSD Vertex Aurum Gold is an Expert Advisor for MetaTrader 5 built around Smart Money Concepts market structure. It detects swing and internal structure breaks, order blocks, fair value gaps, and liquidity zones directly on the chart, then uses that structure as the basis for a rule-based signal, execution, and risk engine. Structure detection can also be run on its own, with auto-trading switched off, for chart analysis on
FREE

KS Volume Bar Color Pro 是一款适用于 MetaTrader 5 的 MQL5 指标,它利用成交量加权逻辑直观地高亮显示特定的 K 线。
核心概念
该指标利用经典的“三根 K 线”形态来识别市场结构:
指标使用原生的 `DRAW_COLOR_CANDLES` 方式为中间的 K 线(即“位移 K 线”/displacement bar)着色。这种技术确保了着色与实际价格 K 线完美对齐,效果类似于成交量分布(Volume Profile)工具。
主要功能
1. 成交量加权的 FVG(价格失衡区)着色
将位移 K 线的成交量与之前 K 线的移动平均值进行比较。
将 FVG 分类为:
强(高成交量)
普通
弱(低成交量)
针对看涨和看跌情况使用不同颜色。
2. 管理功能
追踪两侧的 FVG 数量(数量由用户设定)。
当价格穿过阈值(完全回补缺口或触及中心线)时,消除(移除)该 FVG 标记。
每个报价跳动(tick)实时更新。
4. 警报与通知
阈值突破(净数量变化)
IOFED(价格进入反向区域)
已确认 / 未确认状态
向 M
FREE

Smart Structure Buy Sell Signals is a visual market structure indicator developed primarily for Gold (XAUUSD) intraday trading on MetaTrader 5. The indicator combines market structure, momentum, liquidity behaviour and supply-demand zones to identify potential Buy and Sell opportunities. It provides clear trading levels while keeping the final trading decision completely under the user’s control. This is a manual trading indicator. It does not open, modify or close real trades. Main Features • C
FREE

The VWAP Session Bands indicator is a powerful tool designed for Meta Trader 5. This indicator calculates the Volume Weighted Average Price (VWAP) and its standard deviation bands within customizable daily sessions, offering traders a clear view of price trends and volatility. Unlike traditional VWAP indicators, it ensures smooth, continuous lines across session boundaries by using the previous candle's values for the current (incomplete) bar. Ideal for scalping or day trading on instruments lik
FREE

ATR Trend Channel —— 基于 ATR 的自适应趋势通道指标 适用于 MetaTrader 5(主图指标 / Indicator,Chart Window) 产品简介 ATR Trend Channel 是一个绘制在价格主图上的 自适应趋势通道指标 。 它以 ATR(真实波幅)为尺度,围绕每根 K 线的中位价构建上轨与下轨。与常见的移动平均通道不同,这个通道不会随着每根 K 线平滑滑动,而是"锚定"在某一根 K 线上, 只有当收盘价真正突破轨道时才重新锚定并翻转趋势方向 。这种阶梯式的结构让趋势的边界清晰、翻转点明确,避免了普通通道线在震荡行情中不断变形、难以参考的问题。 除了通道本身,指标还把三件事直接呈现在图表上: 趋势方向 :上涨只显示上轨(绿色),下跌只显示下轨(红色); 翻转触发位 :末根 K 线右侧向右延伸的虚线投影,标出价格需要到达哪里才会翻转趋势; 趋势强度 :K 线按收盘价在通道中的相对位置着色,颜色越偏向趋势方向的颜色,说明价格越贴近趋势边界、动能越明确。 指标不发送任何交易指令,也不包含任何自动化交易逻辑,它是一个纯粹的行情结构与趋势状态可视化工具
FREE
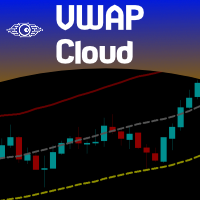
Do you love VWAP? So you will love the VWAP Cloud . What is it? Is your very well known VWAP indicator plus 3-levels of Standard Deviation plotted on your chart and totally configurable by you. This way you can have real Price Support and Resistance levels. To read more about this just search the web for "VWAP Bands" "VWAP and Standard Deviation".
SETTINGS VWAP Timeframe: Hourly, Daily, Weekly or Monthly. VWAP calculation Type. The classical calculation is Typical: (H+L+C)/3 Averaging Period to
FREE

Gold Asia Pulse X7 – XAUUSD M15
Gold Asia Pulse X7 是一款用于 XAUUSD M15 时间周期的 Expert Advisor。
策略采用以下交易流程:
Asian Range → 已确认的 M15 突破 → EMA 趋势过滤 → 基于 ATR 的 SL/TP
策略工作方式
在亚洲交易时段内,EA 记录该时段的最高价和最低价:
• Asian High = 亚洲时段最高价 • Asian Low = 亚洲时段最低价
亚洲时段结束后,EA 在 Trading Window 内寻找已确认的突破。
BUY ENTRY
当以下条件全部满足时,EA 在新的 M15 K 线上执行 BUY:
1. 前一根已完成的 M15 K 线收盘价高于 Asian High。 2. 再前一根 K 线收盘价位于 Asian High 或低于 Asian High。 3. EMA20 高于 EMA50。
确认后,EA 以当前 Ask 价格执行 BUY。
SELL ENTRY
当以下条件全部满足时,EA 在新的 M15 K 线上执行 SELL:
FREE
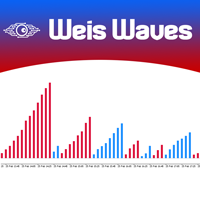
The original author is David Weis, an expert in the Wyckoff Method. The Weis Wave is a modern adaptation of the 1930's Wyckoff Method, another expert in Tape Reading techniques and Chart Analysis. Weis Waves takes market volume and stacks it into waves according to price conditions giving the trader valuable insights about the market conditions. If you want to learn more about this subject you can find tons of videos in YouTube. Just look for "The Wickoff Method", "Weis Wave" and "Volume Spread
FREE

"NagaRecoil" EA: A highly durable and resilient trading solution for long-term results
The long-awaited EA "NagaRecoil" has finally been released! This EA utilizes two high-performance indicators, RSI and RFTL, to skillfully capture market trend fluctuations and determine the optimal entry point. RSI sensitively detects market overheating, and RFTL predicts future price movements. This combination provides signals for buying and selling. Furthermore, as its name suggests, "NagaRecoil" develops
FREE

Trend Horizon EA is an expert advisor that follows trends using a moving average and a stochastic oscillator considering the volatility with the atr indicator. When the stochastic oscillator detects a crossover in the direction of the trend, it sends an order to the market, It is configured for use with EUR/USD on the 5-minute timeframe but also works on all markets.
Features: - Works with all currency pairs, commodities, and indices on all timeframes. - Works on multiple charts simultaneousl
FREE

Trendline Breaker Mechanical Trendline Breakout Trading for MetaTrader 5 Trendline Breaker is a fully automated Expert Advisor for MetaTrader 5 built around a simple concept: Confirmed Swings → Trendline Detection → Breakout → Entry → Safety Line Management → Exit Instead of relying on manually drawn trendlines, the EA converts trendline trading into objective and repeatable rules. The system automatically detects confirmed swing highs and lows, evaluates valid trendline structures, waits for a
FREE

SIMBA GRAVITY SIGNAL Find Where Price Has Weight Every trader has experienced it. You open a chart and begin marking levels. Support. Resistance. Previous highs. Previous lows. VWAP. Higher timeframe structure. Before long, the chart is covered with lines. The real challenge is no longer finding information. The challenge is knowing which information actually matters. SIMBA GRAVITY SIGNAL was built to solve that problem. Instead of treating every level equally, SIMBA analyzes multiple layers of
FREE

The indicator draws the daily open line. Parameters
GMT shift (minutes) The time zone could be shifted. The value is given in minutes. Draw closest regular bar's open price This parameter could fine-tune the open price line when using GMT shift. Yes - Draw the open line based on the current chart period's closest regular bar No - Draw the open line based on the M1 chart's closest bar. Let's assume that your shift is 10 minutes, and you are using H1 chart and the first candle in every day is 0
FREE

Pivot Points Classic and Camarilla 直接在图表上绘制经典枢轴点位(P、R1-R3、S1-S3)和 Camarilla 位(H1-H4、L1-L4)。这些价位根据所选时间周期(默认 D1)上一个周期的最高价、最低价和收盘价计算,每个周期都会在其适用的时间段上绘制一条水平线,因此您可以看到价格在之前的几天、几周或几个月对这些价位的反应。 功能 经典枢轴点 - 中心枢轴 P,以及三个阻力位(R1-R3)和三个支撑位(S1-S3) Camarilla 枢轴点 - 八个价位 H1-H4 和 L1-L4;H3/L3 和 H4/L4 绘制得更粗,因为这是 Camarilla 交易者最关注的价位;在经典模式中,枢轴 P 和外侧价位 R3/S3 更粗 经典、Camarilla 或两者同时显示 在同一图表上;经典线条为实线,Camarilla 线条默认使用虚线样式(线条样式可在输入参数中更改) 任意来源时间周期 - 日内图表上显示日线枢轴点,更大周期的图表上显示周线或月线枢轴点 过往周期历史 - 1 到 200 个周期,便于研究价格在这些价位附近的表现 价位根据上一个已收
FREE

ICT Silver Bullet CRT EA: Master the Market's True Rhythm Are you an ICT student who understands the power of timing and liquidity, but struggles to be present for every high-probability setup? Do you want to automate the precision of the "Silver Bullet" strategy to ensure you never miss an opportunity? Introducing the ICT Silver Bullet CRT EA , the ultimate tool for traders who think in terms of liquidity, market structure, and fair value. This Expert Advisor was meticulously programmed to repl
FREE

The Swing High Low Indicator is an essential tool for traders who rely on price action. It automatically marks key reversal points (swing highs in red, swing lows in green), helping you visualize trends, spot breakouts, and draw precise trendlines. By highlighting these critical levels, the indicator reveals market structure shifts—whether the trend is strengthening, reversing, or entering consolidation. Perfect for all timeframes and strategies, it turns raw price data into actionable tra
FREE

适用于 MetaTrader 5 的 KS 形态指标
该指标可在任何图表及时间周期上自动识别K线形态和价格行为形态。
识别的K线形态(通过设置 `ShowCandlestick = true` 启用):
十字星 (Doji) —— 中性形态,表明市场处于犹豫不决状态(标签显示为“Doji”)
看涨吞没 (Bullish Engulfing) —— 看涨反转信号(标签显示为“Bullish Engulfing”)
看跌吞没 (Bearish Engulfing) —— 看跌反转信号(标签显示为“Bearish Engulfing”)
锤头线 (Hammer) —— 看涨反转信号,常出现在潜在底部区域(标签显示为“Hammer”)
射击之星 (Shooting Star) —— 看跌反转信号,常出现在潜在顶部区域(标签显示为“Shooting Star”)
启明星 (Morning Star) —— 强烈的看涨反转形态(标签显示为“Morning Star”)
黄昏星 (Evening Star) —— 强烈的看跌反转形态(标签显示为“Evening Star”)
识别的图表形态(通过
FREE

Astra BB RSI Arrows — 基于布林带与 RSI 的可视化交易信号指标 Astra BB RSI Arrows 专为需要清晰、简洁且高效工具的交易者而设计,用于寻找市场中的潜在入场点和离场点。该指标结合了两种经过长期验证的技术分析工具:布林带(Bollinger Bands)和相对强弱指数(RSI)。 您无需频繁切换窗口,也不必手动监控价格交叉、超买区域和超卖区域。指标会直接在图表上提供完整的可视化信号系统。 该指标不会用多余元素占满交易终端。它只显示真正重要的信息:布林带线、入场信号箭头、可视化离场标记以及帮助您及时发现重要交易机会的通知。 Astra BB RSI Arrows 的核心理念 当价格进入极端区域并开始返回正常区间时,市场往往会出现较好的交易机会。该指标正是用于识别这种市场情况。 布林带显示动态价格区间,帮助识别市场可能出现过度扩张的区域。RSI 则通过显示超买或超卖状态来补充分析。当这两种工具同时提供一致信号时,交易者可以获得更加清晰、结构化的分析依据。 Astra BB RSI Arrows 不只是绘制指标线,而是将市场情况转换为直观易懂的可视化信号
FREE

Anchored VWAP + EMA(9) Bias Engine with Clean Entry & Exit Signals Elohim FX – VWAP EMA Crossover is a precision trend-and-bias tool that combines the institutional strength of an Anchored VWAP with a fast EMA(9) to define market direction, then delivers clean, bias-gated entry and exit signals — all on closed-bar confirmation so you never chase a repainting signal. No clutter. No bands. No noise. Just two lines, one bias, and clearly defined arrows. How It Works The indicator is built around a
FREE

Indicator Guide: Key Price Levels & Structure Shifts 1. Description The indicator is a technical analysis tool for the MetaTrader 5 platform. It is designed to automatically identify specific price movements and to highlight corresponding price zones based on preceding price action. This provides a visualization of key price areas according to the indicator's internal logic. 2. Visual Elements & Their Identification The indicator identifies and draws several types of visual elements on the chart
FREE

Gold doesn’t forgive a bad entry. It sweeps stops, tricks anyone reading the candle at face value, and reverses right when everyone’s convinced the trend is set. RBM Gold Liquidity Hunter shows you exactly where those traps happen, before you walk into one.
The indicator maps yesterday’s high and low automatically and draws the Asian session range live on your chart, that window that usually decides where the day is headed once London and New York show up. When price breaks one of those levels
FREE

产品简介 Pyramiding Entry Master 是一款专为 MT4 和 MT5 双平台设计的主图均线趋势跟踪与金字塔式加仓入场指标。它在主图上绘制四周期均线系统(MA5、MA10、MA20、MA60),并基于 55 周期趋势动量模型、成交量放大确认和多重超跌条件,自动生成三类买入信号:半路追涨(Chase)、加仓(Add)和抄底(Dip Buy),覆盖趋势加速追入、次日低吸加仓和深度超跌抄底三种典型入场场景。信号逻辑严谨、视觉层次分明,并配备独立冷却过滤与多通道提醒机制,是构建金字塔加仓交易系统的理想主图工具。 核心功能 四周期均线系统与右侧标签 系统在主线图上绘制四条均线: MA5 白色线 反映超短期价格重心, MA10 黄色线 反映短期趋势方向, MA20 品红色粗线 作为中短期趋势分水岭, MA60 绿色粗线 作为中长期趋势基准。四条均线右侧均附带同色文字标签,便于快速识别各均线位置。均线多头排列(MA5 > MA10 > MA20 > MA60)时代表趋势健康向上,是 Chase 和 Add 信号发挥最佳效力的背景条件。 MT5 版本额外支持信号 K 线染色
FREE

Vino Gold Trend Hunter XAUUSD Trend-Following Expert Advisor for MetaTrader 5 Vino Gold Trend Hunter is a fully automated Expert Advisor developed specifically for XAUUSD (Gold) . The EA combines a structured trend-following entry engine with configurable market filters, automated position management and daily trading controls. The integrated on-chart panel allows traders to monitor the EA and adjust important trading parameters directly from the chart. RECOMMENDED TIMEFRAME M15 — 15-Minute Cha
FREE

VWAP Ribbon Intelligence 是一款适用于 MetaTrader 5 的技术分析指标,融合了成交量加权平均价(VWAP)、动态威尔德(Wilder)ATR 波动带以及主图 RSI 动能数值显示,适用于外汇、黄金 (XAUUSD)、股指和加密货币交易。 专为日内交易、剥头皮(Scalping)和波段交易设计,无需在副图添加额外振荡指标,即可在主图直接呈现波动扩张和动能强弱。 核心分析架构 指标内置双模式计算引擎: Rolling VWAP (滚动周期模式)用于多根 K 线的连续趋势分析, Daily Reset VWAP (每日重置模式)以开盘价为基准锚定日内公允价值。基于威尔德平均真实波幅(ATR)计算的双层动态通道可随行情波动自动伸缩,分别标记内侧标准偏差区间与外侧统计极端边界。 内置的 主图 RSI 动能遥测系统 可在关键突破 K 线上下直接标注精确的 RSI 读数。历史标签在 K 线收盘后永久锁定,绝无重绘,同时提供可选的实时徽标跟踪当前活跃 K 线的动能演变。 交易流程与行情解读 价格处于中央 VWAP 附近反映市场平衡与公允价值整理。价格向内侧 ATR 轨
FREE

Headline/Title: Donchian Turtle Breakout Pro (100% FREE) [Introduction] Experience the legendary Turtle Trading strategy, modernized for today's dynamic markets. Donchian Turtle Breakout Pro is a complete, institutional-grade trend-following Expert Advisor based on Donchian Channels and ATR volatility. Originally developed for private prop-trading, we are releasing this highly advanced trading engine completely FREE for the MT5 community. It is designed to catch massive market trends while stric
FREE

Berserker EA is an elite algorithmic trading system engineered exclusively for the volatile XAUUSD (Gold) market. Designed for traders who value capital preservation over reckless, high-frequency trading, this expert advisor operates with absolute discipline.
Rather than chasing every minor price fluctuation, Berserker utilizes a highly confidential, proprietary market-scoring algorithm. It meticulously analyzes momentum, volatility, and institutional action zones in the background. By mathem
FREE

Fimathe H/M 适用于 MetaTrader 5 Fimathe H/M 是一款适用于 MetaTrader 5 的智能交易系统,基于两个时间周期之间的结构性突破逻辑。该系统使用较高时间周期定义交易循环,使用较低时间周期构建通道并执行入场。 该逻辑基于客观价格规则开发,不使用马丁格尔、不使用网格交易,也不包含激进的回本机制。每一个新的高周期循环都会形成新的交易结构,而低周期则用于构建参考通道并确认突破。 工作方式 该EA使用两个可配置时间周期: 一个高时间周期,用于定义循环 一个低时间周期,用于构建通道和执行交易 配置示例: H1 与 M1 H1 与 M5 H4 与 M1 H4 与 M5 当高时间周期出现新的K线时,系统会开始一个新的交易循环。在该循环内部,系统使用低时间周期的前几根K线构建参考通道。 通道形成后,EA会监控低时间周期中的K线实体突破。当突破被确认后,系统可根据方向和设定规则执行交易。 主要特点 基于高低周期循环的交易逻辑 根据低周期前几根K线自动构建通道 基于K线实体突破的入场逻辑 开盘通道识别 根据通道大小识别分段通道 小通道的 C1 结构投影 每个循环仅执
FREE

This EA is complete, multi-strategy , free , Brazilian and translated into English . If you prefer, download the EA in English:
https://www.mql5.com/en/market/product/59417 Light box robot , that is, you define the settings, which strategy you will use to operate.
More than 5,150 different input / output signals ;
More than 362.273148.218.750.000 possibilities combining up to 5 options of purchase (entry or exit) or sale (entry or exit), that's right, I checked this account!
Over 1,0
FREE
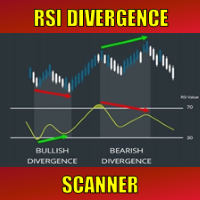
免费获取我所有的 MT4 和 MT5 指标 — 点击这里了解方法
新工具 售价 $30 限于 首周 或 前 3 次购买 ! MQL5 Trading Tools 频道 : 加入我的 MQL5 频道,获取我的最新动态 在动态的金融市场中,识别趋势反转信号对于有效交易至关重要。RSI Divergence Scanner 旨在帮助您准确高效地检测各种货币对和时间框架下的 RSI 背离信号。 查看更多 MT4 版本请访问: RSI Divergence MT4 Scanner 查看更多产品请访问: 所有 产品 1. 理解 RSI 背离 RSI(相对强弱指数) 是一种衡量价格动量的技术指标,广泛被交易者使用。RSI 背离发生在价格走势和 RSI 方向相反时,表明潜在的趋势反转。 背离类型: 看涨背离: 价格形成更低的低点,但 RSI 形成更高的低点。 表明下跌趋势可能在减弱,可能会反转为上升趋势。 看跌背离: 价格形成更高的高点,但 RSI 形成更低的高点。 表明上升趋势可能在减弱,可能会反转为下跌趋势。 隐藏背离: 隐藏背离有助于确认现有趋势的延续:
FREE

What is SMC Market Structure Pro? SMC Market Structure Pro is an automated trading Expert Advisor for MetaTrader 5, developed based on Smart Money Concept (SMC) and market structure analysis. The EA is designed to help traders follow the natural flow of the market, focusing on price structure instead of indicators or lagging signals. How Does the EA Work? The EA analyzes market structure changes using pure price action: Detects higher highs & higher lows for bullish structure Detects lower hig
FREE

**What it does**
Trend Pulse Lite draws a 50 EMA on the chart and paints it according to the market state:
- Green: uptrend. - Red: downtrend. - Gray: range, or a trend too weak to be taken seriously.
A moving average alone always has a slope, even if the price has been moving sideways for hours. That is why here the trend requires two conditions: an ADX above the minimum and a moving average slope large enough relative to the ATR. Because the slope is divided by the ATR, the same threshold
FREE

Adaptive Grid Trend EA is an automated trading system designed to operate effectively in volatile market conditions. It combines an Adaptive Grid structure with Trend Alignment , Dynamic Volatility Control , and Multi‑Session Logic to ensure the EA adjusts intelligently to changing market environments. The EA does not use exponential Martingale. Instead, it applies a Dynamic Linear Recovery model that calculates position scaling based on real‑time volatility and portfolio conditions, ensuring th
FREE

EA specializing in trading XAUUSD breakouts Only uses single orders with Stop Loss and Take Profit Does not use Stop orders or trailing stop orders to avoid brokers ban Live Signal Exness: CLICK HERE This is a trial version valid until June 30, 2026. Although it's free, you can use it as a full version before purchasing the full version. Notes: - You can run any timeframe, as timeframes are already built into the setup. - "Strategy Setting" : You are not allowed to change the parameters here
FREE

Matrix Gold Scalper V10 PRO Matrix Gold Scalper V10 PRO 是一款先进的技术分析工具,专为偏好“超短线交易”(Scalping)的交易者设计,特别针对 黄金 (XAU/USD) 市场进行了优化。该指标将“吞没形态”(Engulfing Candle)价格行为策略与强力过滤器相结合,以确保信号的高质量。 以下是该指标的功能摘要及获得最佳结果的专家建议: 1. 核心运行机制 该指标并非仅依据单一指标产生信号,而是要求 三个条件 同时满足: 价格行为 (Price Action): 出现明确的看涨或看跌吞没蜡烛形态。 趋势确认 (Trend): 买入信号时价格必须高于 13 EMA 指数移动平均线,卖出信号时价格必须低于该线。 动量与强度 (Momentum & Strength): RSI 指标: 买入时需高于 55,卖出时需低于 45(跳出震荡迷茫区)。 ADX 指标: 必须高于 23,以确保市场具备足够的流动性和强劲的趋势动能。 2. 技术特性 三重过滤系统: 得益于 ADX 和 RSI 过滤器,能够显著减少横盘整理期间的假信号。 即
FREE

This indicator copies graphical objects (vertical lines, horizontal lines, text labels, fibo and etc.) from master chart to other charts.
For example, you can copy lines from the chart GBPUSD with period H1 to chart GBPUSD with period M15. It's makes technical analyses more simple. Show label - show label on the Master chart, where you draw graphical objects to copy; Font size - font size of label; Type of synchronisation - type of synchronisation Copy text - on/off copy of text objects
Copy la
FREE
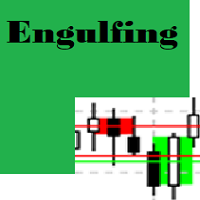
Engulfing Candle Detector
Detectable pattern Double Candlestick Patterns Bullish Engulfing
The first candle is black candle. The second candle opens with a gap below the real body of the black candle but rallies upwards to close above the real body of the black candle. In other words, the second candle's real body completely engulfs the first candle's real body Bearish Engulfing
The first candle is white candle. The second candle opens with a gap above the real body of the white candle but dec
FREE
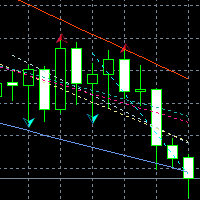
This indicator shows the TLH and TLL and some trendlines that allow us to estimate the trend of market. It also shows the values of the angles of the lines in percentage in points (pip) , the standard deviation, and the trend of each line, and when it breaks the lines of support and resistance (TLH and TLL). And finally, it also shows the points identified as supports and resistances through the fractal algorithm in the graph. The high and low trend lines are supported by the highs and lows, th
FREE

Strifor Chart Sync — MetaTrader 5 图表与技术分析同步工具 Strifor Chart Sync 是一款用于 MetaTrader 5 的专家顾问(Expert Advisor),旨在同步多个图表,简化同一交易品种的多周期技术分析。 您无需再手动修改每个图表中的交易品种。只需在 Master 主图表 上切换交易品种,所有关联的 Slave 从图表 都会自动切换到相同的交易品种,同时保留各自独立的时间周期。 例如,您可以同时使用: D1 — 整体市场环境 H1 — 局部市场结构 M5 — 寻找交易机会 M1 — 寻找入场点 如果将 Master 图表中的交易品种从 US500 切换为 XAUUSD ,所有关联图表都会自动切换至 XAUUSD: D1 仍然保持 D1 H1 仍然保持 H1 M5 仍然保持 M5 M1 仍然保持 M1 这样可以建立结构化的多周期交易工作区,无需在每个打开的图表上重复修改交易品种。 技术分析同步 Strifor Chart Sync 的核心功能之一是同步指定的图表对象。 专家顾问 不会自动复制图表中的所有对象 。这是有意设计的,因
FREE

风险交易面板是为手动交易而设计的. 这是发送订单的另一种方式。
面板的第一个特点是使用控制线方便地下订单。 第二个特征是在存在止损线的情况下计算给定风险的交易量。
使用热键设置控制行:
获利-默认情况下T键;
价格-默认情况下p键;
止损-默认情况下,S键;
您可以在交易面板的设置中自行配置密钥。
运算算法:
1)-我们把水平在所需的地方(这是没有必要把所有的水平);
2)-指定风险(可选);
3)-点击绿色发送订单按钮;
4)-我们正在等待下订单,或者会出现带有错误消息的警报;
5)-如果我们想关闭当前符号的所有订单,通过魔术链接到专家顾问,然后点击关闭订单按钮。
您不应该多次按下发送订单按钮。 一次就够了。 下单后,按钮将呈现"未按下"状态。
要发送带有风险计算的订单,需要设置止损线并在交易面板的"风险"字段中设置风险。 否则,订单将以当前交易工具的最低手数放置。
风险是从账户余额计算出来的. 由于经纪商对保证金交易细节的限制,不可能承担100%的风险。
在"风险"字段中允许小数(例如,您可以以余额的0.5%的风险进行交易)。
如果指定的风险低于允许
FREE

Short description
USDJPY grid EA with EMA trend filter and adjustable risk settings. Overview
This Expert Advisor runs on USDJPY (H1) and uses a grid-based structure with optional EMA trend filtering. It opens trades based on price action relative to the EMA and adds entries at fixed pip distances. The system exits all trades when a cumulative target is reached. Risk tools include max grid depth, hard stop-loss, ATR-based stop, and trailing. Designed for careful testing and adjustment. No DLL
FREE

NareshHTFCandles — Features 6 configurable HTF slots (default: M15 · M30 · H1 · H4 · D1 · W1) Each slot independently enable/disable, set timeframe, candle count, and trace Candles drawn to the right of price as chart objects — no subwindow Bullish/bearish body coloring with separate bull/bear wick colors Adjustable candle width, spacing between candles, and spacing between slot groups Wick thickness control via divisor (thick → thin) Forming (current) candle updates live on every tick FVG detec
FREE
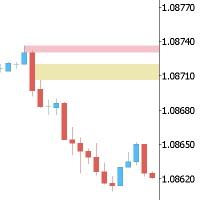
This Expert is the perfect companion for SMC/ICT users.
It allow to draw easily the Supply , Demand , Imbalance(fvg) zones as well set up MetaTrader alerts if price touchs the zone. Imbalance (fair value gap) have options to be displayed in full or based on the filling to the follwing candle, so you will never miss one.
You can also zoom on a clande with a specific period. Very usefull when you look at an 1h candle in the past and you want to see the details in M5.
How does it work ? Simply s
FREE

Crypto Triangle Pro is a fully automated ETHUSD trading system built around cross-market confirmation. Instead of relying on Ethereum price action alone, the system evaluates Ethereum together with Bitcoin and Solana to determine whether the broader crypto market is supporting the same directional regime. The system establishes a directional bias on Ethereum, then requires confirmation from Bitcoin and Solana before opening a position. A trade is taken only when the three-asset structure is alig
FREE

TILLSON MOVING AVERAGE Also known as TMA or T3 indicator. It is a moving average that uses EMA and DEMA in its formula and is calculated with the 3rd degree Binomial expansion. ... int handle1; //Handle of the Tillson TMA T3.EX5 custom indicator double euBuff1[]; int TMAperiod= 12 ; int TMSshift= 0 ; double VolumeFactor= 0.618 ; int OnInit () { ... handle1= iCustom ( NULL , PERIOD_CURRENT , "Market\\Tillson TMA T3.EX5" ,0,TMAperiod,0,0,TMSshift,0,0,Vol
FREE

### Indicator Description: Gradient Heiken Ashi with Momentum Coloring
This indicator is a technical analysis tool designed to overlay on the main chart, helping traders easily identify price trends and momentum through modified Heiken Ashi candles. It combines smoothed candle value calculations based on moving averages with a gradient color system to represent the strength of bullish or bearish trends.
#### 1. Key Features
- Display of Modified Heiken Ashi Candles:
- The indicator draws opt
FREE
具有多时间框架支持、可自定义视觉信号和可配置警报系统的Moving Average(MA)指标。
自由职业编程服务、更新及其他TrueTL产品可在我的 MQL5个人主页 获取。
欢迎反馈和评价!
什么是MA? 移动平均线(MA)是交易中使用最广泛的技术指标之一。它通过计算指定周期内的平均值来平滑价格数据,帮助交易者识别趋势方向并过滤短期价格噪音。 TrueTL MTF MA支持四种计算方法:简单(SMA)、指数(EMA)、平滑(SMMA)和线性加权(LWMA)。EMA和LWMA对近期价格赋予更高权重,对价格变化的反应更快,而SMA则提供等权重平均值。该指标可以在当前图表上显示任意高级时间框架的MA值。 功能: 带有箭头和垂直线的视觉信号标记 三个独立的信号槽,具有可配置的触发器 信号检测选项:方向变化、峰值/谷值、价格穿越MA线 每个信号的可配置警报功能(电子邮件、推送、声音、弹窗) 具有插值方法的多时间框架(MTF)功能 四种MA方法:SMA、EMA、SMMA、LWMA 可选应用价格(收盘价、开盘价、最高价、最低价、中间价、典型价、加权价) 多种颜色模式(简单、基于方向、基于级
FREE

是否厌倦了复杂的指标,尤其是在交易波动剧烈的黄金市场时?EasyTrend Gold MT5 指标专为驾驭黄金在任何时间周期上的波动性而设计。它利用 ATR (平均真实波幅) 的力量,将黄金的剧烈波动转化为一条清晰、动态且能过滤市场噪音的趋势线。 无论您是在 M1 周期上进行剥头皮交易,还是在 H4 周期上进行波段交易,您都可以直观地看到趋势的方向和强度,轻松识别盘整期,并获得关于何时对 XAU/USD 采取行动的直观洞察。 其他推荐资产 虽然 EasyTrend 针对黄金等高波动性资产进行了优化,但其逻辑在众多以强劲趋势著称的市场中同样非常有效: 主要外汇对: EUR/USD, GBP/USD, USD/JPY 股票指数: US500 (标准普尔500指数), US100 (纳斯达克100指数), GER30 (德国DAX指数) 加密货币: BTC/USD (比特币), ETH/USD (以太坊) 大宗商品: WTI/USOIL (原油) 1. 策略:指标的实际运作方式 EasyTrend 是一款趋势跟踪指标,它使用平均真实波幅 (ATR) 来创建一条能够适应市场波动
FREE

A chart overlay indicator for traders who want a structured view of Smart Money Concepts, market structure shifts, order block patterns, fair value gaps, equal highs and lows, and key multi-timeframe price levels directly inside MetaTrader 5. BOS and CHoCH · Internal and Swing Structure · Order Block Finder · Input-Controlled FVG Colors · EQH and EQL · Premium and Discount Zones Product Overview SMC Price Action Patterns is designed to convert raw price action into a clear, visual market map. T
FREE

大多数 SMT 指标只会标出背离。这个指标还会检验它们是否真的有效。 ICT Correlation SMT Divergence Honest Stats 将您的图表与相关市场对比(黄金对白银、EURUSD 对 GBPUSD、BTC 对 ETH、US500 对 US100),并标出每一个 SMT 背离。表格在您自己的图表上统计 SMT 之后价格反转的频率是否高于普通新高或新低之后的反转频率。免费,属于 Honest Stats 系列。 MT4 版本 | ICT Killzones Honest Stats(免费) | ICT FVG Honest Stats(免费) | ICT Liquidity Levels Honest Stats(免费) | TrueRisk Trade Panel(免费) | TrueRisk Account Guard(每日亏损限额,免费) 新品:所有 ICT 概念集于一个指标 -> ICT Pro All in One Honest Stats (9 个因素的共振分数、提醒和多品种扫描器) 新品(免费):反转公允价值缺口(IFVG),附回测信号和提醒 -
FREE

Cross-Asset Order Flow EA: Automated ETHUSD Trading on H1 In Plain Language If you've never used an EA (Expert Advisor) before: this is a program that watches the market and places trades on your MT5 account automatically, following one fixed strategy, without you having to sit and watch charts. DriftLock ETH uses a cross-asset approach : Bitcoin acts as an external source of market information, while ETHUSD is the asset actually traded by the EA. The EA continuously evaluates market conditions
FREE

RoundNumbers indicator is a simple and powerful psychological price levels. Trader usually use these levels as a Support and Resistance (SnR). Indicator Input: Levels - Numbers of levels drawn on chart. Default 30 levels. BoxSize - Box size drawn on each levels, indicate buffers around levels. Default value 1pips (10point) above and below each levels. ZoneSize - Distance between each levels, default value 10pips (100point). Style & Colours - User inputs customization. For MT4 version, p
FREE
MetaTrader市场是一个简单方便的网站,在这里开发者可以出售自己的交易应用程序。
我们将帮助您发布您的产品,并向您解释如何为市场准备您的产品描述。市场上所有的应用程序都是加密保护并且只能在买家的电脑上运行。非法拷贝是不可能的。
