适用于MetaTrader 5的免费EA交易和指标 - 17

A ideia do indicador é mudar de cores assim que o candle viole a banda; Caso o candle viole a banda superior, pinta o candle de vermelho, Caso o candle viole a banda inferior , pinta o candle de verde, Se o candle passar em algum momento pela média, ele assume uma cor acinzentada; Os candles que não passem pela média, nem violem a banda, apresentarão cor verde fraca, se for de alta e cor vermelha fraca se for de baixa. Projeto concebido no canal Aprenda a programar, keltner cores.
FREE

Introducing The Day Trader System: Your Shortcut to Day Trading Success! Are you a day trader seeking simplicity without compromising profitability? Look no further! We present The Day Trader System – your go-to solution for identifying lucrative opportunities in the fast-paced world of Forex. Simple Yet Powerful: The Day Trader System is a straightforward yet highly effective indicator designed exclusively for day traders. Say goodbye to complexity and hello to a system that simplifies
FREE

提示公司准备好了! X Project 是E Project 的强大交易顾问演变版 ,仅在纽约证券交易所开市期间进行销售,利用经济事件产生的微观反应期间欧元兑美元的波动性。 X项目采用高频策略并结合严格的风险管理。 环境 距市场 40 的距离 建议: 货币对:欧元兑美元 截止日期:全部。 最低存款:1000 账户类型:ECN、Raw 或 Razor,点差极低。 要使用 Promp Firms,您必须拥有一个允许在经济事件期间进行交易的 Swing 类型账户 特征: 仅交易欧元兑美元 每个操作都受到 SL 的保护 高频策略与严格的风险管理。 将追踪止损纳入退出策略的一部分。 强烈建议使用 VPS,这样可以减少执行延迟 要使用 Promp Firms,您必须拥有一个允许在经济事件期间进行交易的 Swing 类型账户
FREE

Simply Sensitive Stochastic Scalper 成功的关键永远是良好的优化。
该系统有很多变量,在这种情况下,它的简单性是其成功的关键。 该系统寻找不同的 "缺口 "作为入市失败,然后通过随机分析进行调试,即分析两条移动平均线,看价格是被高估还是被低估,一旦完成,专家顾问将决定是否执行行动或不执行。
这是一个非常简单但功能强大的系统。
变量如下。
Lot : 定义手的大小。
Take Profit (获利):定义获利的点数。定义获利的点数 StopLoss :定义了止损的点数。定义止损,单位为点。 这三个变量特别重要,因为它们将决定交易系统的性能和功能。
敏感度 。它是交易机器人用来执行销售的差距大小,在这种情况下,数值越小,它将执行更多的行动。
一个数值为负的缺口将决定买入行动,而一个数值为正的缺口将决定卖出行动,然而它们必须通过随机均线分析来决定是否入市。
在这种情况下,缺口预示着市场有很大的变动,出现了不规则的价格情况,在这种情况下,交易机器人将分析并执行对我们有利的交易,以确定我们是否在这种情况下积极交易。
时间框
FREE

Expert description
The Expert Advisor's trading system is based on entry and exit at a certain deviation of the asset price from the moving average value. The Expert Advisor has a number of parameters, by manipulating which you can implement different trading systems and also get different results when trading on different assets, keep this in mind when setting up an Expert Advisor and do not use standard settings on all instruments and time frames.
Recommendations for use
The EA working
FREE

This EA is a robot based on two EMAs and an standard MACD. No martingale or grid strategies. All positions have their own stop-losses. Trading strategy: This robot uses fast and slow EMAs to check the trend of the currency, once the trend is known, the standard MACD will trigger the correct order. Placing the best take profit and stop loss depending on the strengh of the trend. The Expert Advisor is designed for best performance in EURUSD currency pair at a 15m timeframe. Both slow EMA and fast
FREE

Main: Not martingale, not a grid; Working on all symbols;
Signals: There is a good rational algorithm. Work of two indicators: Envelopes and Moving Average (you can set a separate Timeframe for each indicator)
Stop Loss/Take Profit: There is a good money management system (there are several type for trailing stop loss); There is virtual levels of Stop Loss / Take Profit; There is smart lot (percent by risk) or fix lot
Important: EA can work on closed candles, and on current candles; Quick
FREE


Description This is an indicator for MT5 which has enhanced the "Fractals" indicator. "Fractals" indicator is included in MT5 by default but the draw line period is fixed at "5" and it cannot be modified. Thus I have reinvented the Fractals indicator with some useful function added. This tool will be useful especially for those who are learning how to draw good horizontal lines and wants to get some reference. Of course, those who are considering Fractals as an important horizontal line wil
FREE

Looks for strong price movements and draws levels upon their completion.
You determine the strength of the movement yourself by specifying in the settings the number of points and the number of candles of the same color in a row in one direction.
There are 2 types of building in the settings: extrenum - high / low close - close price You can also adjust the number of displayed levels and the number of candles for calculations.
By default, the settings indicate 5 levels for 360 candles.
FREE

工作逻辑
止损实用程序是一个简单但非常方便的指标,显示离止损水平还有多少点/
它的好处在于许多交易者为了追求利润而故意高估交易风险,最大限度地使用可用保证金,对于这种情况,了解经纪人可以在哪里强行平仓是非常重要的。
只需将指标放在图表上,根据买入或卖出的未平仓头寸,您将在图表上看到此交易价格的边界标记。
在您开仓之前,这条线在图表上是不可见的。 如果您没有在图表上看到这条线,这并不意味着该实用程序不起作用,很可能您交易的风险很小,而且存款很大,那么您需要寻找更高的止损线/ 低于交易,因为在当前风险下,您离止损还很远。 如果您有任何问题,可以在讨论部分写下来。 愉快的交易。 Recommended Robot Scalper - https://www.mql5.com/en/market/product/77108
变量
字体大小 - 标签中的字体大小
边缘缩进 - 从边缘缩进
线条颜色 - 线条颜色
文字颜色 - 文字颜色
FREE

VolumeFlow is a Volume Accumulation / Distribution tracking indicator. It works in a similar way to OBV, but it is much more refined and includes the options to use: Classical Approach = OBV; Useful Volume Approach; Gail Mercer's approach; Input Parameters: Input Parameters: Approach Type: Explained above; Volume Type: Real or Ticks; Recommendations: Remember: The TOPs or BOTTONS left by the indicator are good Trade Location points. This is because the players who were "stuck" in these regions w
FREE

Experience the exhilarating world of trading with Boom or Bust, the groundbreaking MT5 trading game that takes your skills to the next level. Get ready to embark on a thrilling journey of virtual trading, where you can test your strategies and immerse yourself in the dynamic world of financial markets—all without risking real money. Experience the exhilarating world of trading with Boom or Bust, the groundbreaking MT5 trading game that takes your skills to the next level. Get ready to embark on
FREE

This Expert advisor Trades Trending conditions, best use on EURUSD 1hr chart Strategy uses Bollinger band , Rsi and a momentum indicator to identify the best trading conditions
Includes news filter and account protection settings , also entry protection for high spread . Optimized code for quicker optimization in mt5
Download demo and test out Bollinger Band Lion .
FREE

The indicator High Trend Lite monitors 5 symbols in up to 3 timeframes simultaneously and calculates the strength of their signals. The indicator notifies you when a signal is the same in different timeframes. The indicator can do this from just one chart. Therefore, High Trend Lite is a multicurrency and multitimeframe indicator. With the High Trend Pro , available at this link , you will have an unlimited number of symbols, 4 timeframes, a colourful chart of the primary MACD indicator, several
FREE

With this indicator user can determine not just pivot like turning points. User able to spot trading ranges boundaries and support-resistance levels. In a strong trend the reverse signals also gives us excellent entry points. Recommended user settings: In the Attis volume: look back period : 1 or (3) MA_Lenght 99. ( of course one can play with the settings and get tailored signals... as you need)
FREE

This is a free version of the indicator, the period between the vertical lines is always 30 bars. In the paid version the period can be set by user, so a configuration with many ThreePointsChannel indicators with different periods is possible.
The principle of construction - on top of any number of bars set by the user, a channel is constructed with maximum and minimum lines so that the bars touch the maximum and minimum of the channel at exactly three points. The name of the indicator follows
FREE

Introduction Poppsir is a trend-range indicator for metatrader 5 (for now), which distinguishes sideways phases from trend phases.
With this tool it is possible to design a trend following-, meanreversion-, as well as a breakout strategy.
This indicator does not repaint!
The signal of the Poppsir indicator is quite easy to determine. As soon as the RSI and Popsir change their respective color to gray, a breakout takes place or in other words, the sideways phase has ended.
Interpret
FREE

You probably heard about Candlesticks behaviors, which in most of the times could denote and trace Volume behaviors even if you are not watching Volume itself... Well, this indicator will do this. Naked traders love to rely solely on candlesticks patterns and with Candle Zones you can trap special patterns and DRAW THEM on your chart. As simple as that. There are several filters you can tweak in order to achieve the analysis you want. Just give it a try. After several months of testing, we think
FREE

The Squeeze Index aims to measure the action of price being squeezed, and is expressed as a percentage, with higher values suggesting prices are subject to a higher degree of compression.
Settings
Convergence Factor: Convergence factor of exponential envelopes.
Length: Period of the indicator.
Usage
Prices being squeezed refer to the action of price being compressed within a tightening area. Prices in a tight area logically indicate a period of stationarity, price breaking out of
FREE

This is just a ADX with multi symbols, multi timeframes, and colors. features. different symbols and timeframes from the main chart. draw ADX and ADX moving average. easy to identify if ADX is above 25 or not. e asy to identify if ADX is above moving average or not. easy to identify the direction of the trend by color, not by DI line. unnecessary DI lines can be erased
FREE

Представляем Вам Volatility Doctor Basic Edition: Вашего главного мага на рынке!
Вы готовы отправиться в путешествие, чтобы разблокировать настоящий потенциал точной торговли? Позвольте нам представить Вам Volatility Doctor, Вашего надежного союзника в постоянно меняющемся мире рынков Forex. Этот выдающийся мультивалютный советник - это не просто инструмент для торговли; это виртуоз, дирижирующий Вашими инвестициями с непревзойденной точностью и изяществом.
Откройте для себя функции, меняющ
FREE

Introducing our advanced Expert Advisor (EA) meticulously crafted to navigate the forex market using two prominent technical indicators: Moving Average Convergence Divergence (MACD) and Relative Strength Index (RSI). MACD is a versatile trend-following momentum indicator that highlights changes in strength, direction, momentum, and duration of a trend. Meanwhile, RSI is a popular oscillator that gauges the speed and change of price movements, identifying potential overbought or oversold conditio
FREE

For those traders and students who follow the famous brazilian trader Igor Rodrigues (Mago Trader) here it is another tool he uses: a 2-line MACD specially set with Phi ratios. This MACD is packed with a twist: a Filling Area , to easily and visually spot the corresponding trend on the chart. Obviously, you can turn On and Off this filling feature. If you don't know Igor Rodrigues and you are a brazilian trader and student, just google for him... Very simple and useful indicator.
If you are lo
FREE

PLEASE HELP REVIEW/ SUPPORT/ SHARE THIS OTHER INDICATOR HERE https://www.mql5.com/en/market/product/51637 AS YOU DOWNLOAD THIS ONE FOR FREE. THANKS.
This Indicator is based on four moving averages and the PIVOT points. The indicator provides clarity to trading, especially in ranging markets when price is very slow and tight. You can trade intensively daily, every day with this indicator. You may decide to trade with this indicator alone and get the maximum out of the market. The indicator
FREE

Monte Carlo simulation is an Indicator that uses a Monte Carlo model to calculate the probability of the price going up or down. If the price has a probability of going up or down more than 90%, the system will enter a trade by doing a back test of gold assets. It was found that it was able to generate a return of more than 20% in a period of 5 months while having a MAX DD of less than 7%.
What is a Monte Carlo simulation?
A Monte Carlo simulation is a model used to predict the probability o
FREE

MT4/5通用交易库( 一份代码通用4和5 ) #import "K Trade Lib5.ex5" //简单开单 long OrderOpen( int type, double volume, int magic, string symbol= "" , string comment= "" , double opprice= 0 , double sl= 0 , double tp= 0 , int expiration= 0 , bool slsetmode= false , bool tpsetmode= false ); //复杂开单 void SetMagic( int magic, int magic_plus= 0 ); void SetLotsAddMode(int mode=0,double lotsadd=0); long OrderOpenAdvance( int mode, int type, double volume, int step, int magic, string symbol= "" , string comm
FREE

Purpose DG DayInfo is a free indicator that shows information about: Day's maximum prices; Day's minimum prices; Day's percentual variations; Daily candle direction (Up, Down or Flat); Candle timer; This way, DG DayInfo helps you to see day's maximum and minimum, check day's percentual variation and time left to close candle.
Key features Designed to be simple to use, with a few parameters Works in ALL pairs Works within ALL time frames*
Main Indicator Parameters Days - Set to how many days
FREE

This Indicator works as a momentum oscillator however it is most used to surf the trends. Despite of being an oscillator, MACD (Moving Average Convergence/Divergence) doesn't work with over limit conditions (such as OverBought or OverSold). Graphically it's shown as two lines and an histogram with the diference of them. Standard metatrader has this indicator, however with only the two lines and without the histogram. This way it is much easier to read and uderstand it.
FREE
The Wave Scalper EA is fully automated scalping system that uses price action to identify good scalping trades and executes them with an invisible trailing stop loss. It also includes a money management feature which calculates lot size based on account size and risk with an option to set a maximum draw down at which the EA will stop trading. This is a long term strategy combined with money management which works well on most pairs, but predominantly GBPUSD, USDCAD, EURUSD, AUDUSD & USDJPY. Plea
FREE

有了FNG顾问,你就能做出最适合你和你的交易风格的策略。 我们的大多数策略不使用鞅函数,但如果这是您的首选方法,该选项始终存在。
过滤指标:信封,熊/牛,移动平均线,威廉姆斯百分比范围和ATR
新闻过滤器-在新闻之前关闭交易并在新闻之前停止交易
追踪止损
可选鞅
经纪商隐藏的TP/SL
扩展过滤器
动态批量大小
创建可靠工作的个人交易策略,并将进行有利可图的交易。 如果您了解优化的工作原理并愿意投入一点时间,那么使用FNG Advisor创建自己的个人策略很容易。 对于不知道如何使用MT5优化功能的交易者,不建议使用此专家。
市场总是在变化,所以我们根据过去2-4年的历史数据创建我们的策略,并将提供我们所有的设置文件供您使用。 请在使用前优化设置文件到您的代理. 您应该为您的经纪商优化信号偏移,指标时间表和TP/SL。 我们的个人设置文件是优化使用1分钟的时间框架。 我们在评论部分提供了几个演示集文件。
当您购买我们的专家时,您不仅购买专家顾问,而且您还购买我们当前和未来的集文件。 随着我们添加更多的主要指标,我们将提供尽可能多的
FREE

Candle cross MA is an indicator that works "silently", that is, drawing only a moving average on the chart.
It alerts you when the last candle cross with a moving average that you set. Alert is given only when the candle closes.
The moving average settings are fully customizable.
The indicator sends popup, and push notifications. You can also deactivate alerts when the chart is inactive. Are you the trend type? Do not miss another opportunity!
FREE

Qstick is a way to objectively quantify candlestick analysis and improve the interpretation of candlestick patterns. Qstick was developed by Tushar Chande and published in his book " The New Technical Trader - Boost Your Profit by Plugging Into the Latest Indicators (1994) ". Qstick is built based on a moving average of the difference between the Open and Close prices. The basis of the idea is that the Opening and Closing prices are the heart of candlestick analysis. We strongly recommend the re
FREE

Bar Countdown is a simple indicator for MetaTrader 5 that shows the time remaining of the each candle. It can be placed in any corner of the chart or near of the price close and it'll help you to know
if the current candle is ending. Choose the counter format between HR:MIN:SEC and MIN:SEC It is so easy to use, configure the color, size and counter position on the chart and that's it!!! The Countdown starts now!
Updates: 2021/02/28; v1.0: Initial release 2021/03/16; v1.1: Minor code changes
FREE

https://www.mql5.com A double moving average indicator This indicator uses the system's own two different time period of moving average indicators to reflect the movement of market prices. It is recommended that you use the default parameter Settings, which you can set according to your own experience to get the best predictive power. I hope it can provide some help for your trading.
FREE

For those traders and students who follow the famous brazilian trader Igor Rodrigues (Mago Trader) here it is his famous 2 EMAs - based on Phi ratios - and packed with a twist: a Filling Area , to easily and visually spot the corresponding trend on the chart. You can turn On and Off this filling. If you don't know Igor Rodrigues and you are a brazilian trader and student, just google for him... Very simple and useful indicator.
If you are looking also for the MACD -based indicator of this trad
FREE

The MetaCOT 2 CFTC ToolBox Demo is a special version of the fully functional MetaCOT 2 CFTC ToolBox MT5 library. The demo version has no restrictions, however, unlike the fully functional version, it outputs data with a delay. The library provides access to the CFTC (U.S. Commodity Futures Trading Commission) reports straight from the MetaTrader terminal. The library includes all indicators that are based on these reports. With this library you do not need to purchase each MetaCOT indicator sepa
FREE

The Supertrend indicator is a very versatile and and accurate trend detection system. It can also be used an an reversal indicator. Therefor you can use it either as entry or as an exit signal. Depending on your settings it is also good for trend confirmation. This version is slightly enhanced from the original version from mladen. The Supertrend of Averages Histogram Version contains: 11 different price options Averaging period
18 different averaging types ATR period and ATR multiplier Shows r
FREE

For those Price Action traders who love to trade strong Price points, like today's Opening Price (or even yesterday's Price), here is an indicator to ease the identification of those values, drawn directly on your chart! Opening Price will automatically draw a line showing you this point for you, AND, if you like any OPENing price in the past, not just today's price. A must-have in your Price Action toolbox!
SETTINGS
How many past days do you want to be drawn? Do you want to draw the current
FREE

This indicator shows the strength of each currency compared to the US dollar by calculating the rate of change in price over a specified time period. When you open the indicator, you'll see a list of different currencies on the price chart. Each currency will have a numerical value indicating its strength level compared to the US dollar, where: If the value is higher than the US dollar, it will be displayed in green, meaning that currency is stronger than the dollar. If the value is lower than t
FREE

This utility allows creating any amount of grid orders just by clicking with the mouse.
Instructions:
Trading mode
Deleting mode
Press ctrl and click with mouse to start drawing a grid While drawing, press shift to cancel Release buttons to send orders
Press shift and click with mouse to draw a removal line
Release buttons to confirm removal: EA deletes every pending order that the line touches
Inputs: - 3 options to calculate the grid sizing: Fixed points distance between gr
FREE

这是一个组合指标分析趋势、支撑阻力、买卖点。运用了均线MA、布林带、KDJ、CCI、RSI。 主图上下线是布林带上下线,采用的是20周期和2.3标准差可以用来支撑阻力。 中间的是分析趋势的均线,趋势分析是用均线多周期: 为涨趋势,反之为下跌趋势。在同一种颜色,基本说明趋势没有发生变化。 子图是由 KDJ、CCI、RSI三个指标组成,大于70超买,小于30超卖, 智能提示是运用了算法,主要计算布林带, KDJ、CCI、RSI指标
有三个或四个指标超出市场常态就会发出提示行情可能反转。 子图指标运用了很多数据,刚刚开始加载会有点慢,耐心等待就可以 这个指标是主图指标,还要再下我发布的RCD分析,这样就刚刚好组成一套分析 电脑分辨率的文本大小请设置100%,不然字体会不一样
FREE

Kindly rate and comment about the product for upgradation & Support
The 5 EMA is plotted in green color ( Lime ). The 14 EMA is plotted in red color ( Red ). The 20 EMA is plotted in blue color ( Blue ). The 200 EMA is plotted in black color ( Black ). The 200 EMA is plotted in yellow color ( Yellow ).
The Quarter EMA that provided calculates and plots four Exponential Moving Averages (EMAs) on the chart using different periods: 5, 14, 20, and 200. Each EMA
FREE

This is the demo version of "All Harmonics 26" indicator . "All Harmonics 26" searches for 26 types of harmonic patterns and outputs them in a convenient way. You can check out the documentation here . This demo version has the following limitations: The indicator searches only for one type of harmonic patterns out of 26:- Gartley. The indicator outputs new patterns with a lag of 10 bars.
FREE

A very useful Price Action point is the previous day Closing VWAP. We call it Big Players Last Fight . This indicator will draw a line showing on your chart what was the last VWAP price of the previous trading session. Simple and effective. As an additional bonus, this indicator saves the VWAP value on the Public Terminal Variables, so you EA could read easily its value! Just for the "Prefix + Symbol name" on the variables list and you will see!
SETTINGS How many past days back do you want to
FREE

For those who feel that regular RSI is too fast and too noisy to be used on regular trades or in EAs and want to have an alternative to meter the Momentum of the Price, here is a solution presented on the great article of the Technical Analysis of Stocks & Commodities magazine (April, 2015), by Vitali Apirine, called: Slow Relative Strenght Index . Its reading is almost the same as the regular RSI, but its levels of Overbought and Oversold are 80 and 20 instead. SRSI is very powerful to show div
FREE
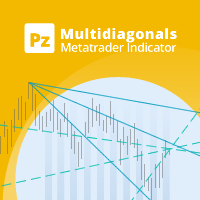
This indicator connects past price points drawing diagonals and trend lines, which converge in the future creating hidden reversal points. [ Installation Guide | Update Guide | Troubleshooting | FAQ | All Products ] Find hidden reversal points Spot convergence zones easily Dense criss-cross zones are reversal points Configurable amount of lines and price points Configurable colors
How to use the indicator The indicator draws several lines on the chart, and where many of these lines converge a
FREE

如果产品有任何问题或者您需要在此产品上添加功能,请联系我 Contact/message me if you encounter any issue using the product or need extra feature to add on the base version.
PA Touching Alert is a tool to free you from watching price to touch certain critical price levels all day alone. With this tool, you can set two price levels: upper price and lower price, which should be greater than/less than the current price respectively. Then once price touches the upper price or lower price, alert and/or notification would be sent
FREE

Functional in the Forex market. Functional on the B3 market - Bolsa Brasil Balcão. Motivation The Price Guide indicator is a tool that helps you insert support and resistance points at the chosen price and in the quantity you want, it depends on the agility of its configuration. This DEMO version will work on the Meta Trader 5 Demo account and Strategy Tester. Get the Full version that works with a Real account click: https://www.mql5.com/pt/market/product/111897 Operation The methodology publi
FREE

Introducing the "Cybercycle Trend" Forex Oscillator, a powerful technical indicator designed to enhance your trading experience in the foreign exchange market. This innovative tool utilizes advanced algorithms to identify and analyze market trends, providing you with valuable insights and helping you make informed trading decisions.
The Cybercycle Trend Forex Oscillator is specifically designed to detect and measure cyclical price movements in the forex market. By incorporating this oscillato
FREE

TRADER JET 是一款完全自动化的专业交易机器人。 专为 GBPJPY 外汇市场设计。
EA 不需要参数配置。 准备开始研究 GBPJPY H1。 您只需要对该地块做出决定即可。
它包括一个智能系统,可以识别趋势并过滤市场噪音。 专家根据趋势方向下订单。
商品通道指数、MACD 信号、标准差和移动平均线是每个提供输入和输出订单的 MT5 平台上的三个指标。 使用 GBPJPY H1 的一年历史数据(2022-2023)对专家进行评估。
我测试了 2022 年 1 月至 2023 年 6 月期间 GBPJPY H1 平价的指标,起始资金为 2000 美元,手数为 0.10,最大点差为 30,结果如屏幕截图所示。
推荐:
EAMagic - EA 的神奇数字,允许顾问专门以其头寸进行操作。 每个图表必须具有唯一的值。
该 EA 不需要参数配置。
确定您已下载并测试了此平价英镑/日元 H1 时间范围的历史记录。
我建议使用 VPS 或始终连接到互联网的计算机。
推荐任何经纪人。
建议最低存款额 - 美分账户 1000 美元,手数 0.1
FREE

2indtompson指标是一个指标,用于比较两种工具,用于确定交易量,用于平衡配对交易或套利交易,从模拟版本准备的MT4终端。 所以,如果你需要比较多少两种工具将权衡,你不知道如何做到这一点,然后把一个指标图表上,它会自动计算所需的平衡量。 此外,该指标显示相对于彼此的工具的状态-发散/收敛。
https://youtu.be/kgbIgnujuAM
建议在M5/M15/H1时间框架上使用它 通讯联系人777basil@mail.ru 根据您的技术任务,我们将编写、制造、返工和更正ea/指标/脚本。 多謝。. 建议在M5/M15/H1时间框架上使用它 通讯联系人777basil@mail.ru 根据您的技术任务,我们将编写、 制造、返工和更正ea/指标/脚本。 多謝。.
FREE

The indicator displays divergence for any custom indicator. You only need to specify the indicator name; DeMarker is used by default. Additionally, you can opt for smoothing of values of the selected indicator and set levels whose crossing will trigger an alert. The custom indicator must be compiled (a file with ex5 extension) and located under MQL5/Indicators of the client terminal or in one of the subdirectories. It uses zero bar of the selected indicator with default parameters.
Input param
FREE

At first, I got my teeth into Dragon Ultra Expert Advisor. Take your time to test demo. You should be always perfectly familiar with your Expert Advisor before a live trading. Based on the statistics, you are more likely to succeed if you learn from experience to use this. Dragon Lite is a free version for you to understand how the bot works. Parameter Trading Mode: Change to UNLIMITED. You should use the Dragon Training proficiently before using the Dragon Ultra .
The Forex T
FREE

This is an unusual representation of the Average Directional Movement Index. The indicator has been developed at the request of a trader and for the purposes of learning the development of indicators in MQL5. The line shows the same as the standard Average Directional Movement Index (ADX); The upward histogram shows the difference between +DI and -DI, when +DI is above -DI; The downward histogram shows the difference between +DI and -DI, when +DI is below -DI.
FREE

Trading Signal for MetaTrader5 PC platform
The Signal is based on the Investologic EA trend strategy . Trend following indicator’s and oscillator’s, can work with any symbol or market in MT5 platform FOREX, GOLD, OIL, STOCKS, INDEXES, NASDAQ SPX500 The strategy
the strategy uses multi time frame combination of indicators and moving averages to find the best entry point wen the fast MA slow MA Crossover And Stochastic , RSI , Average Directional Movement Index ,combined together
FREE

ScriptBot é um robô multi estratégia desenvolvido para ser prático e robusto, com o ScriptBot você é capaz de criar diferentes estratégias próprias, instale até 51 indicadores do seu gosto e monte o seu próprio gatilho utilizando uma expressões lógica simples.
WARN: English version: mql5.com/en/market/product/67941 Abaixo contaremos um pouco sobre a estrutura: Indicadores: ScriptBot não possui indicadores na sua codificação, isso significa que você tem total controle de quais indicadores
FREE

Description : Rainbow MT5 is a technical indicator based on Moving Average with period 34 and very easy to use. When price crosses above MA and MA changes color to green, then this is a signal to buy. When price crosses below MA and MA changes color to red, then this is a signal to sell. The Expert advisor ( Rainbow EA MT5 ) based on Rainbow MT5 indicator is now available here .
MT4 version is available here .
FREE

MACD RSI THUNDER The idea behind this indicator was initially to be used on RSI_THUNDER EA that we have deveoped towards giving a more granular control of the trend direction and momentum in which, in order to correlate corretly with RSI indicator, it's required.
I have converted the indicator into a signal that can be passed and integrated to the RSI_THUNDER EA or you can use it your own way. It's here for you to use and abuse and we hope you enjoy the experience that it provides.
Support:
FREE

The TTM Squeeze is a trading strategy developed by John Carter of Trade the Markets that uses the combination of Bollinger Bands and Keltner Channels to identify periods of low volatility, followed by periods of high volatility. The strategy is based on the principle that low volatility periods are typically followed by high volatility periods and is used to identify potential trading opportunities. When the Bollinger Bands move inside the Keltner Channels, it is referred to as a squeeze, and i
FREE
Patterns Wizard是一个用于创建蜡烛图形态的工具。通过它,您可以创建多种不同的图形形态,并在您的图表上添加任意数量的此指标的实例,每个实例都具有不同的形态。 为了更好地理解创建公式的方式,您可以使用名称为 My Candle的指标的示例,该指标包含70多个蜡烛图形态的示例 。 该指标的主要区别在于它具有 30个规则参数 ,这意味着您可以为前30根蜡烛分别设置不同的规则。 一旦出现图形形态,此工具可以执行以下操作: 播放自定义声音 在MetaTrader中发出警报 向您的手机发送通知 发送电子邮件 该指标不会重绘,只在蜡烛结束时执行,因此非常迅速。此外,它具有一个用于优化您想要分析的蜡烛的最大数量的参数。 在测试器中使用它,并随意使用它创建规则。当您准备迈出一步,拥有一款专业工具来帮助您分析交易时,就购买此工具吧。 蜡烛图形态的创建
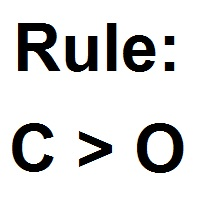
您可以使用此工具创建任何您想要的蜡烛形态,以下是如何获取图表值的方法 数值 描述 O 开盘价 H 最高价 L 最低价 C 收盘价 因此,如果您希望蜡烛是 阳线 ,只需构建以下公式 C > O 负责 阴线 的公式相同 C < O 这里是一个 十字
FREE
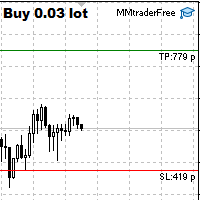
This tool is designed to quickly calculate the lot depending on the Stop Loss.
The control is done by hot keys
By default:
1 - Limit order price level
2 - Stop Loss Level
3 - Take Profit Level
Space Bar - Open an order
Escape - Cancel All 9 - Open 2 orders
Market Order
To open a Market order, click (2) and set up Stop Loss with the mouse If you want to put Take Profit - click (3) and set up Take Profit with the mouse
FREE

New Candle Alert is a simple indicator that notify you when a new candle is formed. Func tions : Alert type - option to choose between message with sound or only sound. Message - alert message. Push notifications - enable push notifications. Show timeframe - show the symbol timeframe. Show hour - show the alarm time. Test message - if you don't want to wait a new candle formed to see the message. MT4 version: https://www.mql5.com/pt/market/product/37988 Hope you enjoy it. Any doubt or su
FREE

Что такое Awesome Oscillator? Создателем данного индикатора является Билл Вильямс. Этот трейдер разработал собственную торговую систему. Её основой служит постулат: «Рынок движется хаотично. Какие-либо закономерности этого движения вывести довольно сложно, так как многое зависит от психологических факторов.» Поэтому Вильямс разработал собственные инструменты для анализа рынка.
Одним из таких инструментов и является индикатор АО. Это осциллятор, который дает возможность выявить силу текущего
FREE

We at Minions Labs love to study, challenge and discover new facts about Price Behavior in current markets. We would NOT call it Price Action because today this is a word totally overused and means, thanks to the False Prophets out there, absolutely NOTHING.
The study hypothesis we propose is this: Some Assets, in certain Timeframes, present a behavior of Price continuity when the candlesticks close without a Wick on them... So the purpose of this indicator is to "color" those candlesticks wh
FREE

Quantic MultiIndices Introducing Quantic MultiIndices, meticulously engineered to operate on four assets: US500, US30, Nasdaq, and DE30. Built upon the renowned concepts of breakout strategies, it is crafted to ensure precision and long term reliability . Key Features and Operational Insights: Timeframe: 1-hour (1H) timeframe.
Robust Risk Management: risks a user-specified amount of money per trade. (Default: $50).
Strategic Use of Trailing Stop and Stop Loss: Employs a volatility-based tra
FREE

Higher Timeframe Chart Overlay will display higher timeframe candles, including the number of candles high/low you specify.
You no longer need to switch timeframes to check the candles. Everything can be shown in one chart. Get Full Version - https://www.mql5.com/en/market/product/115682 Please feel free Contact me if you have any questions regarding this tool.
FREE

"Five Minute Drive" indicator that is designed to be used in the 5 minute timeframe only. One of its most important advantages is that it shows the general trend in the upper time frames when looking at the 5-minute timeframe. Therefore, when opening positions in the 5 minute timeframe, when it is in line with the trends in the upper timeframes, you are less likely to be upside down. If you can interpret the curvilinear and linear lines drawn by this indicator on the graphic screen with your geo
FREE

Highly configurable Adx indicator.
Features: Highly customizable alert functions (at levels, crosses, direction changes via email, push, sound, popup) Multi timeframe ability Color customization (at levels, crosses, direction changes) Linear interpolation and histogram mode options Works on strategy tester in multi timeframe mode (at weekend without ticks also) Adjustable Levels Parameters:
ADX Timeframe: You can set the lower/higher timeframes for Adx. ADX Bar Shift: you can set the
FREE

The indicator shows when there are overpricing and divergences over a normalized MACD Plus, it displays signals with configurable alerts, self-regulating dynamic overprice levels, and a simple setup and interface. This indicator automatically calculates markup ranges. MACDmaxmin is an indicator based on the MACD oscillator that effectively identifies trend changes in price, as it is a momentum indicator that captures the trend and shows the relationship between two moving averages of the price.
FREE
MetaTrader市场是独有的自动交易和技术指标商店。
阅读MQL5.community用户备忘更多地了解我们提供给交易者的独特的服务:复制交易信号,自由职业者开发的自定义应用程序,通过支付系统完成的自动付款和MQL5云网络。
您错过了交易机会:
- 免费交易应用程序
- 8,000+信号可供复制
- 探索金融市场的经济新闻
注册
登录