适用于MetaTrader 4的EA交易和指标 - 59

This is the countdown of the last candle Indicator. How much time remains in the current candle of your chart CTime display exactly how many hours, minutes and seconds remain before the current candle closes, and a new one opens. This allows you to be on the ball as soon as the next candle appears It could be useful for a trader who trades with candles as the main attention Available option to change the text color to suit the chart background. This Indicator is related to the system here .
FREE

This indicator scans the Moving Average values for 2 Moving Averages on multiple pairs and multiple timeframes in realtime and displays a Buy signal when the fast MA is above the slow MA and a Sell signal when the fast MA is below the slow MA.
-All the MA parameters(Period, Method and Applied price) can be changed from the inputs window.
-You can either add your own list of pairs to scan or set the scanner to automatically use the pairs in the market watch using the Symbols Source input.
-T
FREE
Euro Momentum es un EA que opera en el par EURUSD,en temporalidad de 5 minutos. Usa el canal de Donchian y el indicador de Momentum para determinar los momentos de entrada y salidas en el mercado en base a la tendencia existente y al volumen. No se usan sistemas de GRID,ni martingala,así como estrategias de entrada en las aperturas de mercado,ni momentos donde los spreads son muy altos ,ni ninguna otra práctica dañina para la cuenta. El lotaje recomendado según el capital sería: Cuenta de 1000 =
FREE
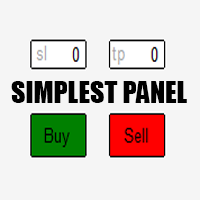
Just a simple panel that I created to make my trading life easier. Features: Buy and Sell with TP & SL right on chart Lot size is calculated by risk percentage Martingale - will open opposite position when SL hit (please don't enable unless you know what you are doing)
Will have more add-ons like Close-all button, Break-even, Trailing-Stop, etc. It's FREE so please leave your negative review somewhere else.
FREE

The indicator calculates the average price velocity over the specified time period. It is known that the trading time flows unevenly, in bursts. It either goes faster, or slows down. This indicator will tell if the trading time has accelerated and it is necessary to go to the smaller timeframes to search for trade signals.
Usage Alert is generated when the price velocity exceeds the specified threshold. The threshold value can be modified using the buttons on the information panel. A .wav file
FREE

The indicator is based on a single Moving Average of a user-defined period. By analyzing the price movement of the price relative to this MA, and also by tracking all updates of the price Highs and Lows over the same period as the MA period, the indicator draws its own picture of the trend, avoiding the ever-breaking MA lines. Therefore, if the trend goes up, the line will also point upwards and will not change its direction even on small retracements, allowing to capture almost the entire trend
FREE

Indicator Description This is a one-of-a-kind indicator. It predicts future bars using the theory of cyclical behavior of prices and certain market stationarity. This indicator will help you predict 1 or more future bars, thus providing a picture of the possible development of the market situation. It is based on 5 prediction methods. The first method is the Fourier transform, while the other ones are represented by different variations of linear prediction methods. You can select which method w
FREE
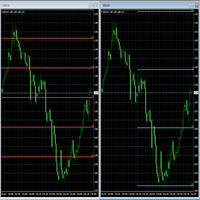
Fibonacci will be designed by default based on the monthly candle but you can simultaneously view Fibonacci on a weekly candle or you can choose your two favorite timeframes. When you run this script, an input prompt will appear and the following input parameters can be configured: Input Parameters: Name Example Default Timeframe1 Monthly 43200 Timeframe2 Weekly 10080 TF1status 1 on 1 TF2status 0 off 0 candleID you can choose which candle to apply 1 Prefix1 It's is the prefix of the first object
FREE

The Expert Advisor of the Forex Fraus family, the system is designed for scalping the EUR/USD pair on the M1 timeframe (for five digit quotes), and adapted for the accounts with fast execution of orders.
Operation Principle Buys at the extreme Lows and sells at the extreme Highs of the Stochastic indicator values. When a signal is received the orders are opened by injection, using tick data. Positions are closed by Trailing Stop Not closed positions are closed at the opposite trade Built-in adj
FREE

Expert Advisor uses Rsi and Bands indicators for generating signals and trades exit. Minimum trading deposit 500 $ . EA optimized to run on GOLD / EURUSD / GBPUSD / USDJPY / AUDNZD 1H charts (sets in the comments) can be also optimized to work on more charts and different timeframes. EA uses Grid. No Martingale. Works with high spread This EA operates only once per bar opening.
developed, tested and optimized on " VantageMarkets " platform. Recommended broker > Vantage
FREE
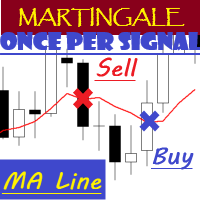
EA "MA Line" with martingale feature
EA will open position once per signal
To see how EA works, please watch the video below. In the video, I perform parameter optimization and do a backtest. The parameters that are optimized are: - MA Period - Stop Loss - Take Profit
For the future, I will try to optimize and test EA, especially the expert advisors in the mql5 community. hopefully it can be useful for colleagues in the mql5 community.
FREE

Free RSI expert advisor is a completely free expert advisor that trades using rsi level crosses. You can set which levels the Ea should use to open and close trades. The various settings are explained below. NOTE: The default settings are just place holders and not necessarily the best. Use the settings that best suites you or your strategy. Lots - This is the lot size of the EAs trades. 0.1 is the default setting. AllowBuy - Set to true to allow buy trades. This setting is true by default. Allo
FREE

Optimus uses a unique strategy based on averaging positions against the current trend. This approach allows you to profit from market corrections and reversals by opening additional positions in the direction opposite to the main trend. Monitoring
All signals are managed by our advisors, details are disclosed only to existing clients - after purchasing/renting any product. https://www.mql5.com/en/users/robotstroi/seller Main characteristics: Multicurrency: The advisor works on all major and
FREE

Equity Curve Overlay – MT4 Equity Curve Overlay 是一款适用于 MetaTrader 4 的指标,可将账户的净值曲线直接显示在主图上,与交易品种的价格走势进行可视化对比。 主要功能: 在主图上绘制净值(Equity)曲线 实现净值与价格走势的直观对比 可调节的缩放因子与垂直偏移,用于精准对齐 可选显示前一交易日的最高价与最低价水平 输入参数: EquityScaleFactor :用于调整净值曲线与价格值匹配的缩放因子 EquityOffset :净值曲线的垂直偏移(可正可负) ShowPrevDayHighLow :是否显示前一交易日的高低点标签 ColorHighLabel 、 ColorLowLabel :高点与低点标签的颜色设置 使用场景: 本工具适用于以下用途: 在回测中可视化评估策略表现 对比净值增长与市场价格行为 提供基本参考,用于策略优化与调整 兼容性: 适用于 MetaTrader 4 平台 可在实时行情与策略测试器中使用 不会影响其他指标或 EA 的正常运行 由 LM | Trading & Development 开发
FREE

Using multiple timeframes for analysis with Multi Timeframe Bollinger Bands can provide several significant benefits for traders: Comprehensive Market View: By applying Mtf Bands Standard across different timeframes, traders gain a broader perspective on market dynamics. This allows them to identify trends, patterns, and potential reversal points that might be more apparent or consistent across various scales. Enhanced Pattern Recognition: Multiple timeframes help in identifying repeating patte
FREE

FREE 7-DAY TRIAL After your trial ends, continue using this essential trading tool for only $30 one-time payment. Telegram Trading Report Pro Telegram Trading Report Pro is a professional MT4 Expert Advisor designed to keep traders fully informed about their trading activity through real-time Telegram notifications and automated performance reports. This EA is ideal for traders who want full transparency, instant alerts, and clear performance summaries without staying in front of the trading ter
FREE

Trends are like the "Saint Graal of traders": it can give you an higher win rate, a better risk to reward ration, an easier position management and so on...
But it is really hard to determine the trend with accuracy, avoiding fase signals, and with the right timing, in order to take massive movements. That's why I created the Trend Validator: a new and EASY tool that will make identifying trend and build new strategy a really easier work.
ANATOMY OF THE SOFTWARE
The indicator is composed by 3
FREE

Candle Time At Price — Precision Countdown Directly Beside the Candle Candle Time At Price is a lightweight, smart, and visually elegant indicator that displays the remaining time of the current candle right next to price — exactly where your eyes are focused. It’s designed for traders who value clean charting, precision, and zero distractions. Key Features: Real-Time Countdown — Displays the exact time left before the current candle closes. Price-Anchored Display — The timer moves wi
FREE

This indicator calculates directly the value of the dollar index by using the ICE formula to plot the chart, this can help you as reference. You do not need your broker to provide the ICE DX to use this indicator, is a way to have it calculated. Little discrepancies could be found in the exact value of the candles or time due closing time of the trading floor and the use of decimals, but generally will give you good reference. You need your broker offers the feed for the following pairs in orde
FREE

FOREX market is life itself. There is no such thing as a stable life. The same applies to FOREX. It's always about staying within a certain price range, but occasionally, there are significant deviations from that range.
Life is no different. During those times, it's important to wait patiently. Eventually, things will return to a stable range. When there is a major deviation from the range, it's an opportunity. You shouldn't miss out on this chance.
This robot uses the Envelope indicator to e
FREE

This indicator is the translated version of Anıl ÖZEKŞİ's MOST Indicator, developed on the Matriks Data Terminal, into the MQL4 language. It is a trend-following indicator and quite successful. Its usage will be free and unlimited for a lifetime. You can click on my profile to access the MQL5 version of this indicator. You can also get your programming requests for MQL4 and MQL5 languages done at İpek Bilgisayar with an invoiced service. You can reach İpek Bilgisayar at www.ipekbilgisayar.org .
FREE

MT4/5通用交易库( 一份代码通用4和5 ) #import "K Trade Lib.ex4" //简单开单 long OrderOpen( int type, double volume, int magic, string symbol= "" , string comment= "" , double opprice= 0 , double sl= 0 , double tp= 0 , int expiration= 0 , bool slsetmode= false , bool tpsetmode= false ); //复杂开单 void SetMagic( int magic, int magic_plus= 0 ); void SetLotsAddMode(int mode=0,double lotsadd=0); long OrderOpenAdvance( int mode, int type, double volume, int step, int magic, string symbol= "" , string comme
FREE
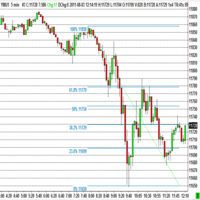
The program automatically draws fibonacci. This will save you a great deal of time in studying the chart. My intention is to facilitate those who carry out a study of the graph manually and use Fibonacci. In the screenshot you can see the result.The script applies to the chart of any currency pair or any stock. It will not open any purchase or sale operation because this program is limited only to drawing fibonacci.
FREE

Are you ready to get Alert,aim,shot and take profit? well nice to meet you im Martin del NEGRO from Argentina, let me introduce you about your new indicator, this one have the knowledge to find pivot points in the chart ,more specifically when the price its starting a new strong trend (buy)bullish or bearish(sell) ,and when "Victory Ravage Days.ex4" indicator find this one pivot point, he will immediately get in touch with you send you a notification to take advantage of this fresh and new oport

Uncomplicated straightforward indicator that shows the maximum account drawdown since the indicator was added to the chart. The indicator does not take transaction history into account since it is impossible to calculate drawdown from historical entries en closures of trades. The indicator will be free in this basic form. Eventually it will be developed but the focus is to keep it plain and simple.
FREE

This EA can't run in the same account. If you want an Expert Advisor that trades daily this is not because it requires patience to wait for a few days or weeks on the right opportunity for it to trade. It takes advantage of the volatility of the price movement.
This is a fully automated scalping Expert Advisor that can be run successfully using EURUSD currency pair at H1 timeframe.
FREE

Asesor Experto "Sniper FX": Precisión Milimétrica para Tus Operaciones El asesor experto "Sniper FX" redefine la precisión en el trading automatizado al ofrecer un enfoque estratégico centrado en pocas, pero extraordinariamente precisas, entradas en el mercado. Inspirado por la agudeza de un francotirador, este asesor experto utiliza algoritmos avanzados para identificar oportunidades óptimas de compra y venta, maximizando el potencial de beneficios mientras minimiza la exposición al mercado.
FREE
TRADE FROM LEVELS ACCORDING TO YOUR PARAMETERS! This Expert Advisor trades from support and resistance levels. The maximum and Minimum prices are set in the input parameters.
Input parameters: Selecttimeframe - setting the timeframe for the maximum and minimum prices How does it work? It's very simple - if you set a Monthly One, then the robot will trade at Max. and Min. prices that were last month For example, if you trade in the month of June, then the robot will find the maximum and minimum
FREE

Salva EA Free is an advanced and fully automated system, which passes backtesting since 2005. The basis of this strategy is the price chart itself, trading is performed based on the price movement range. Dynamic algorithms and filters are used for taking profit or closing trades. Built-in reworked system for filtering market entries and exits: Checking the trading direction using integrated trend indicators. Checking the channel range for the minimum and maximum values. Checking for the price ex
FREE

Introduction and Description
Colored candlesticks showing the trend based on two moving averages and the slope of the slow moving average. A trend is the overall direction of a market or an asset's price. In technical analysis, trends are identified by trendlines or price action that highlight when the price is making higher swing highs and higher swing lows for an uptrend, or lower swing lows and lower swing highs for a downtrend. Many traders opt to trade in the same direction as a trend, whil
FREE
Channel hybrid of the Moving Average, Bollinger Bands, RSI and CCI indicators. Unique filtering of signals without redrawing the indicator allows making various trades - both medium-term and short-term. The indicator operation principle lies in searching for the market reversal patterns. The trend reversal detection method uses the channel Triangular Moving Average, which plots equidistant non-redrawing channels with a Deviation period specified in the settings. Comparison of TMA and Bollinger B
This indicator allows to hide Volume (on all MT4 timeframes) from a date define by the user with a vertical line (Alone) or a panel (with "Hidden Candles"). The color of each bar depends if this one is higher or lower of the previous bar. Indicator Inputs: No inputs for this indicator Information on "Volume" indicator is available in this post: https://www.mql5.com/en/forum/134260 ************************************************************* Hey traders!! Give me your feeds! We are a commun
FREE

Network EURUSD - сеточный советник, настроенный для торговли валютной парой EURUSD. Для определения моментов для открытия сделок советник использует несколько индикаторов. Рекомендуемый период графика для торговли с настройками по-умолчанию - M15.
Настройки: Take profit
Размер тейк профита
Volume
Размер лота
Balance
Баланс для расчёта лота. Если ноль, то лот будет фиксированным
Period for indicators Период для индикаторов.
FREE

CopyStar – File-based Trade Copier (MT5 Master/Slave, MT4-compatible) Short description
CopyStar mirrors changes to your open net positions from the master to any slaves – quickly, robustly, and without network configuration. Communication runs via common files (shared file folder), enabling CopyStar to support MT5↔MT5, MT5→MT4, MT4→MT4, and MT4→MT5. Supports symbol mapping, lot multiplication, optional SL/TP copying, magic/comment filters, and a clear chart status display including heartbeat.
FREE

这是一个交易辅助工具箱,并不是全自动交易的机器人 W10 系统请保持 100%的缩放比,如果超过这个值。按钮内的字体将超出按钮边框 常规: 一键下单、一键挂单、一键反手,自动设置止盈止损。 一键平仓、一键平多单(空单)、一键删除挂单。 一键反手、一键锁单、设置自动追踪止损。 根据画线追踪止损 非农: 消息突破单,可在非农或者其他重大消息时使用,在消息行情爆发前在当前价格上方 挂BUYSTOP,下方挂SELLSTOP。订单自动设置止盈止损。 划线下单: 支持最多四根做多趋势线或者做空趋势线并存。价格到达趋势线自动开单。 支持每根下单趋势线设置不同的仓位。 每根下单趋势线可以设置不同的止损趋势线、止盈趋势线。 支持止损止盈趋势线进行止损止盈追踪移动。 支持趋势线的“时效性”,如果价格运行到开单(止损、止盈)趋势线的右方仍未订单成交,则价格将永远不会接触到趋势线,策略失效。如需要请延长趋势线 杂项: 支持历史订单轨迹显示,可在图表显示历史记录中所有订单的下单轨迹,显示开仓价、平仓价、单量。 支持实时点差显示 支持平台信息显示,杠杆,一个点的价值,一手保证金,仓息,是否支持EA等等
FREE

RedeeCash 三角套利機會將可用的貨幣三元組和每個貨幣交易頭寸設置顯示為全局變量,格式為
AAA/BBB、CCC/AAA、CCC/BBB:AAA/BBB -1|0|1
AAA/BBB、CCC/AAA、CCC/BBB:CCC/AAA -1|0|1
AAA/BBB、CCC/AAA、CCC/BBB:CCC/BBB -1|0|1
其中值是 OP_BUY 或 OP_SELL 的交易方向。 如果交易方向指示 -1,則該貨幣對不應發生交易。
三角套利交易對於不再允許對沖的美國賬戶很有用。 實際上有更多的套利機會,該指標以交易設置的形式顯示所有這些機會。 您只需要讀取全局變量並決定交易哪個機會?
當您開倉時,您應該使用至少 200 PIPS 的止盈,否則交易可能會在沒有止盈值的情況下開倉。
FREE

"Greedy Bear" is an expert advisor for traders who trade consciously. It is based on the strategy of returning prices to the average values during the European trading session. Accordingly, the expert Advisor trades the following instruments: EURUSD, GBPUSD, EURGBP, EURAUD, EURCHF, EURCAD, USDCAD, GBPCHF. The Expert Advisor allows you to disperse small deposits, because of this strong feature, and got its name. It is also an excellent tool for everyday trading.
Parameters:
"_Slippage" - Slipp
FREE

产品标题 Smart OsMA (MT4) – SmartView 系列的一部分 简短描述 具有独特用户体验的 OsMA 指标,在 MetaTrader 平台上提供。提供以前不可用的高级功能,例如双击打开设置、隐藏和显示指标而无需删除它们,以及以全图表大小显示指标窗口。设计用于与 SmartView 指标系列的其余部分无缝协作。 概述 SmartView 系列通过创新功能为 MetaTrader 平台上的指标提供独特且与众不同的用户体验,使指标管理更快、更轻松。每个指标都配备了图表上的智能控制面板,显示基本信息并提供对所有重要功能的快速访问。 以前不可用的独特功能 SmartView 系列提供使指标工作更简单、更快速的高级功能: 双击打开设置: 无需在指标列表中搜索,双击面板上的指标名称即可直接打开设置窗口。 隐藏和显示指标: 一键隐藏和显示指标,无需从指标列表中删除和重新添加它们。 以全图表大小显示指标窗口: 在子窗口中,您可以最大化指标窗口以全图表大小显示,并临时隐藏其他窗口。 折叠和展开子窗口: 折叠子窗口以减少其高度并节省屏幕空间,然后在需要时将其展开回全尺寸。 重新排列子窗口
FREE

Общие сведения Для начала торговли достаточно небольшого депозита. Идеален для быстрого разгона депозита!!! Подходит для мультивалютной торговли. Невосприимчивость к большой задержке и величине спреда.
Принцип работы После запуска советника на графике советник запоминает уровень открытия первого ордера. Выше уровня открытия первого ордера советник выставляет сеть ордеров на Sell . Ниже уровня открытия первого ордера советник выставляет сеть ордеров на Buy . Если общая прибыль ордеров на покуп
FREE

A trading adviser that not only trades, but also has a built-in game. The EA trades on signaling bars and MACD and RSI indicators. The ATR indicator is used to determine volatility. Many other customizable options are available. An interesting feature is the built-in free game in which you need to control the ball and collect coins. The ball jumps along the line of the moving average, you need to control it with the arrows or the "w a s d" keys and not let it fall outside the playing area (2 re
FREE

您是否希望将您的股票交易提升到一个新的水平?
凭借其智能算法和专家订单,您可以确保自己始终处于领先地位。 从上涨和下跌的市场中获利,轻松预测趋势,并保持投资组合的领先地位 - 有了 Stock Flow,一切皆有可能!
输入和输出订单由可以在任何 MT4 平台上找到的两个指标的组合给出:MACD 信号、动量指标和资金流量指标。
指标的周期和水平值以最佳组合进行调整,以获得最佳净利润。
它还包含止损和止盈,在波动性增加的时候提供资金安全。
Expert 测试了 2021 年 1 月 1 日至 2023 年 1 月的 GBPUSD M30 历史数据(在 MT4 上回测 2 年)。
请自行下载测试。
您还可以使用 Metatrader 4 平台中的优化功能来寻找更好的 EA 版本。
推荐:
ü MaxLotSize - 最大允许交易手数。 仅当您真正了解自己在做什么时才更改此参数。
ü TakeProfit - 以点数获利。
ü StopLoss – 止损点数。
ü EAMagic - EA 的幻数,它允许顾问仅使用其位置。 每个图表必须有不同的值。
ü 本E
FREE

Sentinel Pro V is a professional-grade MetaTrader 4 Expert Advisor designed for traders who demand precision and mobility. By combining three layers of RSI and Stochastic analysis with custom trendline tracking, this bot ensures you stay informed of every critical market move via instant Telegram notifications. Key Specialized Features 1. Triple-Level RSI & Stochastic Alerts Unlike standard bots, Version 2 allows you to set three distinct alert zones for both RSI and Stochastic indicators. This
FREE

Automatic trading system. This trend adviser will make a good company for your older brother. Optimized for the USDZAR currency pair. This Expert Advisor is also designed for trading on large timeframes. Both Expert Advisors showed a large percentage of winning trades, but they are better perceived as trading systems. For more profitable trading, in addition to the main signal, the Expert Advisors have a visual signal panel. It is displayed on the right side of the chart. If most of the cubes o
FREE
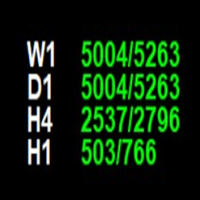
The **Point of Week Indicator** is a powerful MetaTrader 4 indicator that displays point values for multiple timeframes (W1, D1, H4, H1) directly on your chart. It calculates the position of the close price within the candle's range and displays it as a point value, along with the total range of the candle.
## Features
- Displays point values for 4 timeframes: **Weekly (W1), Daily (D1), 4-Hour (H4), and Hourly (H1)** - Shows point value and total range in format: `"point_value/range_value
FREE

The principle of this indicator is very simple: detecting the candlestick pattern in D1 timeframe, then monitoring the return point of graph by using the pullback of High-Low of D1 Candlestick and finally predicting BUY and SELL signal with arrows, alerts and notifications. The parameters are fixed and automatically calculated on each time frame. Example:
If you install indicator on XAUUSD, timeframe D1: the indicator will detect the reversal, pullback, price action on this timeframe (for exam
FREE

================================================================================ The utility is useful when you have to load history data for many symbols and timeframes. It loads the symbol used in the market watch. One symbol is scanned for all timeframes. Then the charts will be closed and the next symbol is scanned. You cannot abort the operation. Wait till it is done. ================================================================================
FREE

This is script to quickly modify multiple trades all at once and automatically calculate the breakeven point which work perfectly for martingale strategy and can be used alongside any martingale EA to adjust the TakeProfit and StopLoss For all the running orders on the chart. How to use: Pip worth : is for easily calculate the pips according to the chart you are running on, for example (pip = 10 points on major currency pairs, 100 point in indices, and 1000 on some crypto charts like BTCUSD) Sto
FREE

This indicator plots a moving average in 2 colors: Green if the slope is bullish Red if the slope is bearish NB: if the last value of the moving average is equal to the previous one, the color will be red. You can obviously edit the Period of the moving average, the width, the MA mode (Simple, Exponential, Smoothed and Linear Weighted) and the MA price (Close, Open, High, Low, Median Price, Typical Price, Weighted Close).
FREE

PLEASE HELP REVIEW/ SUPPORT/ SHARE THIS OTHER INDICATOR HERE https://www.mql5.com/en/market/product/51637 AS YOU DOWNLOAD THIS ONE FOR FREE. THANKS.
The indicator was created to make trading very easy to understand. It is based on five moving average crosses and pivot points. Download the "EASY TREND" on my Product list for a more advanced and profiting trades. You can trade with this indicator alone and get the maximum out of the market. If you are a new trader, just open your chart window
FREE
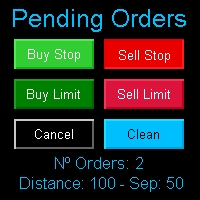
Multi Pending Orders The expert advisor "PendingOrders" is an automated trading program. This advisor manages multiple pending orders, setting entry levels, stop loss (loss limit), and take profit (profit limit) for each order. You can set various separation levels between each order. MagicNumber: It is a unique number used to identify orders related to this expert advisor. DistancePips: It is the distance in pips from the current price at which the pending orders will be placed. DistanceSeparat
FREE

Classic Range BreakOut Expert Advisor "The opening range breakout strategy is a logical and repeatable strategy that involves traders building firm market direction biases after price breaks above or below the market defined opening price range of a session"
You can select the number of bars and width in pips. Works in all pairs. RECOMMENDED: test first in a Demo account for 1 or 2 weeks.
FREE
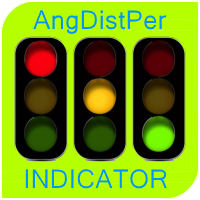
The oscillator indicator " AngDistPer " is one of a series of three calculators of the angular deviation of the price chart of a trading instrument.
INPUT PARAMETER: DRAWs =128 - Number of bars to display the indicator in the chart history; DistPER =14 - calculation period of the indicator in the number of bars.
The values of the indicator indicators are degrees . The presence of a Strong price Movement begins with a value of +-45 degrees, and can not exceed +-90 degrees.
A Good Trading Rese
FREE

The Buffer Reader will help you to check and export the custom indicators buffers data for your current chart and timeframe. You can select the number of buffer and historical bars to read/export. The data can be exported in a CSV format and the files will be stored in the folder: \MQL4\Files .
How it works Put the number of buffers to read in the Buffers_Total input parameter. Put the number of rows to display in the Rows_Total. Choose the CSV separator in the parameter. Copy the correct name
FREE
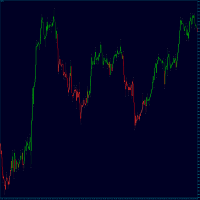
TrendFinder RSI are Colored candlesticks showing the trend based on The Relative Strength Index (RSI) This indicator will give you the color change on the next bar on the confirmation candle and will never repaint TrendFinder RSI is optimize to trade on any market and to be used trending and None trending markets. For best results use this indicator as an extra tools after you have completed your regular analysis and use it for alerts based on such analysis.
FREE

Features:
This is a slope indicator for TMA Bands indicator. It calculates slope of the center line. It supports 3 types of TMA Bands: TMA True (Non-repaint) Fast Line TMA (Repaints) TMA+CG (Repaints) It will help you determine whether price is Trending or Ranging based on the Threshold you set. Download extra TMA Indicators for strategy here: https://www.mql5.com/en/blogs/post/758718
How It Works: You can set the Slope Threshold for indicating Buy/Sell heightened levels. Suppose we set Thresh
FREE
This indicator is about candle countdown timer
You can change timer color 3 colors can be set for different time range You can set font size, you can set font name If you need anything extra, ping me, I will add that functionality. Thank you :) Always open to feedback and criticism if it helps me provide you more value. - Rahul
My other indicators you may like
[I have been trading forex for last 6 years and i publish every indicator that i build for my personal use so everyone can benefit]
FREE
This indicator allows to hide OBV (on all MT4 timeframes) from a date define by the user with a vertical line (Alone) or a panel (with "Hidden Candles"). Indicator Inputs: Apply To Information on "On Balance Volume" indicator is available here: https://www.metatrader4.com/en/trading-platform/help/analytics/tech_indicators/on_balance_volume ************************************************************* Hey traders!! Give me your feeds! We are a community here and we have the same objective....
FREE

The GJ_H1_220100009_S_HD_CF_SQX_SL20 is an algorithmic trading strategy for MetaTrader, tested on GBPJPY using the H1 timeframe from April 1, 2004, to April 24, 2024. There is no need to set up parameters, all settings are already optimized and fine-tuned.
Recommended broker RoboForex because of EET timezone.
You can find the strategy source code for StrategyQuant at the link: https://quantmonitor.net/gbpjpy-macd-trader/
Key details are:
Parameters
MagicNumber: 220100009
Main Chart: Cu
FREE
Expert Advisor of Cross two moving averages accompanied by stop loss, take profit, martingale and multi timeframes on each moving averages. You can change all the parameters contained in the moving averages
Please use as appropriate, hopefully can be useful and assist you in the transaction Don't forget to give a review if this product helps you
MA Method 0 = simple 1 = exponential 2 = smoothed 3 = LW
FREE

The End Point indicator is an indicator that predicts that the tired trend should now return. In this indicator law, we can easily understand that the trend which is in constant or continuous decline should now be reversed. to With these signals the user starts the trades.
Our Popular Products Super Oscillator HC Cross Signal Super Cross Trend Strong Trend Super Signal Suggestions Recommended time interval: M30, H1 Run with at least 20 pairs. Operate with a maximum of two pairs. For every coupl
FREE

Advanced Easy Martingale An easy to use martingale EA with advanced parameters and well designed handles to manage and reduce risk. Also known as - Buy & Sell martingale - 2 way martingale - little martingale
Key info Works on any pair (recommend 1 Hr Chart) Consider starting with EURJPY, GBPUSD, and GBPJPY Recommended capital: $4k - $5k per chart, based on starting lot size of 0.01 Sample set files (higher risk: download ; lower risk: download ) Use it at your own risk, use capital you
FREE

The Candle High Low Exit indicator uses the highest high and the lowest low of a range to draw trailing stop lines (orange under buys, magenta over sells) that advance with the trend until the trend changes direction. Moreover, the trailing stop lines are generated to support the order’s trend direction (long or short): In an upward trend, the long trailing stop line (orange line under buy) appears and advances upward until the close crosses under the line.
In a downward trend, the short trai
FREE

The indicator calculates a combination of two moving averages and displays their trend in derivative units. Unlike traditional oscillators, the maximum and minimum values in this indicator always correspond to the number of bars you want to track. This allows you to use custom levels regardless of volatility and other factors. The maximum and minimum values are always static and depend only on the initial Bar review settings.
The indicator can be used as an independent trading systemtrading
FREE

FlatBreakout (Free Version) Flat Range Detector and Breakout Panel for MT4 — GBPUSD Only FlatBreakout is the free version of the professional FlatBreakoutPro indicator, specially designed for flat (range) detection and breakout signals on the GBPUSD pair only.
Perfect for traders who want to experience the unique fractal logic of FlatBreakout and test breakout signals on a live market without limitations. Who Is This Product For? For traders who prefer to trade breakout of flat ranges (breakout,
FREE

PLEASE TAKE NOTICE: This indicator is in current development. final version will be free.
This is a simple indicator that uses 3 timeframes in its formula to create Possible buy and sell signals. This indicator is optimized for the M1 timeframe Only. It has 2 types of Alerts: Push Notifications Audio Alerts UPDATES:
3/19/24: Still testing the final code
Troubleshooting: When loading the indicator, if you don't see the arrows on the current chart that means that MT4 has not loaded all the high
FREE

Automation for setting up Stop Loss, Take Profit and Trailing Positions can be opened with all platforms MetaTrader 4 MetaTrader Android MetaTrader iOS MT4 Web Trader The Expert Advisor will arrange Trailing of trades Market Execution Pending Order (Buy Stop, But Limit, Sell Stop, Sell Limit)
Input Parameters (all in pips) Take Profit - take profit value. Stop Loss - stop loss value. Trailing Start - trailing start. Trailing Step - trailing step/stop. Lock Start - lock start (first time trailin
FREE

本EA设计用于监控开仓时的滑点,和平仓时的滑点,并以文件形式记录保存。 本EA对记录交易滑点,统计损失,以及评估平台是很有用的。 记录文件保存在MT4数据文件夹中,比如 MT4_Data_Folder\MQL4\Files. 通过菜单栏的 “文件”->“数据文件夹” 进去。 警告 : 不要直接打开文件,否则会影响EA记录,把文件拷贝到别处再打开。 使用方法: 打开图表加载EA即可,只需要加载一个EA。EA会监控所有品种的单子。 参数: Show in brief - 如果是true,EA显示最近5单开仓/平仓的记录,滑点以点数计。 Record File Type - 选择哪种格式的文件,TXT 或者CSV,我建议用TXT 开仓滑点记录示例: 文件名是Slippage Monitor(60249928)-open.csv. Prior Time Ticket Symbol Type Lots Prior Price Open Price Slippage Open Time 2019.4.3 04:45 1546535151 CADCHF SEL 0.12 0.749 0.
FREE

This version of the indicator works only in the tick data stream. In this way, we only see the current situation from the moment of launch. I recommend using the classic version Real-Time Currency Valuation . The indicator calculates currency strength of eight major and also can calculate strength of any other currency, metal or CFD.
Main Features It is able to display only the currencies that are currently necessary, thus not overloading you with unnecessary information and notifications. It
FREE

This Expert Advisor analyzes the last candles and determines whether there will be a reversal or a large correction. Also, the readings of some indicators are analyzed (their parameters can be adjusted). Is a free version of Proftrader . Unlike the full version, in the free version of the adviser the initial lot cannot be higher than 0.1, trading pair only EURUSD and also it has fewer configurable parameters. Input parameters
Lots - lot size (at 0, the lot will be calculated from the percentage
FREE
Советник "RSI and MA filter" торгует по индикатору RSI, использует фильтр в качестве двух средних скользящих (быстрая MA выше медленной MA - покупка, продажа - наоборот), по желанию Пользователя применяется мартингейл (количество умножения лота при серии убытков ограничивается), безубыток, трейлинг стоп, инвертирование сигнала. Настройки советника: Индикатор RSI: RSI_Period = 14; используемый период индикатора
RSI_Shift = 1; номер свечи выбранного графика, с которой советник берет сигнал, 0 -ор
FREE
您知道为什么MetaTrader市场是出售交易策略和技术指标的最佳场所吗?不需要广告或软件保护,没有支付的麻烦。一切都在MetaTrader市场提供。
您错过了交易机会:
- 免费交易应用程序
- 8,000+信号可供复制
- 探索金融市场的经济新闻
注册
登录