适用于MetaTrader 4的EA交易和指标 - 55

Features:
- Moving Average Slope for Max Past Bars - Slope Period - Slope Thresholds - Multiple Slope Type options - See slope visually as a histogram - Info Panel Show/Hide Slope Calculations and Types:
The slope value is calculated using the Slope Period. Suppose Period is 5, it will check the MA value for bar (x) and bar (x+5). And find the slope angle between them.
Read detailed description about Slope Types and Settings here: https://www.mql5.com/en/blogs/post/747651
FREE
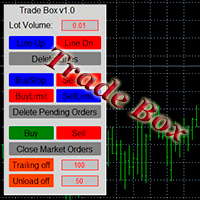
A small trading panel makes it easier for a trader to visually place pending orders, market, as well as trailing and unloading the grid of orders.
It is installed as a regular adviser. Parameters and description:
Lot Volume: 100 - in this field you can set, change the order volume at any time
Line UP - visual horizontal level for pending BuyStop and SellLimit orders
Line DN - visual horizontal level for BuyLimit and SellStop pending orders
Delete Lines - delete all lines from t
FREE

Unlock Instant Pattern Recognition with Our Advanced Trading Indicator Are you looking to instantly spot key candlestick patterns like Engulfing, Doji, Marubozu, Harami, Hanging Man, Shooting Star, Evening Star, Hikkake, Dark Cloud Cover, or Black Crow as they form? With this powerful indicator, you can monitor all 28 currency pairs in real time and get instant alerts whenever one of these crucial patterns is detected. Key Features: Real-Time Alerts: Instantly know when any of the key candlestic
FREE

The Elsna ATR is a custom MetaTrader 4 indicator that combines two key features into one clean chart overlay: Average True Range (ATR) Display Calculates the current ATR value for the selected period (default = 14). Can show the value in pips or price units . Candle Countdown Timer Displays a live countdown showing how much time remains until the current candle closes. Updates every second, even when the market is quiet. This indicator helps traders quickly gauge market volatility
FREE

The Trading Sessions indicator is a simple tool that helps to highlight a specific trading session. For example, it can be used to differentiate the European, American or Asian sessions.
Main features The indicator shows a user-defined trading session. Alert notifications for the start and end of the session. Custom session time. Works on every timeframe (M1, M5, M15, M30, H1, H4, D1, W1, MN). Customizable parameters (Colors, alerts...). It can be used for creating EA. Available for MT4 an
FREE

Alerts utility issues notifications when orders are opened, closed and removed, as well as when the price touches the selected graphical objects on the chart. The utility supports all graphical objects used in graphical analysis and features a simple graphical interface. Once launched, the indicator works in the background, does not take up space on the chart and does not consume system resources. Tracking order status.
If tracking order status is enabled, the utility automatically checks order
FREE

Общие сведения Для начала торговли достаточно небольшого депозита. Идеален для быстрого разгона депозита!!! Подходит для мультивалютной торговли. Невосприимчивость к большой задержке и величине спреда.
Принцип работы После запуска советника на графике советник запоминает уровень открытия первого ордера. Выше уровня открытия первого ордера советник выставляет сеть ордеров на Sell . Ниже уровня открытия первого ордера советник выставляет сеть ордеров на Buy . Если общая прибыль ордеров на покуп
FREE

Precision Pulse: High-Conviction Trend-Following Indicator Product Overview Precision Pulse is an advanced, multi-factor trend-following indicator engineered to deliver high-probability trade signals by rigorously aligning the long-term trend, short-term momentum, and overbought/oversold conditions. It minimizes market noise and whipsaws by requiring all foundational components to converge before generating an entry signal. Signal Mechanics: The Core of Precision Precision Pulse ensures trade q
FREE
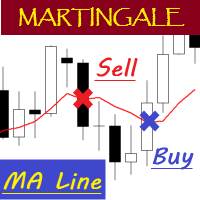
EA "MA Line" with martingale feature
To see how EA works, please watch the video below. In the video, I perform parameter optimization and do a backtest. The parameters that are optimized are: - MA Period - Stop Loss - Take Profit
For the future, I will try to optimize and test EA, especially the expert advisors in the mql5 community. hopefully it can be useful for colleagues in the mql5 community.
FREE

This indicator is designed to detect the best divergences between price/MACD and price/RSI. MACD and RSI produce by far the best divergence signals therefore this indicator focus on those two divergences. This is the FREE version of the indicator: https://www.mql5.com/en/market/product/28375
Important Information How you can maximize the potential of the scanner, please read here: www.mql5.com/en/blogs/post/718074
The free version works only on EURUSD and GBPUSD! This indicator scans for you u
FREE

MACD Trend FREE is Expert Advisor for EURJPY based on MACD Indicator . You can completely edit settings of MACD Indicator, TakeProfit, StopLoss and TrailingStop. Default paramters are optimized for best results. But you can test other settings for antoher currency pairs or timeframe. MACD Trend FREE has been tested from year 2003 to 2021 . My test used the real tick data with 99,90% accuracy. Doesn't use Martingale or other dangerous strategies.
Recommendations
Symbol: EURJPY Timeframe:
FREE

准备好加速您的交易游戏了吗? Bullish Wave 是一款全自动交易软件,可为您提供成为盈利交易者所需的优势。 借助强大的分析、实时市场数据和直观的工具。
借助 Bullish Wave,您将能够像专业人士一样毫不费力地在外汇市场上进行交易。 我们的全自动 EA 使用两个行业领先的指标:Bears Power 指标和 ADX 指标。 借助我们集成的止损和获利功能,开仓比以往任何时候都更快、更安全。 停止犯错,开始像专业人士一样使用 Bullish Wave 进行交易!
专家测试了 2020 年 1 月 1 日至 2023 年 1 月的 EURUSD M15 历史数据(在 MT4 上进行了 3 年回测)。
确保您已在 MT4 平台上正确下载了 EUR USD - M15 时间范围的历史记录。
在您的真实帐户上激活它之前,请自行测试。
特征: 欧元兑美元 M15 入场手数:最少 0.1 止损:128点 止盈:132 点 最低账户:1000 - 2000 $ 最大点差:20 点 账户杠杆 - 1:500。 终端 - MetaTrader4 推荐:
EAMagic - E
FREE

交易实用必备工具指标 波浪自动计算指标,通道趋势交易 完美的趋势-波浪自动计算通道计算 , MT4版本 完美的趋势-波浪自动计算通道计算 , MT5版本 本地跟单复制交易 Easy And Fast Copy , MT4版本 Easy And Fast Copy , MT5版本 本地跟单复制交易 模拟试用 Easy And Fast Copy , MT4 模拟账号运行 Easy And Fast Copy , MT5 模拟账号运行 强烈推荐趋势指标, 波浪的标准自动计算 和 波浪的标准自动计算MT5版本
合作QQ:556024" 合作wechat:556024" 合作email:556024@qq.com" 专业EA指标定制编写.
指标用于显示历史交易路径,方便大家看到本货币对的交易情况.
FREE
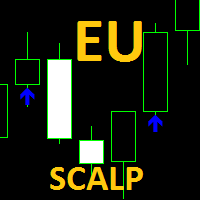
带警报的剥头皮指标:
EU Scalp 指标是两个工作集的组合,第一个预设与价格走势相反,第二个根据价格波动或突破发生的概率与价格走势方向相反。重要的贸易水平。
默认设置针对 EurUsd 货币对 M5 Timeframe 进行了优化,更多设置可以在第一条评论的“评论”部分找到。
如果您想获得预期的结果,以及交易水平值,图表上会显示手数建议。交易水平也以线的形式绘制在图表上。
该指标预设为在价格达到其中一个活跃交易水平时发送警报,箭头指示买入(蓝色)或卖出(红色)以及何时应该关闭订单。仅当出现新蜡烛并且最后一根蜡烛的主体已突破交易水平时,才会激活订单警报。
可以在我的卖家资料中找到像此指标一样工作的专家顾问,可用于进一步优化或实时交易。 如果将文件复制到“专家”文件夹中,则可以使用策略测试器测试 EU Scalp 指标。使用价格和图表注释中的建议手数计算潜在利润。
FREE

Moving averages change on the move. The indicator automatically selects the period for calculating moving averages. The more directional the movement, the longer the averaging period. When the trend slows down, the period of the moving averages decreases and they become faster. This allows you to react faster to a trend change.
The indicator works well in a trend or at a trend reversal point. In the sideways direction, the indicator can be used the other way around, for example, when a fast m
FREE

A Swing Failure Pattern ( SFP ) is a trade setup in which big traders hunt stop-losses above a key swing high or below a key swing low for the purpose of generating the liquidity needed to push price in the opposite direction. When price 1) pierces above a key swing high but then 2) closes back below that swing high, we have a potential bearish SFP . Bearish SFPs offer opportunities for short trades. When price 1) dumps below a key swing low but then 2) closes back above that swing low, we have

Mantis Shrimp Convergence (MSC) A new way to see market momentum — no lag, no confusion.
What is MSC? Mantis Shrimp Convergence (MSC) is a powerful non-repainting oscillator, inspired by the logic of MACD but rebuilt for modern trading: zero lag, no false divergences, and dual-line precision. Designed for traders who demand clarity, speed, and reliability, MSC reveals momentum shifts with unmatched visual and structural accuracy.
How it Works MSC uses two signal lines — Fast and Slow,
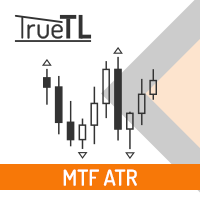
Highly configurable Average True Range (ATR) indicator.
Features: Highly customizable alert functions (at levels, crosses, direction changes via email, push, sound, popup) Multi timeframe ability Color customization (at levels, crosses, direction changes) Linear interpolation and histogram mode options Works on strategy tester in multi timeframe mode (at weekend without ticks also) Adjustable Levels Parameters:
ATR Timeframe: You can set the lower/higher timeframes for ATR. ATR Bar Shift: you
FREE
MA交叉指标 (自动优化MA)
该指标会在指定的K线/柱数范围内,自动选择最优的移动平均线(MA)周期。
它会寻找能带来最大收益,或能提供最佳盈亏比的组合。 工作原理: 买入信号: 快速MA自下而上突破慢速MA。
卖出信号: 快速MA自上而下跌破慢速MA。 指标会测试不同的MA周期,选择最优组合并显示在图表上。
在交叉点会显示对应的收益信息。 主要功能: 自动优化MA (按收益或按盈亏比)。
在图表上直接显示所选的移动平均线。
可选记录所有测试过的组合。
在交叉点显示收益文字标记。 参数设置: Period (100–2000根K线): 用于寻找最佳交叉的范围。
Refresh period TF: 重新计算组合的时间间隔。
MA method: 移动平均线的计算方法。
Find better MA method (较慢!): 遍历不同的计算方法以寻找最佳 (运算量×4,可能降低速度)。
MA price: 用于计算MA的价格类型。
The best ratio of wins/losses (true/false): 若为true — 按胜/负比率寻找;若为false — 仅按最大
FREE

The DrawdownProtector is a custom MetaTrader 4 (MT4) EA designed to manage floating losses in trading accounts. Let’s break down its key features: Floating Loss Management : The EA monitors the account’s floating profit and loss (P/L). If the floating loss exceeds a user-defined threshold (default: $100), the EA takes action. Order Closure : When the floating loss surpasses the threshold, the EA closes all open orders. It ensures that no further losses accumulate beyond the specified limit.
FREE

Trading robot “OsloAlligator” (Version #3)
Description:
Trading robot “OsloAlligator” is an automated assistant for trading using Alligator, Fractals and ATR indicators to execute trades on the MetaTrader 4 platform. This version implements dynamic lot size calculation.
Functionality:
Strategy based on SMMA and ATR:
The robot uses SMMA and ATR to determine entry and exit points.
Alligator periods can be adjusted depending on market conditions.
ATR is used to determine volatility and sele
FREE

The principle of this indicator is very simple: detecting the candlestick pattern in H1 timeframe, then monitoring the return point of graph by using the pullback of High-Low of H1 Candlestick and finally predicting BUY and SELL signal with arrows, alerts and notifications. The parameters are fixed and automatically calculated on each time frame. Example:
If you install indicator on XAUUSD, timeframe H1: the indicator will detect the reversal, pullback, price action on this timeframe (for exam
FREE

X-axis lines prevail in grid manner, ruled by Average True Range. There’s an inevitable change in specific periods of time of this matter! The Average True Range (ATR) indicator is not directly based on volume; instead, measures volatility in price movements. This indicator original in its revealing customization, stretches, expand, shrink, and evolve with 4 timely choices of grid states! MATR means “multiplying average true range” in which grandeurs the grid pip-distant levels, seeming to g
FREE
This EA opens a buy sell order based on the H4 trend. When the price goes over 100 pips ea keep opening orders against the price until the profit is positive and EA will close all orders and continue the new round. Requirement - Flatform: MT4 - Symbol: XAUUSD. - Time frame: M15 - Minimum deposit: >500$ - Leverage: 1:500 and higher - ECN broker - Virtual Private Server hosting (VPS) Parameters
FREE

Having to check constantly if your CCI has reached a specific level can be tedious and draining at times, especially if you have to monitor different asset classes at a time. The Alert CCI indicator will assist in this task, ensuring that you get the most with little effort. When the CCI values get to a specified level, the alerts will go off, on the chart, on the MT4 phone app or via email (You can receive text messages to your phone if you activate texts on your Gmail account). The indicator d
FREE

当市场与您的交易相反时,保护您的帐户免受追加保证金的影响。
使用Mar,网格,平均时管理风险。它们不再是危险的,而是可以控制的
使用此EA实用程序伴随每次MT4安装
当交易不利时,此EA可以保护您的资金:
最大的金钱损失, 最大提取/股本损失百分比, 您的最低资产净值达到 那些先到达
交易简单,直接,强大
在货币选项卡之一中安装此EA,它将监视来自交易终端的所有交易。
简单,轻巧且非常有用
Dāng shìchǎng yǔ nín de jiāoyì xiāngfǎn shí, bǎohù nín de zhànghù miǎn shòu zhuījiā bǎozhèngjīn de yǐngxiǎng. Shǐyòng Mar, wǎng gé, píngjūn shí guǎnlǐ fēngxiǎn. Tāmen bù zài shì wéixiǎn de, ér shì kěyǐ kòngzhì de shǐyòng cǐ EA shíyòng chéngxù bànsuí měi cì MT4 ānzhuāng dāng jiāoyì bùlì shí, cǐ
FREE
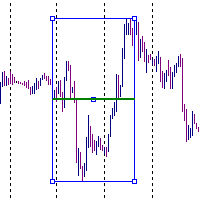
It is just an alternative fibo lines, because mt4 have is a very strange drawing of fibo lines A simple Box (Rectangle) graphic element with adjustable levels binding: it is possible to specify up to 17 custom levels, all rectangles on the chart with the given prefix in their name are processed. Levels are specified in % of the height of the rectangle. A convenient graphical element for analyzing charts by growth-correction levels. Enjoy your work!
FREE
Description
The base of this indicator is an ZigZag algorithm based on ATR and Fibo retracement. This indicator is not redrawing in sense that the ZigZag's last shoulder is formed right after the appropriate conditions occur on the market. The shoulder doesn't change its direction afterwards (can only continue). Note: An indicator with advanced possibilities is also available.
Indicator input parameters
The input parameters allow to change the sensitivity of the ZigZag. ATR period ATR multip
FREE

Heiken Ashi Button Heiken-Ashi , often spelled Heikin-Ashi, is a Japanese word that means "Average Bar." The Heiken-Ashi approach can be used in conjunction with candlestick charts to spot market trends and forecast future prices. It's useful for making candlestick charts easier to read and analysing patterns. Traders can use Heiken-Ashi charts to determine when to stay in trades while the trend continues and close trades when the trend reverses. The majority of earnings are made when markets a
FREE

EA BUMAN may not have a high frequency of entries, but it can provide stable profits. The entry logic is quite simple. It only uses one moving average line.
It enters trades when the candlestick crosses the Exponential Moving Average (EMA) line. If the closing price of the candlestick is above the moving average line, a BUY entry is executed. If it is below the moving average line, a SELL entry is executed.
To increase the profit-taking win rate, it is important to effectively use the Break Ev
FREE

ON THIS LINK YOU CAN FIND NEW VERSION https://www.mql5.com/en/market/product/53022 https://www.mql5.com/en/market/product/53022
/-/-/-/-/- /-/-/-/-/- /-/-/-/-/- /-/-/-/-/- /-/-/-/-/- /-/-/-/-/- /-/-/-/-/- /-/-/-/-/- /-/-/-/-/- /-/-/-/-/- /-/-/-/-/- /-/-/-/-/- /-/-/-/-/- /-/-/-/-/- /-/-/-/-/- /-/-/-/-/- /-/-/-/-/- /-/-/-/-/- /-/-/-/-/- /-/-/-/-/- /-/-/-/-/- /-/-/-/-/- /-/-/-/-/- /-/-/-/-/- /-/-/-/-/- /-/-/-/-/- /-/-/-/-/- /-/-/-/-/- /-/-/-/-
FREE

本EA设计用于监控开仓时的滑点,和平仓时的滑点,并以文件形式记录保存。 本EA对记录交易滑点,统计损失,以及评估平台是很有用的。 记录文件保存在MT4数据文件夹中,比如 MT4_Data_Folder\MQL4\Files. 通过菜单栏的 “文件”->“数据文件夹” 进去。 警告 : 不要直接打开文件,否则会影响EA记录,把文件拷贝到别处再打开。 使用方法: 打开图表加载EA即可,只需要加载一个EA。EA会监控所有品种的单子。 参数: Show in brief - 如果是true,EA显示最近5单开仓/平仓的记录,滑点以点数计。 Record File Type - 选择哪种格式的文件,TXT 或者CSV,我建议用TXT 开仓滑点记录示例: 文件名是Slippage Monitor(60249928)-open.csv. Prior Time Ticket Symbol Type Lots Prior Price Open Price Slippage Open Time 2019.4.3 04:45 1546535151 CADCHF SEL 0.12 0.749 0.
FREE

"Elvis Ultra" automatic expert Advisor has almost universal settings for different currency pairs. Two options of settings for D1 and M5 charts are offered. You can download them in the product discussion. They are optimized for the USDZAR currency pair. It was on her Advisor showed good results. For other currency pairs, you need to choose several upper parameters, which depend on the volatility and spread of a particular pair. It is recommended to install the EA on two charts at the same time.
FREE
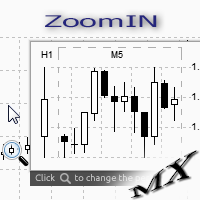
The ZoomIN indicator is designed for quickly viewing the selected bar on the smaller timeframes in a pop-up window. Once launched, the indicator works in the background, does not take up space on the chart and does not consume system resources. When the indicator is activated by the Shift + i combination (can be changed in the settings), a pop-up window with a chart of a smaller timeframe is created. The displayed timeframe can be changed by a left-click on the magnifying glass icon. To hide the
FREE

//+------------------------------------------------------------------------+ //+------------------------------------------------------------------------+
简单交易面板,应部分朋友建议,现更新为2.1版本。
//+------------------------------------------------------------------------+
//---更新如下:
1 价格显示参考系统自带面板样式对部分价格数字进行了放大处理。 2 交易手数上次已成功交易使用的手数。
FREE

Indicator overview Trend indicator usage Moving averages. Highest quality alerts that need no introduction. It is completely loyal to the original algorithm and uses other useful features.
Easy to trade Carry out all kinds of notifications It's not a new paint and it's not a back paint. Setting Indicator SSMA50 in Time frame H1 for any pair currency and Gold Spot. EMA200 in Time frame H1 for any pair currency and more than EMA250 for Gold spot. Using it for maximum benefit Set up notificatio
FREE

This indicator shows in a subwindow the trend in M1, M5, H1, D1 timeframes based on MA, MACD, Stochastic This way you could see in once in different timeframes what happening. This is my first free indicator. Please follow I will put here some more. Thank you for you attention. . . . . .
lfknglkslksnlgslgnsflgjrpoesv ,msv lkrjpfjésmdg sd.npo4wsmdglknsp4jwpkeégmfs.lkmp Thank you
FREE
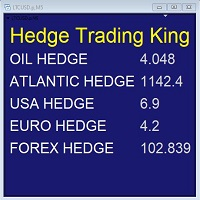
Hedge Trading Monitor e' il mio indicatore che monitora a colpo d'occhio la differenza o il ratio tra due asset utili per fare Hedge trading.
Come si utilizza + scaricare l'indicatore + applicare l'indicatore su un grafico aperto + si possono cambiare gli asset agendo nelle impostazioni.
Distribuzione + e' distribuito solo su MQL5.vom + licenza gratuita (FREE)
FREE

ApexTPGrid is a powerful Trade Management Utility designed to professionalize your grid and averaging strategies. Whether you trade manually or use other EAs, this utility takes control of your open "basket" of orders to manage them to a safe exit. The standout feature is the Swap-Aware Logic . We all know the pain of holding a grid for weeks, only to close at "breakeven" and realize negative swaps ate your capital. ApexTPGrid solves this by automatically calculating all accumulated costs (Swap
FREE
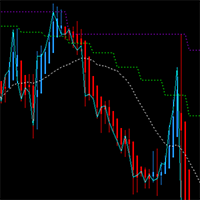
This MT4 chart trend checker cuts through the noise of market volatility to provide a clearer picture of trends and price movements. It includes the following features that can provide more clarity during market assessments: 1 customizable multi-period moving average Optional Heikin-Ashi candles 3 switchable focus modes Distinct colors for easy analysis
Link to MT5 version: https://www.mql5.com/en/market/product/106707/
This indicator shows your preferred moving average from multiple time fram
FREE

This indicator allows to analyze a chart using the rule of supple and demand. You will see zones of sales and purchases and determine the most profitable points to open positions. The indicator is based on the principle of market fractality. Chart zones show places where a strong buyer or seller has made the price reverse and change its direction. The indicator has several types of zones calculation. Color and type of zones displaying are set as desired. The zone width can be displayed in pips.
FREE

This EA is a free version of Vino EA . Unlike the full version, the parameters cannot be changed and the lot size is set to 0.01.
Description Vino EA is a grid Expert Advisor using mainly customized oscillators to analyze the market prices and volatility in order to identify trend reversals. It uses a grid of orders which increases the lot size only after the stop loss is reached. It includes an automatic stop loss, which computes the stop loss value based on the volatility of prices.
Require
FREE

SmartDataExportEa – 面向 MetaTrader 4 的数据导出工具
EA 说明 SmartDataExportEaMT4 是一款专门为 MetaTrader 4 设计的数据导出工具。该 EA 不执行任何交易,而是专注于以 CSV 格式导出市场数据和主要指标。对于想要简化数据分析和策略开发的交易者和开发人员来说,这是一个理想的解决方案。
与实时分析的结合 如果在实时环境中导出数据,CSV 文件可能会被锁定,从而难以在运行 EA 的同时进行分析。为了解决这个问题, 此工具特意采用了 “近似实时方式获取历史数据” 的机制,因此不会锁定 CSV 文件。这样就能够进行类似实时的分析。
主要特性 项目 详情 功能 可将历史数据及主要指标值导出到 CSV。 支持的品种 适用于 MetaTrader 4 上所有可用的货币对和交易品种。 支持的周期 可选择任意时间周期(例如 M1、H1 等)。 导出内容 OHLC 价格、RSI、MA、MACD、ATR、ADX、Stochastic、布林带等。 账户类型 可在 MetaTrader 4 各类账户类型上使用。 数据更新频率 以用
FREE

MACD仪表盘面板 该指标可帮助您扫描Market Watch窗口中的交易品种并根据MACD过滤趋势。
移动平均线趋同散度(MACD)是一种趋势跟踪动量指标,它显示了证券价格的两个移动平均线之间的关系。通过从12个周期EMA减去26个周期的指数移动平均线(EMA)来计算MACD。
该计算的结果是MACD行。然后在MACD线上方绘制MACD的为期9天的EMA,称为“信号线”,它可以触发买入和卖出信号。当MACD越过信号线上方时,交易者可以买入该证券;当MACD越过信号线下方时,交易者可以卖出或做空该证券。移动平均趋同散度(MACD)指标可以用几种方法来解释,但更常见的方法是交叉,散度和快速上升/下降。
它显示了单个窗口中每个时间帧的MACD趋势。您也可以通过单击值来打开图表
FREE

Hello, trading champs! I trust you are doing well. Have you experienced entering a position where the market initially moves in your favour or approach your takeprofit then suddenly the market reversed opposite your position? Well, it has happened to me numerous times and today I decide to fight back.
I present to you a trade manager that help you protect your position(s). This project helps you set your position(s) to breakeven either when a certain amount of pips you specify is reached or a
FREE

The MACD_stopper_x2 indicator shows where the trend has a tendency to stop or reverse. It uses the standard MACD indicator and a proprietary formula for processing data obtained from MACD. There are 2 types of stop/reversal signals: Small cross - probability of a trend stop/reversal is 70-80%; Large cross - probability of a trend stop/reversal is 80-80%; If there are open trades (for example, BUY) on the symbol the indicator is attached to, and the BUY trend ends, the indicator sends push notifi
FREE

Note: This is a Limited Edition of Lion Grid . It works only on Mondays.
The trading strategy has been been created by using machine learning algorithms to build a model directly from the historical data. Machine learning is an application of artificial intelligence (AI) that provides the ability to automatically learn and improve from experience without being explicitly programmed. The strategic focus of this robot is to identify trend reversals by analyzing multiple technical indicators (
FREE

1. Make sure you trade only with GBP/USD on an 1h chart as this model is built specifically for the hourly Cable trading. 2. If you are backtesting the EA during weekends, make sure to specify a reasonable spread (such as 30 or 50) instead of using current spread because the market is not trading and the current spread may be some awkward number. During weekdays, feel free to use current spread as it is the correct current spread value. 3. If you want to have an even more stable-performing EA,
FREE

Discover our brand-new Expert Advisor (EA) designed for the MetaTrader 4 (MT4) market: IT Parabolic EA .
This innovative EA harnesses the powerful Parabolic SAR strategy to provide you with an efficient way to maximize your operations in the financial market.
Key features :
Parabolic SAR Strategy : Our EA utilizes the Parabolic SAR strategy, a recognized approach in technical analysis. By relying on the reversal points generated by Parabolic SAR, it identifies trading opportunities to enab
FREE

QuantumAlert CCI Navigator is a free indicator available for MT4/MT5 platforms, its work is to provide "alerts" when the market is inside "overbought and oversold" regions in the form of "buy or sell" signals. This indicator comes with many customization options mentioned in the parameter section below, user can customise these parameters as needful. Join our MQL5 group , where we share important news and updates. You are also welcome to join our private channel as well, contact me for the pri
FREE

该指标的想法是以蜡烛的形式绘制 RSI,可以与价格图表进行比较以生成买入和卖出信号。该指标不是我的发明。几年前我在互联网上创立了它。我更新了代码,添加了警报功能,添加了 Bermaui Utilities 工具组。
该指标计算用于绘制烛台的所有价格的 RSI(开盘价、最高价、最低价和收盘价的 RSI)。它使用它们中最高的来绘制高灯芯的 RSI 蜡烛,使用它们中最低的来绘制低灯芯的 RSI 蜡烛。 RSI 蜡烛的主体位于高点和低点之间。如果开盘的 RSI 低于收盘的 RSI,则认为 RSI 蜡烛看涨。如果开盘的 RSI 高于收盘的 RSI,则 RSI 蜡烛被视为看跌。
如何使用它
您可以在 RSI 蜡烛指标上交易趋势线突破,这将引领价格图表上的趋势,因为动量引领价格。 您可以在 RSI 蜡烛指标上绘制任何形式的经典图表模式,并像使用原始 RSI 一样进行交易。 它可以用作经典的 RSI。如果它穿过超买 (70%),则卖出,如果它穿过超卖 (30%),则买入。 您可以使用 RSI 蜡烛图和价格图表之间的背离来确认您的交易信号。 RSI 蜡烛特点
它不会重新绘制或重新计算其结果。 它适用于加
This EA has no stop loss. All risks are at your discretion.
This is Free EA, It can make you profitable if you use it carefully. Please don't ask for the MQ4 file, I'm using it to develop other robots.
Gegenpressing EA is a fully automatic Expert Advisor for Scalping Trading on XAUUSD timeframe M1 but also in others. The basic strategy starts with Market order in Trend Following, so this EA Follow the Trend . M1 Trend…. very very fast.
If you like this EA and want to help me develop
FREE
In the dynamic world of trading, visual acuity is paramount for making informed decisions. For traders who struggle with color blindness—a condition that affects approximately 5-10% of males and a much lower percentage of females—distinguishing between buy and sell signals can be particularly challenging. Recognizing this unique challenge, we are proud to introduce “Open Buy Sell Color”, a MetaTrader 4 script designed to enhance visual clarity for all traders. This tool offers customization o
FREE
Is Zero Lag profitable? Not always, different system is for different pairs. You can play around with this indicator from Mladen, I have modified it with Bollinger Bands over T3.
You can change the period and how it calculate. MT5 version is available too.... Please leave a review , it helps us and we will share more indicators. .... Thank you and happy trading
FREE

This Expert advisor has been designed specifically for the EURUSD H1 Foreign Exchange(FX) market to open, monitor, modify and adjusts orders automatically 24/5. Trading with clear and comprehensive entry and exit rules. There is no need to adjust any parameters, simply assign a unique MagicNumber and designated mmLots per trade and GO!
The system logic is based on technical analysis. Every Trade has a fixed Take Profit and Stop Loss set from execution.
Europa utilizes the Keltner Channel in c
FREE

Indicador "Trade Zones: Supply and Demand Opportunities" para MetaTrader: Eleva tu Trading con Precisión Estratégica El indicador "Trade Zones: Supply and Demand Opportunities" es una herramienta revolucionaria diseñada para potenciar la toma de decisiones de los traders al identificar claramente las zonas de oportunidad basadas en los principios fundamentales de oferta y demanda. Este indicador, compatible con MetaTrader, proporciona una visión intuitiva de las áreas críticas del mercado donde
FREE

This EA is a free version of Tiger Grid which is available here: https://www.mql5.com/en/market/product/33835
Tiger Grid EA is an expert advisor using trading strategy which has been developed by using machine learning concepts. It has passed 14 years of backtest of real tick data and real variable spread (with commission) from 2004 to 2018. The entries are usually accurate and in case if the trend signal has a delay the positions will be managed by a smart grid system. This system uses a gr
FREE

Procyon is an automated Expert Advisor that uses the combination of the Ichimoku Kinko Hyo , Candle Patterns and a relatively new Reflex Indicators to identify Spinning Top Candles in Bullish or Bearish patterns. The EA has a hard, fixed Stop Loss and Take Profit. Even though the win rate is a little more than 50 percent, the SL is about half of the TP. So, you will have trades float in high positive sometimes. Recommended pairs and time frames are located in the Comment section.
FREE

Advantages: Based on classic indicators - ATR, Moving Average Determines the trend / flat in the market by coloring the histogram with the appropriate color Arrows indicate confirmed signals It is an excellent filter for channel strategies (by extremes)
Settings:
Наименование Описание настройки Period of Flat Detector Number of bars / candles for analysis Period of EMA Period of EMA (Moving Average) Period of ATR Period of ATR (current timeframe) Coefficient of deviation Coefficient of deviati
FREE

MetaCOT 2 is a set of indicators and specialized utilities for the analysis of the U.S. Commodity Futures Trading Commission reports. Thanks to the reports issued by the Commission, it is possible to analyze the size and direction of the positions of the major market participants, which brings the long-term price prediction accuracy to a new higher-quality level, inaccessible to most traders. These indicators, related to the fundamental analysis, can also be used as an effective long-term filter
FREE

This EA trading by a combination of specific MACD Divergence pattern and indicators signals. Designed to work on EURUSD 1H market. Minimum trading deposit 100 $ . All trades have fixed Stop Loss and Take Profit . No Grid. No Martingale. Works with high spread This EA operates only once per bar opening. Fast methods of strategy testing and optimization are valid. User can test / optimize by model: (control point) / (open prices only) developed and tested from 2005 to release
FREE

Индикатор "Buy Sell zones x2" основан на принципе "остановка/разворот после сильного движения". Поэтому, как только обнаруживается сильное безоткатное движение, сразу после остановки - рисуется зона покупок/продаж. Зоны отрабатывают красиво. Или цена ретестит зону и улетает в космос, или пробивает зону насквозь и зона отрабатывается с другой стороны так же красиво. Работает на всех таймфреймах.
Лучше всего выглядит и отрабатывает на Н1.
Может использоваться как: индикатор зон, где лучше вс
FREE
Description PirDpo is a mean reversion trading robot that works only LONG. It can be used on several indexes like sp500, dow jones 30, eurostoxx 50, dax 30, etc., on a daily timeframe. It basically applies this algorithm: Calculate detrended price with this formula detrend = (close - simple_moving_average(length))/simple_moving_average(length) if detrend <= min(detrend,length) the BUY SELL after timeExit days Key Features Absence of dangerous algorithms. It works just when the bar is closed. Ea
FREE

The ' Average Bar Chart ' indicator was created to showcase the traditional Heiken Ashi calculation as an exotic charting style. This indicator is known for reducing chart noise for a smoother price action. A dditional indicators are recommended
Key Features Candlesticks for OHLC are removed from the chart. Average bars may be shown as complete bars without tails. All functionality and features of this exotic chart are inputs.
Input Parameters Chart Timeframe = PERIOD_CURRENT; - period to set
FREE

我在学习 Rob Smith 的 TheStrat 时创建了这个简单的指标,发现它非常有用,我想与您分享。如果您觉得它有用,请查看我在 MQL5 上发布的其他指标。 该指标只是在图表上绘制一条线,显示您从较高时间范围内选择的价格水平。 使用设置,您可以完全控制它显示的时间范围,但默认 情况下,它会自己计算更高的时间范围,只是将刻度向上移动一级。例如,如果您打开 H1 图表,它将显示 H4 图表中的数据。
设置
跟踪时间表 选择绘制价格水平的时间范围。如果您将其保留为当前的默认设置,它将为您选择合适的时间范围。如果您正在查看图表并在时间范围之间进行更改,这将非常有用,因为该线将始终向上调整。 跟踪值 您可以从以下标准价格值中选择一个。默认为开盘价。 PRICE_CLOSE 收盘价 PRICE_OPEN 开盘价 PRICE_HIGH 期间最高价 价格_低 期间最低价 PRICE_MEDIAN 中位数价格,(高 + 低)/2 PRICE_TYPICAL 典型价格,(最高价+最低价+收盘价)/3 PRICE_WEIGHTED 加权收盘价,(最高价+最低价+收盘价+收盘价)/4
FREE

Советник Strong Storm, это робот торгующий мартином от уровней перекупленности/перепроданности. Определяет зоны по Стохастике, при грамотном ММ отличный основной робот. Реализовать с помощью этого советника можно любую торговую идею на двух Стохастиках.
Параметры TakeProfit – тейк-профит в пунктах; Magic – Мэджик ордера; Lot – размер лота; Slippege – проскальзывание; Distence – дистанция между ордерами; Mult – множитель лота; ZoneBuy – зона покупки ; Zone Sell – зона продажи; Com – ко
FREE

Ultimate Super Rejection Zones is a powerful MT4 indicator designed to detect accurate intraday reversal points using a combination of: Previous Day High & Low Midline equilibrium zone Rejection candle patterns Double-layer confirmation using two Stochastic filters Smart alert and arrow system Daily auto-reset filtering Optional trend filter using Moving Averages The indicator helps traders find high-probability reversal entries at premium and discount zones.
It automatically marks: ️ Sell Reje

或“MAC”。 这是一个旨在帮助您捕捉和交易趋势的指标。这个指标背后的想法可以在接下来的步骤中解释:
画一个快速移动的平均信封。 画一个缓慢移动的平均信封。 MAC Upper Band 是两个包络的高值之间的最高值。 MAC 下频带是两个包络的低值之间的最低值。 MAC 直方图云填充两个波段之间的距离,以显示方向的变化。 蓝云表示上升趋势,而红云表示下降趋势。 阅读下一篇博客,了解如何使用 MAC 缓冲区构建您自己的 EA 或扫描仪:
https://www.mql5.com/en/blogs/post/734293
如何使用 MAC
使用 MAC 云作为过滤器来帮助您识别趋势方向。 使用您常用的交易工具在 MAC Clouds 的方向上进行交易,只是为了尽可能地消除错误信号。 使用建议的进入箭头可帮助您找到强大的趋势点作为起点。 MAC 功能 MAC 不会重新绘制或重新计算其结果。 它适用于加密货币、股票、指数、石油、黄金和所有时间范围。 声音、电子邮件警报和移动通知。 买入、卖出箭头有助于识别趋势信号。 精心设计的参数可帮助用户轻松地在它们之间导航。 建立自己的专家顾

This Expert Advisor identifies trend reversals based on fractals and some other indicators. It is a free lite version of Three fractals Brief description of the trading strategy: when the fractals were formed after a prolonged fall, and the last fractal did not update the minimum of the previous bar's lower fractal, then a trend reversal is determined (at the same time, there must be a fractal in the middle, which is higher than the others). Similarly, opposite for growth. In case other indicato
FREE

NEW VERSION of Gemini: Changes with signal combinations, SL/TP values and amount of pairs and TF’s available. Please make sure you download V 1.1 and ONLY use set files for each pair and TF given! Signal has been updated with this new version. Gemini is a complex Expert Advisor that uses Awesome Oscillator closing bar price, ATR Ranges and Bar Pattern combinations for opening trades with managing and closing trades based on Bollinger Band Width Ratio’s. Though the algorithms are consta
FREE
MetaTrader市场是一个简单方便的网站,在这里开发者可以出售自己的交易应用程序。
我们将帮助您发布您的产品,并向您解释如何为市场准备您的产品描述。市场上所有的应用程序都是加密保护并且只能在买家的电脑上运行。非法拷贝是不可能的。
您错过了交易机会:
- 免费交易应用程序
- 8,000+信号可供复制
- 探索金融市场的经济新闻
注册
登录