适用于MetaTrader 4的EA交易和指标 - 32

Your Portfolio, Your Rules. Hands-off Investing Tailored To Your Goals. HedgeFlex is an advanced automated trading system that turns market opportunities into profits with no expertise required. Combining institutional-grade algorithms with user-friendly design, it executes high-precision trades daily, optimizing returns while managing risk. Whether you’re busy, inexperienced, or simply prefer a hands-off approach, HedgeFlex delivers financial autonomy at the click of a button. This EA current
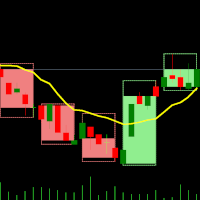
双时间框架指标 – MT4蜡烛嵌套 概述 蜡烛嵌套指标是一款专为MT4设计的多时间框架可视化工具。它将高时间框架的蜡烛叠加在低时间框架图表上,让您可以观察较小蜡烛在较大蜡烛内的表现。此方法改善了市场结构分析,增强了趋势识别,并使价格行为更加清晰——无需切换图表。 工作原理 选择低时间框架:
在MT4中打开您希望分析的时间框架图表(例如:M1、M5、M10)。 应用倍数:
选择一个倍数,动态生成高时间框架的蜡烛结构。 例如: 在M1图表上,倍数为5 → 显示M1蜡烛嵌套在M5蜡烛内。 在M10图表上,倍数为6 → 显示M10蜡烛嵌套在H1蜡烛内。 高时间框架蜡烛的叠加显示:
指标将高时间框架的OHLC(开、高、低、收)直接绘制在当前图表上,最新蜡烛会随着价格波动实时更新。 每根高时间框架蜡烛包含: 外框(高-低): 表示该周期内的最高价与最低价。 内框(开-收): 表示该周期的开盘价与收盘价。 实时更新: 当前活动蜡烛会在周期内动态更新。 如何在MT4上测试 将指标应用到图表:
打开M1(或其他低时间框架)图表,将双时间框架指标拖放到图表上。 选择周期倍数: 默认倍数为5,即在M
FREE

Lot Size Calculator – 仓位计算工具
该指标根据所选的风险百分比和止损距离计算手数。它适用于外汇、贵金属、指数、商品和加密货币交易。
主要功能 基于账户余额 / 可用净值和风险百分比的仓位计算 支持市价单和挂单模式 图表上可视化显示进场、止损和止盈线 风险回报比显示 根据止损距离自动调整手数 图表显示盈亏数值 使用方法 将指标加载到图表中 在输入设置中选择风险百分比 选择风险计算方式(基于账户余额或可用净值) 选择市价单或挂单模式 调整进场、止损和止盈线 使用计算出的手数在交易平台下单 参数说明 风险百分比:0.1% 至 100% 计算方法:基于账户余额 / 可用净值的风险百分比 显示内容:进场、止损和目标线及盈亏数值 该工具为交易者提供了清晰直观的风险管理方法,使仓位控制更加科学合理,适合不同经验水平的用户使用。
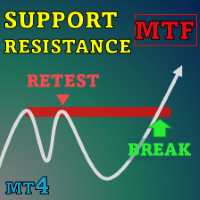
Special offer : ALL TOOLS , just $35 each! New tools will be $30 for the first week or the first 3 purchases ! Trading Tools Channel on MQL5 : Join my MQL5 channel to update the latest news from me 在瞬息万变的金融交易领域,准确识别和分析支撑与阻力位对于做出明智的投资决策至关重要。 SnR Retest and Break Multi-Timeframe 是一个支撑与阻力指标,旨在增强您的交易分析。利用创新的 Timeframe Selector 功能,该工具提供了多个时间框架下的市场动态全面视图,帮助您做出精确的交易选择。 查看更多 MT5 版本请访问: SnR Retest and Break MT5 Multi Timeframe 查看更多产品请访问: All P roducts 主要功能 SnR Retest and Break Multi-Time
该实用程序旨在将信号从 MT4 发送到 Discord。它具有许多独特功能,您不仅可以发送交易信号,还可以执行以下功能: 直接从终端向 Discord 发送消息 发送表情符号和自定义文本 直接从 MT4 终端向 Discord 发送文本和图像 所有这些都允许用户维护一个带有信号的通道,专注于交易和寻找高质量的信号。 Instructions for the utility
完全可定制的消息 信号消息可以完全自定义: 指定您自己的页眉和页脚 在消息底部插入链接 显示顾问或手动订单的评论 支持多种语言 该实用程序支持 14 种语言的消息: 英语 西班牙语 俄语 德语 意大利语 法语 葡萄牙语 土耳其 马来语 中国人 日本人 韩国人 阿拉伯 印地语 翻译特别涉及发送到您的频道的消息。 消息广播功能 该实用程序允许您广播有关以下内容的消息: 开单 关闭订单 订单修改 部分关闭 更改止损和止盈水平 激活挂单 发送交易报告,并可选择按天发送报告的时间表 用户友好的图形界面 该实用程序配备了图形界面,方便用户使用。它正在不断改进和完善。我们祝您使用我们的 MT4 版 Discord 信号实用程序一

XAU Scalper MT4 MT5 版本 一个用于观察黄金货币对 短期价格走势 的分析工具。 XAU Scalper 指标根据 K 线稳定性、RSI 和短期动量提供 买入和卖出信号 。它旨在帮助交易者在 XAU 货币对的短暂市场波动期间确定 潜在的入场点 。 特点 K 线稳定性指数 ( Candle Stability Index ): 衡量 K 线实体与影线的比例,以评估价格行为的可靠性。 RSI 指数 ( RSI Index ): 跟踪相对强弱,指示潜在的超买或超卖情况。 K 线增量长度 ( Candle Delta Length ): 定义分析的近期 K 线数量,以检测方向变化。 信号过滤 ( Signal Filtering ): 可选择避免重复警报,以便进行集中的图表分析。 警报 ( Alerts ): 通过弹出窗口、声音、电子邮件和移动警报发送买入和卖出通知。 使用指南 将指标附加到 XAU 货币对并选择所需的时间周期(推荐 m1–m15 )。 根据市场 波动性 调整 K 线稳定性和 RSI 参数。 观察指标信号,并将其与总体趋势分析或支撑/阻力位相结合。 使用适合快节

变色K线通道指标 这个指标包括两个部分 部分I : 变色K线标 通过变色K线来指示当前市场状况。如果是青色,则是多头市场,如果是红色则是空头市场。 如果颜色正在交替变化中,最好等它变完后,即等K线收盘。 部分II: 通道指标 通道包括内外两层,内层定义为安全区域,外层用了平仓。 交易策略: 如果是颜色是青色,即多头,等价格位于内层通道时开多,价格触及外层轨道则平仓。 如果颜色是红色,即空头,等价格位于内层通道是开空,价格触及外层轨道则平仓。 提示:当且仅当价格位于内层通道时才入场,这点非常重要。
在EA中调用该指标的参考代码 : https://www.mql5.com/en/blogs/post/730475 参数解释 ShowColorCandle --- true 则画变色K线 BullColor ---Aqua.默认是青色,你也可以选择多头颜色 BearColor --- Tomato.默认是红色,你也可以选择空头颜色 AlertColorChange --- true.当颜色完成变换后会有弹窗报警 EmailColorChange --- true.当颜色完成变换后会发

仪表盘的意图是提供配置资产的日、周、月范围的快速概览。在 "单一资产模式 "下,仪表板会在图表中直接显示可能的反转点,从而使统计数据可以直接交易。如果超过了配置的阈值,仪表盘可以发送屏幕警报,通知(到手机MT4)或电子邮件。
使用这些信息的方式有多种。一种方法是,已经完成近100%日均运动的资产显示出逆转的趋势。另一种方法是观察资产,它的波动率与平均水平相比非常低。现在的挑战是如何从这个低波动性中交易突破。
这只是两种可能的策略,对于这些策略,仪表盘可以成为一个重要的辅助工具。发现各种可能性!
关于控件的完整描述,请观看我的博客文章( https://www.mql5.com/en/blogs/post/732999 )。
注意:这个指标不能在策略测试器中使用。所以这里来自市场的演示版本不能使用。请使用该指标的免费版本进行测试: https://www.mql5.com/de/market/product/33913
这是ADR-Dashboard的MT4版本。如果你想在MT5上使用,请到 https://www.mql5.com/en/market/product/527

"Introducing our revolutionary Trading Expert Advisor Robot, your indispensable ally in the fast-paced world of financial markets. Seamlessly combining cutting-edge technology with unparalleled expertise, our expert advisor robot is designed to revolutionize your trading experience and maximize your profitability.
Harnessing the power of artificial intelligence and machine learning, our expert advisor robot analyzes vast amounts of market data in real-time, identifying profitable opportunities
FREE

AlphaPrice MT4 is a trading Expert Advisor (EA) designed for the Forex market and other financial markets via the MetaTrader 4 platform. It is based on a price momentum trading strategy, allowing it to effectively capture strong price movements while minimizing risks during stagnant periods. The EA uses minimal settings, making it easy to set up quickly, and completely avoids risky methods such as martingale and grid strategies. Key Features: Momentum Trading – The EA analyzes market mom
FREE
FREE

Genghis Khan Dominion EA: Conquer the Markets with Unmatched Power Hello Traders! Prepare to dominate the financial battlefield with the Genghis Khan Dominion EA – an unstoppable force combining strategic brilliance with cutting-edge technology. This Expert Advisor is your ultimate weapon for mastering high-frequency trading, bringing the relentless precision and unmatched dominance of Genghis Khan to your trading strategy. Join the Conversation: Telegram Channel for Genghis Khan Dominion E
FREE

I present you the Abella Expert Advisor. The "London breakout" occurs in the European session. During this time, Abella follows the market and enters in one of the direction according to the identified Price Action patterns. The EA works both during a flat and trend. This EA has been created for multicurrency trading. Do not Abella on one pair. For optimal performance, use 4 pairs: AUDUSD, USDJPY, EURJPY, GBPUSD (the H1 timeframe) and create a portfolio.
Parameters Lot - fixed lot; Risk - dynam
FREE
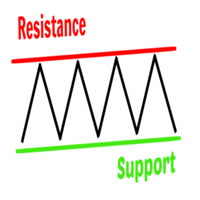
Support and resistance levels are the key factors that determine the price movement from one zone to another. They are levels for trend reversal/breakout signals forex traders look out for before making a trade decision. The Support and Resistance Indicator is a custom trading tool for MT4 developed to plot support/resistance zones from past price actions. The indicator also helps a trader evaluate optimal zones to place a BUY/SELL order or to exit a trade. In other words, it assists traders to
FREE

Simple GoldTrend Signal – 解锁黄金交易成功! 用 Simple GoldTrend Signal 革新您的黄金交易!这款 MT4 杰作融合了尖端的定制 MA、HMA 和动量逻辑,化作耀眼的黄金星形信号,让您轻松捕捉市场变化,无需猜测。无论您是新手还是专家,这款工具都能将您的 XAUUSD 图表变成黄金商机宝库。别只是交易——大获成功! 为什么您会爱上它 清晰信号 :黄金星形警报突出市场关键时刻,轻松引导您的决策。 智能移动平均线 :结合定制 MA 自信判断趋势方向,告别猜测! 先进技术 :隐藏的复杂性(定制 MA、HMA、动量)为您提供可靠的黄金交易洞察。 灵活时间框架 :掌握 M15、M30、H1、H4 和 1D,适应您的策略。 无与伦比的优势 轻松决策 :让定制 MA 和星星为您提供精确的交易支持。 黄金实力验证 :专为 XAUUSD 设计并测试,应对黄金市场的剧烈波动。 节省时间的神奇 :几秒钟分析趋势,留出空间赢取胜利。 适合所有人 :简单设计结合专家逻辑——今天就开始盈利! 输入参数 警报开关 :开启/关闭信号弹出警报(默认:true)。按您的喜好随
FREE

HMA Grid EA is a grid system which analyzes trend based on the Hull Moving Average (HMA) indicator. Unlike the Simple Moving Average (SMA) the curve of HMA attempts to give an accurate signal by minimizing lags and improving the smoothness. This EA proposes two trading strategies which combine a slow period HMA to identify the main trend and a short period HMA to identify short trend reversal movement. This combination make usually sell and buy signals accurate and in case if the trend reverse w
FREE

MetaTrader 4 上可定制化的期间分隔线 内置的期间分隔线功能不允许用户指定时间间隔,所以你可以使用这个指标来创建可定制的期间分隔线。
在日内图表上,你可以在特定的时间放置期间分隔线,你也可以选择在周一的特定时间放置额外的分隔线,以标记一周的开始。
在其他时间周期图表上,该指标的功能与内置的期间分隔线相同。
在日线图上,期间分隔线被放置在每个月的开始日。
在周线图和月线图上,期间分隔线被放置在每年的起始日。
输入 period_separator_hour period_separator_minute period_separator_color period_separator_width period_separator_style week_separator_hour week_separator_minute week_separator_color week_separator_width week_separator_style MT5 版本: https://www.mql5.com/en/market/product/91679
FREE

引入 Awesome Oscillator Alert ,这是一个强大的技术指标,可为交易者提供有关市场动态和交易机会的宝贵见解。凭借其全面的功能和用户友好的界面,该指标是希望在市场上获得优势的交易者的必备工具。
Awesome Oscillator Alert 的突出特点之一是它与所有货币对和时间框架的兼容性。无论您是交易主要货币对还是外来货币,该指标都可以无缝集成到您的交易策略中。此外,用户友好的界面允许轻松自定义参数,确保您可以定制指标以满足您的个人交易偏好。
实时警报是成功交易的一个重要方面,而 Awesome Oscillator Alert 可以精确地提供它们。您将通过弹出窗口、声音和移动警报接收即时通知,让您随时了解重要的进入和退出信号。这种实时反馈使您能够及时做出交易决策并利用市场机会。
该指标提供两种可靠的交易策略:飞碟策略和零线交叉策略。飞碟策略识别直方图列中的模式,根据特定条件提供清晰的买入和卖出信号。另一方面,零线交叉策略着重于震荡指标与零线之间的相互作用,指导交易者何时进场或出场。
借助 Awesome Oscillator Alert,您可以依赖

The Simple ICT Concepts Indicator is a powerful tool designed to help traders apply the principles of the Inner Circle Trader (ICT) methodology. This indicator focuses on identifying key zones such as liquidity levels, support and resistance, and market structure, making it an invaluable asset for price action and smart money concept traders. Key Features Market Structure : Market structure labels are constructed from price breaking a prior swing point. This allows a user to determine t

The statistical indicator for the metatrader 5 TradingStatisticPro collects statistical data on your trade, which makes it easier to assess the effectiveness of trading, the profit received and the risks. The indicator is compactly placed in the corner of the main chart of the terminal and displays the following information: 1. The profit earned. 2. Maximum drawdown. 3. The recovery factor. 4. Profit factor. 5. The ratio of profitable and unprofitable transactions (winrate). 6. Average profit a
FREE
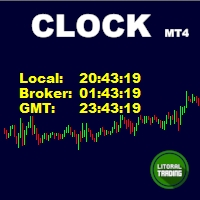
Simple indicator that draws the market hours on chart (broker, local and GMT). Functions: Horizontal distance - from border. Vertical distance - from border. Color - text color. Font - text font. Size - text size. Corner - which chart corner will be drawn. Show seconds - show or hide seconds. Draw as background - candles front or back. Label local - text before local time. Label broker - text before broker time. Label GMT - text before GMT time. Object ID - identification from object
FREE

The Silent Edge of Smart Money
"It's not about how much you do, but how much love you put into what you do that counts." – Mother Teresa
They say the real money in trading is made in the shadows—where inefficiencies hide and only the most perceptive capitalize. That’s exactly where the Arbitrage Thief Index (ATI) thrives. For years, this tool has been my personal advantage , silently identifying low-risk, high-reward trades before the crowd even notices. It’s the kind of edge top fund managers

It would be good to always be aware of the "struggle" between buyers and sellers. Then it would be much easier to determine the best direction to go in order not to lose out. This indicator offers an original solution to this problem: the supply and demand values are compared with the High and Low prices for the selected period, thus trying to determine the market movement towards the stronger side without ignoring the strength of the opposite side. All this is displayed in a separate window usi

MT4Phoenix — 多周期突破智能交易顾问(MetaTrader 4) 推荐交易品种:XAUUSD MT4Phoenix 自动化实现一个简单的趋势延续策略。它先在更高周期评估方向性偏好,再在较低周期等待突破信号。下单时使用预设风险与所选的退出方式。 运行方式(概览) 方向检查(高周期): 基于 EMA 关系决定何时允许做多。 入场检查(执行周期): 识别最近的摆动高/低;突破该水平后允许入场。 风险定量: 根据每笔交易的目标风险和计算得到的止损距离确定持仓手数,并遵循经纪商的最小加减手步长。 退出管理: 可在波动率目标与规则型平仓(二者其一)间选择;当 EMA 关系转向不利时平仓。可选:追踪止损与部分止盈。 主要特性 周期: 可分别选择方向周期与执行周期。 入场: 在方向允许时,突破最近摆动水平入场。 出场: ATR 目标(用户自定义倍数),或 在所选周期上的 EMA 反向信号平仓。 可选追踪止损:ATR、百分比或点数。 可选按 R 倍数进行部分止盈。 风险控制: 固定金额或账户余额百分比风险;最小/最大手数;点差与保证金检查;经纪商止损/冻结水平处理。 日志: 将K线事件、方向

Indicator. Zones of support and resistance levels The most reliable tool in the hands of any technical analyst is support and resistance levels.It is these levels that magically work in the market, because the price then bounces off them, on the contrary, gaining maximum acceleration, punching them and striving for a new price point.However, in practice, many beginners face enormous difficulties in building them.This is due to the fact that the price may react quite differently to them, and ofte
FREE

THE_____ IIIREX_CLAW_vs_CLUSTER_EAIII______ Set1: Price Offset 100, Stopp Loss 100-1000, Take Profit 2000
Set2: Price Offset 200, Stopp Loss 100-1000, Take Profit 2000
Set3: Price Offset 100, Stopp Loss 100-1000, Take Profit 1000
Set4: Price Offset 200, Stopp Loss 100-1000, Take Profit 1000
Set5: PriceOffset 100-1000 (Recomment 200) higher is lower Risk, Stopp Loss 500 Take Profit 1000, 2000, or 3000 it is the same Target
Set it to your Moneymanagement
Indize: DE40
“IC Market” Recomment
FREE

With this easy to set up indicator you can display and set alerts for the following candlestick formations: Bull Breakout, Bear Breakout, Hammer, Pin, Bullish Engulfing, Bearish Engulfing. I'd appreciate if you would review the indicator
Input parameters: ShortArrowColor: The color of the Arrows, displaying a Bearish candle formation LongArrowColor: The color of the Arrows displaying a Bullish candle formation BullishEngulfing: Disabled/Enabled/EnabledwithAlert BearishEngulfing: Disabled/Enab
FREE
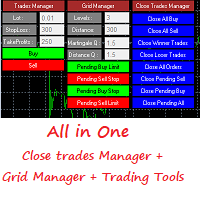
This is a demo version . Download the full version from this link https://www.mql5.com/fr/market/product/84850
Full version Allows you to : Set the number of levels (trades). Lot size and you can do Martingale to raise the lot size for each level. Set distance between levels, and you can manage the distance for each level using Distance Q. Static TP and SL for each level. You can open : BUY STOP / BUY LIMIT / SELL STOP / SELL LIMIT (levels in one click). Close all buy orders. Close all s
FREE

Gold Frenzy FX USES THE TREND WAVE INDICATOR AND IT CAN IDENTIFY THE BEGINNING AND THE END OF A NEW WAVE TREND MOVEMENT.
AS AN OSCILLATOR, THE INDICATOR IDENTIFIES THE OVERBOUGHT AND OVERSOLD ZONES.
IT WORKS GREAT TO CATCH THE SHORT TERM PRICE REVERSALS AND USES A MARTINGALE STRATEGY TO CLOSE ALL TRADES IN PROFIT.
USE DEFAULT SETTINGS ON H1 OR HIGHER TIME FRAME ON ANY PAIR FOR MORE ACCURATE TRADES
WHY THIS EA :
Smart entries calculated by 3 great strategies The EA can be run on even a $2
FREE

Introducing a sophisticated BreakOut and RecoveryZone tool designed to empower traders in any market scenario, facilitating the optimization of trade opportunities.
The core strategy revolves around executing price breakouts using BuyStop and SellStop orders to achieve specific profit targets in dollars. Notably, traders can manually set the BuyStop and SellStop levels by simply clicking and dragging lines on the chart (FixedZone=true is required).
For swift market entry, you can drag
FREE

Based on famous and useful indicator - Super Trend, we add some features to make this Indicator much easier to use and powerful. Ease to identify the trend of any chart. Suitable for both Scalping & Swing Better to use in the trending market be careful in sideway market, it might provide some fake signals Setting: ATR Multiplier ATR Period ATR Max Bars (Max 10.000) Show UP/DOWN node Nodes size Show Pull-back signals Pull-back filter ratio Period of MA1 Mode of MA1 Period of MA2 Mode of MA2 A
FREE

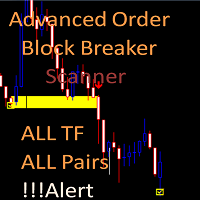
With this system you can spot high-probability trades in direction of strong trends. You can profit from stop hunt moves initiated by the smart money!
Important Information How you can maximize the potential of the scanner, please read here: www.mql5.com/en/blogs/post/718109 Please read also the blog about the usage of the indicator: Professional Trading With Strong Momentum This FREE Version of the indicator works only on EURUSD and GBPUSD. The full version of the indicator can be found here:
FREE

机构流动性压缩指标 该指标通过布林带宽度、成交量和平均点差的标准化测量,实时检测流动性收紧情况,以识别价格突破前的压缩阶段。 显示方式:
专业独立窗口,包含“Compression Score”柱状图与“Threshold”阈值线。 主要特点 早期检测: 在价格波动前识别压缩区域。 多因素测量: 结合布林带宽度、成交量与平均点差的标准化数据。 实时更新: 每个行情跳动(tick)即时刷新。 清晰显示: “Compression”柱状图与虚线“Threshold”参考线。 兼容性: 适用于 MT4 与 MT5 平台。 使用方法 将指标添加至目标品种图表。 根据波动性与交易时段调整阈值与权重。 解读: 当分数较高时,表示出现流动性压缩,需关注潜在突破。 参数说明 BB_Period / BB_Dev: 计算布林带宽度。 Norm_Period: 近期波动性标准化周期。 Vol_Period: 成交量标准化周期(按 tick 计)。 Spr_Period: 平均点差标准化周期(MT5 使用历史数据,MT4 使用即时代理)。 Weight_Width / Weight_Volume / We

Some short but nice algo giving signals and some ideas for stops. Five moving averages are used to find cross overs and create a zone. All periods and methods are adjustable but default values are optimized already. If you have lags on long history you can reduce MaxBars to make it work faster. Please comment if need to explain the parameters. Also any improvement ideas are welcome.
FREE

''Trendlines'' is an Indicator, that every Trader need and shows Trendline and Support and resistance levels in all Timeframe's. Also In 1-hour, 4-hour and daily time frames and Current timeframes, support, and resistance levels are specified and trend lines are drawn so that the trader can see all levels on a chart. In Properties it is possible to turn off unnecessary Lines.
In ' Tendency indicator '' , as full package of Predictions that every Trader need, there is also the Predict
FREE

"VirtualDealer" EA is a multitasking solution that uses advanced order management functions to automate and optimize FX trading. This latest version 3.1 implements a smart trading strategy that seamlessly switches between virtual and real orders while responding to market fluctuations. In particular, the appeal of this EA is its "virtual order management function." Using virtual orders, it simulates market trends in advance and finds entry points. Only if the market moves as planned, these virt
FREE

The robot was created based on CCI (Commodity Channel Index) logic, and it is a very stable Expert Advisor (EA). It is optimized for XAUUSD (gold) by default, but you can run it on any currency pairs. Take Profit : 10 pips Stop Loss : 90 pips Grid Order : Every 5 pips All orders are closed when the total profit in dollars reaches a certain amount or when each individual order hits its take profit.
FREE

The Expert Advisor of the Forex Fraus is designed for scalping the EURUSD (for five-digit quotes) and adapted for the accounts with fast execution of orders.
Operation Principle When a signal is received, the orders are opened by accumulation using tick data; The robot does not apply indicators and other analytical systems. The signals are calculated using H1 and M1 chart processing results; The EA has three operation modes; Normal : uses the filter for trend trading; Turbo : uses the filter th
FREE

* All Symbols x All Timeframes scan just by pressing scanner button ** *** Contact me to send you instructions and add you in "Candle Scanner group" for sharing or seeing experiences with other users. Introduction: Candles tell their story. When looking at a candle, it’s best viewed as a contest between buyers and sellers. Candlestick patterns are used to predict the future direction of price movement. Candlesticks are an easy way to understand the price action. You can use candlesticks to decid
FREE
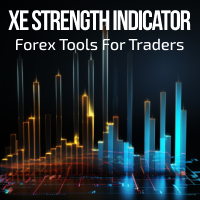
XE Forex Strengh Indicator MT4 displays visual information about direction and strength of a signal for current pair and chosen timeframes (M5, M15, M30 and H1). Calculations are based on multiple factors and results are shown as a colored panel with scale bar, numerical values and arrows. There are also displayed values of current price and spread on the pair. There can be activated an alert (as a mail or pop-up window with sound) for each available timeframes which send a message when the dir
FREE

龙舌兰 TequilaEA 交易策略说明文档 一、基本信息 名称 :TequilaEA 版本 :1.0 适用品种 :XAUUSD(黄金 / 美元) 适用周期 :M1(1 分钟图表) 开发商 :Tulip Financial Technology 二、核心交易逻辑 该 EA 基于技术指标组合和价格形态识别进行交易决策,核心逻辑如下: 趋势判断 通过 MACD 指标(参数 12,26,9)判断整体趋势方向: 当 MACD 主线>0 时,判定为多头趋势 当 MACD 主线<0 时,判定为空头趋势 入场条件 多头入场 : MACD 主线>0(符合多头趋势) 价格连续 15 个 M1 周期收于 MA1(10 期)、MA2(20 期)、MA3(30 期)均线上方 空头入场 : MACD 主线<0(符合空头趋势) 价格连续 20 个 M1 周期收于 MA1(10 期)、MA2(20 期)、MA3(30 期)均线下方 订单管理规则 最大同时持仓订单数:3 单(多空方向一致,反向订单需先平仓) 订单间隔:相邻两单开仓时间至少间隔 1440 分钟(24 小时) 方向切换机制:开新方向订单前,自动平掉所有
FREE

Detailed blogpost: https://www.mql5.com/en/blogs/post/766378
Key Features
Adaptive Upper/Lower bands Smooth Center Line Customizable Length (sensitivity) Non-Repainting (only current ongoing bar is updated every "Refresh After Ticks" number of ticks) Multiple Price Sources - Choose from close, open, high, low, median, typical, or weighted close Components:
The Basis Line The smooth center line represents the weighted average of price. Think of this as the "true" price level when all the noise
FREE

This indicator signals about crossing of the main and the signal lines of stochastic (lower stochastic) in the trend direction which is determined by two stochastics of higher time frames (higher stochastics). It is not a secret that stochastic generates accurate signals in a flat market and a lot of false signals in a protracted trend. A combination of two stochastics of higher time frames performs a good filtration of false signals and shows the main tendency. The indicator is recommended for
FREE

此多振荡器、多时间框架和多品种指标可识别价格与振荡器/指标之间何时出现背离。它识别常规/经典(趋势逆转)和隐藏(趋势延续)背离。它具有移动平均线、RSI/布林线、ADX、pin bar 和吞没过滤器选项,可以仅过滤掉最强的设置。结合您自己的规则和技术,该指标将允许您创建(或增强)您自己的强大系统。 特征
可以检测以下振荡器/指标的背离:MACD(信号线或主线(直方图))、随机指标、OsMA、RSI、CCI、RVI、Awesome (AO)、OBV、ADX、ATR、MFI、动量和综合指数。只能选择一个振荡器。 可以同时监控您的市场报价窗口中可见的所有交易品种。将该指标仅应用于一张图表,并立即监控整个市场。 可以监控从 M1 到 MN 的每个时间范围,并在发现背离时向您发送实时警报。支持所有 Metatrader 原生警报类型。 该指示器包括一个交互式面板。请参阅 博客 解释。 该指标可以将信号写入一个文件,EA 可以使用该文件进行自动交易。比如 这个产品 。
输入参数
请在此处 找到输入参数的说明和解释。 重要的
请注意,由于具有多时间框架功能,该指标不会在已安装指标的图表上绘制

The Price will increase every 2 weeks. Final Price 999 USD THE DESTROYER EA – Annihilate the Market. Conquer the Challenge. (Battle Tested Logic) THE MISSION The market is a battlefield. Only the disciplined survive. The Destroyer EA was not built to "participate" in the market—it was built to dominate it. Designed specifically for the grueling conditions of Prop Firm Challenges (FXIFY, FTMO, MFF, etc.) , this algorithm combines the lethal precision of the "D-Strategy" (EMA 21/55 Cross) with an

H I G H - P R O B A B I L I T Y - B R E A K O U T T R E N D L I N E I N D I C A T O R This is no ordinary trendline indicator. It has a highly-probability algorithms incorporated in the script to display only trendlines that may give a very high chance of price breakout. The indicator is not a stand alone indicator. Trader should interpret it together with their very own analysis technique to come up with a more efficient trading strategy. You can use with it other trend indica
FREE
Classic ZigZag formula. But no lags and repaints. You can see on screenshots that it shows values between peaks and it is useful to test strategies based on indicator. Because sometimes people find a good idea about it but don't understand that repainting indicators have some things to keep in mind. The parameters are the same as original ZigZag indicator: Depth, Deviation and Backstep.
FREE

对于那些使用趋势线、矩形和文本等元素进行技术分析的人来说,VR 颜色级别是一个方便的工具。可以直接向图表添加文本并截取屏幕截图。 设置、设置文件、演示版本、说明、问题解决,可以从以下位置获取 [博客]
您可以在以下位置阅读或撰写评论 [关联]
版本为 [MetaTrader 5] 一键点击 即可使用该指标。为此,请单击带有线条的按钮,之后光标下方将出现一条趋势线。然后,通过移动光标,您可以选择 行位置 并通过再次单击来修复它。 该指标的特点 是,样式和颜色的所有更改都会自动保存,并随后应用于所有 新创建的 图形对象。 该指标配备了两个独立的按钮,用于设置不同样式的趋势线,两个独立的不同样式的矩形,一个具有自己风格的文本字段以及一个用于创建屏幕截图的按钮。 屏幕截图在 MetaTrader 终端目录的 Files 文件夹中创建,保存路径和文件名写入专家日志中。 大致路径:C:\Users\用户名\AppData\Roaming\MetaQuotes\Terminal\Character set\MQL5\Files\VR Color Levels 有大量类似于 VR Color Le
FREE

至于“ReverseGear EA”的高级交易功能,“Step Up”和“Step Down”功能尤为突出。 这些功能会根据市场价格趋势自动追加订单,是交易者主动从市场波动中获取利润的强大工具。
升压功能 随着价格上涨,此功能会自动执行额外的买单。 我们的目标是通过逐步增加仓位来实现利润最大化,尤其是在趋势持续的情况下。 例如,每次超过某个设定点时,都会触发新的买入订单,以充分利用市场动力。
降压功能 相反,在空头头寸中,每当市场下跌一定数量的点时,就会下达额外的卖单。 这使您能够利用下跌趋势并不断积累利润。 如果市场朝着预期的方向发展,则进一步扩大你的仓位,扩大你的盈利机会。
灵活的资金管理选项 交易者可以将固定手数或账户余额的一定比例设置为风险。 这种可定制的资金管理设置允许每个交易者根据自己的风险承受能力进行交易。
交易结果可视化 通过直接在图表上显示交易结果,EA 帮助交易者立即查看表现并在必要时调整策略。 这一特性极大地提高了分析评估的效率。
丢失恢复功能(Turn) 如果前一笔交易发生亏损,该功能会自动增加下一笔交易的手数,旨在有效挽回损失。 这样可以在暂时损失
FREE

Automatic trading system. It includes three very strict algorithms for finding a reversal on large timeframes. It is installed on any timeframe, but for the quality indicators of the visual panel, it is better to set it to H4, you can set it to H1. Optimized for the USDZAR currency pair.
In addition to the usual settings, it is possible to limit trading by day. If the days 1-31 are set, the EA will trade every day.
The Expert Advisor trades by itself, but it is more profitable to use it as an
FREE

Please check the " What's new " tab regularly for a complete and up-to-date list of all improvements + parameters. FREE indicator for my trading utility Take a Break . This indicator allows you to manage multiple other EAs with just one Take a Break EA instance. Simply specify the corresponding Chart Group in the indicator(s) and Take a Break EA settings and you are good to go.
Setup examples (Indicator + EA)
As a prerequisite, add the URL https://trading.custom-solutions.it to the list of al
FREE
HTF Power of Three (ICT) - MT4 Indicator Overview The HTF Power of Three indicator is a professional implementation of the Inner Circle Trader's (ICT) Power of Three concept, inspired by Larry Williams. This indicator visualizes higher timeframe (HTF) candle development in real-time on any lower timeframe chart, making it an essential tool for ICT traders who study institutional price movement patterns. What is Power of Three (PO3)? Power of Three represents a three-staged Smart Money campa

It is a custom non-repaint indicator to identify trade opportunities in swing action as prices move within an upper and lower band. Inspired by the Keltner Channel, the most popular channel Indicator introduced by Chester Keltner. It is different with a Bollinger Bands. It represents volatility using the high and low prices, while Bollinger's studies rely on the standard deviation. The algorithm for this indicator is also available in the EntryMaximator EA. Including the option to use it or not.
FREE
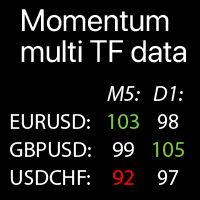
所选交易品种的多时间框架动量值:比较当前市场趋势 该 指标 显示 所有 选定 时间框架 和 交易品种 的 动量指标 值 , 并 将其 整合 到 一个 表格中 , 以便 快速 分析 当前 市场 价格 趋势 。
我的 多功能工具 : 66+ 功能 | 联系我 解决任何问题 | MT5版本 每个 交易品种 都可以自定义:删除/替换。最多可以添加40个交易品种。 面板可以拖动到图表上的任何位置(随意拖动)。
在 设置 中您可以配置: 动量指标设置: 周期,应用价格类型 。 每个时间框架 可以启用/禁用 。 高亮 选项:如果启用 - 关键级别将以自定义颜色高亮显示。 极值(关键级别) : 高值和低值; 警报 : 可以为极值级别启用:高动量 / 低 动量 / 两者。 视觉 样式:大小,深色/浅色主题,高亮颜色。 动量指标 (Momentum) 是一种流行的 振荡器 ,用于衡量资产价格在特定时间段内的变化率。
它帮助交易者识别趋势的 强弱 以及潜在的 反转点 。 动量指标的工作原理: 计算 : 该指标将当前收盘价与N个周期前的收盘价进行比较。 解读: 高于100(
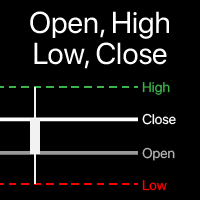
图表上 的 开盘价、最高价、最低价、收盘价 水平 可视化 您 可以 选择 任何 时间框架 , 不仅 限于 当前 时间框架 。 计算 柱的 偏移 可以 调整: 当前 (浮动) 柱, 或 设定 数量 的 回溯 柱 。 多功能工具 : 包含66+功能 | 如有问题请联系我 | MT5版本 在指标设置中,您可以配置: 计算柱的 偏移 : 0 = 当前柱, 1 = 前一个柱, 2 = 前两个柱... " 包含多个柱 "选项:
如果 > 0: 则 多个 柱 将 被 组合 以 确定 最高 和 最低 价格。 计算的 时间框架 。 每个水平(OHLC)可以 单独启用/禁用 。 线条 可视化 : 颜色、样式、大小、背景选项。 额外 信息: 可以禁用; 仅线条价格; 仅线条信息; 两者: 信息 + 价格; 字体 大小和样式(如果启用'额外信息')。 程序文件必须放在" Indicators "(指标)目录中。

VR Ticks 是基于剥头皮策略的特殊指标。借助该指标,交易者可以直接在金融工具的主图表上看到即时图表。分时图表允许您尽可能准确地在市场上建仓或平仓。 VR Ticks 以线条的形式绘制刻度数据,这些线条根据方向改变颜色 - 这使您可以直观地了解和评估刻度的情况。分时图表的优点是它们不考虑时间范围,并且是根据价格变化构建的。 VR Ticks 构建尽可能最小的图表。 设置、设置文件、演示版本、说明、问题解决,可以在 [博客] 中找到
您可以在 [链接] 阅读或撰写评论
[MetaTrader 5] 版本 一个价格变动是一次价格变动。对于一次价格变动,价格可能会改变一个或几个点。重要的是要理解一次 蜱虫是一种运动 。 该指标在右下角显示卖价和买价,以及当前的点差值。指标的程序代码逐笔在 MetaTrader 窗口中构建图表。根据指标设置,图表中的增长时刻可以用一种颜色绘制,价格下跌的时刻可以用另一种颜色绘制。这种方法可以帮助交易者清楚地看到当前趋势的变化。该指标监控每个价格变动,并在图表上显示所有绝对所有价格变动。如果卖价或买价没有变化,指标将构建水平图表。 优点 使用倒卖策略进行交易
FREE

Check my p a id tools they work perfect! "Period Cross RSI" Is a New indicator idea that shows crosses of two RSI lines with different periods which creates ascending and descending zones for confirmation of long and short trading. This indicator is brend new and will be upgraded further, for now I recommend to use it as a confirmation, filter indicator for determination of long/short trading zones, not as a signaler indicator for now. Further upgrades can make it as a signaler indicator as w
FREE

牛市与熊市强度指标 更新 1.3
牛市与熊市指标现在内置了成交量配置文件,用于检测给定柱状范围内最强成交量的区域,可以进一步根据您的设置和偏好进行修改,以便专家检测具有最高成交量的牛市与熊市强度。
这有助于: 早期检测和精准的入场机会 反转检测 回撤检测 概述:
牛市与熊市强度指标是一个多功能且直观的工具,旨在为交易者提供决定性优势。它捕捉牛市和熊市之间的力量平衡,提供市场情绪和动量的可操作见解,适用于任何时间框架或工具。牛市与熊市强度指标允许您看到动量和成交量的峰值区域。它突出了在一个范围内的强势区域。一个真正简单的指标,但功能强大,为您提供一个全面的市场视角,让您能够捕捉强劲的潜在反转。 创作者的讯息 为什么我制作这个指标:
“我已经交易了超过14年,许多交易者愚蠢地认为,如果他们有一个复杂的指标,他们就能赚钱。但事实是,大多数专业交易者使用最简单的指标:移动平均线、布林带、RSI、MACD、成交量……我的目标是制作一个表面上看起来简单的指标。但如果你曾经使用过牛市指标与熊市指标相结合,你会意识到这个组合有多强大。不幸的是,你不能调整这些值,它是固定的,这意味着你错过了看到更

Smarter Trade Manager is an advanced trade management tool that can monitor and manage your manual and EA trades according to the settings you choose. It works as an Expert Advisor (EA), it does not open any trades but it closes trades as per the auto closing settings or when manually pressing any of the close buttons.
FEATURES:
Three-dimensional interactive view of your trades Trade Summary, P/L, Alerts, Closure by Currency Trade Summary, P/L, Alerts, Closure by Magic Number Profit and Loss

Round Numbers Levels indicator for MT4 Round Numbers indicator is a simple but useful indicator to draw 00 and 50 price levels in your chart.
These levels act as supports and resistances, and therefore should be taken into account when trading.
These levels can be used as profit targets or entry points.
Inputs of the indicator are:
TGridColor00: color to be used for xx00 levels GridStyle00: line style to be used for xx00 levels GridWidth00: line width to be used for xx00 levels GridColor50:
FREE

One Click Trade Pro is a tool that allows you to open orders with just one click, choosing all the parameters, including the Magic Number! Useful if you want to quickly submit trades specifying also their Magic Number. Other than submitting new orders you can also see the list of orders (with their Magic Number) and change their Stop Loss and Take Profit. The PRO version also allows you to: Open opposite pending orders Setup and submit orders using lines, for a better visualization
How does it
FREE
Tipu Stops is a simple indicator that plots buy/sell stop loss channels and pips value using commonly used indicators. Tipu Stops also works complementary to the Tipu Trader Panel. You can use the stop loss values from Tipu Stops in Tipu Trader before using the panel for trading.
How to Use Add the indicator to the chart and select your preferred method of stop loss plot. You may choose from the following methods: Average True Range on PRICE_CLOSE. Average True Range bands on Hull Moving Averag
FREE

What is the ADX_DI Indicator? ADX_DI is an advanced technical analysis indicator developed for MetaTrader platform. It combines Average Directional Index and Directional Indicator components to analyze market trend strength and direction. What Does It Do? Measures Trend Strength : ADX line shows the strength of market trends Determines Direction : DI+ (green) and DI- (red) lines identify trend direction Detects Trend Changes : DI+ and DI- crossovers provide trend reversal signals Automatic Alert
FREE

The Donchian channel is an indicator that takes a series of user-defined periods and calculates the upper and lower bands. Draw two lines on the graph according to the Donchian channel formula. This straightforward formula is based on:
The top line is the highest price for the last periods n The bottom line is the lowest price for the last periods n
Trend systems follow periods when support and resistance levels are broken. in this case when the price breaks the upper line or the lower line o
FREE

Arrow Indicator Trade EA is an Expert Adviser who trades based on custom indicators. When the indicator shows an arrow up, EA will enter into an OP BUY order. Likewise, when the indicator shows an arrow down, EA will make an OP SELL entry. Features: 1. Stop Loss and Manual and Auto TP based on the ATR indicator. 2. Auto Lot and Fixed Lot. 3. Close By Loss and Close By Profit features. 4. Target Profit Balance and Minimum Stop Balance 5. Easy to use. EA does not generate its own signals but gener
FREE

本指标的目标是令您快速、全面的查看当前盈利。IceFX 的 ProfitInfo 是一款工具指标,计算并显示图表上品种的实际交易盈利。指标显示按照日 / 周 / 月和年分离,单位点数,货币和百分比。 主要特征: 您可以很容易的调整 IceFX ProfitInfo 来显示当前打开图表指定交易货币对的盈利,甚或整个账户盈利。 可定制在图表上的全部位置。 定制字号。 显示日和月的平均盈利。 MagicNumber 过滤器。 评论过滤器。
FREE

MATrader QuickScalper – 基于 MATrader 核心的精准剥头皮 MATrader QuickScalper 是 Marc Albrecht Trading 开发的专用剥头皮 EA, 作为独立策略与广为人知的 MATrader AI 并行存在。 MATrader AI 更侧重自适应周期逻辑与更大级别的行情波动, 而 MATrader QuickScalp 则专为 快速执行、短持仓周期与干净的剥头皮入场 打造。 它之所以沿用 MATrader 名称,是因为它建立在同样的核心理念之上: 经过验证的逻辑、真实交易条件、拒绝走捷径 。 (我们在将 MATrader 系列发布到 MQL5 之前,进行了多年测试与打磨。 我们最初的 MATrader 上架曾登顶 #1,但后来被移除并重新上传,导致评价与排名被重置。 如果你愿意帮我们回到更高位置,欢迎在认真测试后留下评价。) 优化设置: 交易品种与周期以输入参数为准(剥头皮对环境条件很敏感) 推荐账户: RoboForex 美分账户(支持 0.0001 手) 为什么选择 MATrader QuickScalper? MA
Advanced UT BOT ALERTS for MT4 專業多重濾波趨勢識別系統|強化版 UT BOT 引擎 我們只提供高品質的指標。 Advanced UT BOT 為專業交易者設計,採用穩定的信號邏輯與安全運算結構,確保無延遲與錯誤更新。
它 不會重繪、不會重畫、不會刪除或修改 任何過去的信號。
所有 BUY 和 SELL 信號均在 K 線收盤後生成並固定 ,確保穩定性與準確性。
在即時行情中 不會重繪 ,信號會在收盤後即時出現。
限時優惠中 —— 下一次價格將調整為 49 美元。
請把握現在的優惠價格,售完即漲。 產品概述 Advanced UT BOT ALERTS 是新一代的趨勢信號系統,基於 UT BOT 的核心邏輯重新打造,
全面升級為 MT5 版本,融合多重濾波、動態視覺化與高精度警報系統。
UT Bot 指標最初由 Yo_adriiiiaan 開發,本版本由 PioneerAlgoFX 團隊深度強化,
在穩定性、精準度與自訂性方面均達到專業級水準,為實戰交易者而設計。 此系統能夠高精準地識別趨勢反轉與動能變化,
透過多層動態濾波與

Precision Entry Arrows: Never Miss a High-Probability Trade Again! Stop guessing and start trading with confidence. The Precision Entry Arrows indicator is a sophisticated, all-in-one tool designed to deliver high-quality, non-repainting Buy and Sell signals directly on your chart. It expertly combines the power of MACD , Stochastic , and a unique EMA 5 Cross to pinpoint exact entry moments , then filters everything through a long-term EMA 200 to ensure you are always trading with the major tre
FREE

MT4BTCPro — EMA 均线金叉死叉智能交易系统 仅限几天免费。自 11 月 1 日起价格为 30 美元,并将在每 5 笔购买后上调 30 美元。最终价格 $499 推荐品种: BTCUSD — 30 分钟周期 MT5BTCPro 基于当前图表周期的快/慢 EMA 交叉自动化趋势跟随策略。它按笔控制风险(固定美元或账户余额百分比),设置基于波动率的止损,并通过规则反转、可选追踪止损和可选分批止盈来管理退出。 工作原理(概览) 信号: 快 EMA 上穿/下穿慢 EMA 触发进场(上穿做多,下穿做空)。 初始止损: 按 ATR × 倍数放置,并自动适配经纪商的止损/冻结距离限制。 风险头寸: 按所选单笔风险与止损距离计算手数,严格遵守经纪商最小步长、最小/最大手数及保证金检查。 退出管理: 出现相反 EMA 交叉时可平仓。可选追踪止损(ATR/百分比/点数)与可选分批止盈(按 R 倍数)用于降低风险并锁定收益。 主要特性 EMA 交叉引擎: 默认 12/21 EMA 基于当前周期生成入场与反手。 风险控制: 固定金额或余额百分比;用户自定义最小/最大手数;点差与保证金保护。 波动率
MetaTrader市场是您可以下载免费模拟自动交易,用历史数据进行测试和优化的唯一商店。
阅读应用程序的概述和其他客户的评论,直接下载程序到您的程序端并且在购买之前测试一个自动交易。只有在MetaTrader市场可以完全免费测试应用程序。
您错过了交易机会:
- 免费交易应用程序
- 8,000+信号可供复制
- 探索金融市场的经济新闻
注册
登录