适用于MetaTrader 4的EA交易和指标 - 276

Often it is necessary to analyze the history of order opening/closing on your real or demo trading account, or to take a screenshot of the terminal chart to see how well you or an EA performs. This is where the "Analysis of Orders History" tool comes in. The tool scans the history for all orders with the specified magic number and displays orders on the terminal screen, draws the history of deals opening and closing, and connects them with lines to make them clearly visible. Red arrows represent

Советник Ilan CarMen -это аналог советника, с добавлением множества дополнительных логик и возможностей для торговли, с оставленными настройками советника . Советник торгует по системе Мартингейл с увеличением последующих лотов в серии ордеров, с целью их усреднения. Первый ордер робот выставляет по сигналам встроенного индикатора. Так же советник имеет возможность прекращать торговлю в зависимости от новостей от сигналов новостного индикатора. Ilan CarMen можно использовать либо на одном графи

Forex Kryptonite Kryptonite expert Advisor has no analogues , it was created on the basis of trading experience in the markets for more than 15 years. The EA has good information and shows excellent profitability, but still, at the heart of the EA is the security of the trading account. There are many included trading modules that improve the trading process of the robot and the trader, as well as the ability to connect the news indicator and connect your indicator. The EA has a trading strate

Curiosity 6 The Perfect Wave It is an advanced trading system. This is a fully automatic Expert Advisor, which allows you to presize the trade according to the preferences of the trader. Curiosity 6 have more than 260 customization options for your trade. Different options for different styles of trade. Curiosity 6 The Perfect Wave is a Trend system of trade with different algorithm of trade mode. This EA using signals to place orders. Is a revolution in the customization of the trading. Th
用强货币兑弱货币交易始终是最安全的做法。该指标衡量主要货币之间的相对强度,使工具选择更加容易,进出交易更加容易。基本思想是使用强势货币作为对冲货币来攻击弱势货币,反之亦然。买强反弱,短期买弱反强。 [ 安装指南 | 更新指南 | 故障排除 | 常见问题 | 所有产品 ] 一目了然地找到强弱货币 轻松将一种货币与另一种货币进行比较 货币升值了吗?寻找多头 货币在贬值吗?寻找短裤 它实现了一个多时间仪表板 这是交易的最高品质确认 该指标根本不需要优化 可定制的回溯期 指示器不重涂 解释指标非常容易。它比较了27种货币对的当前价格和以前的价格,并计算了每种货币兑其他所有货币获利或损失的次数。由于只有8种货币,因此最高得分为+7,这意味着相对于所有其他货币获得了一种货币,而最低得分为-7,这意味着相对于所有其他货币而言,该货币损失了。将为每个时间范围计算此逻辑,并将其显示在仪表板中,以帮助您找到所有时间范围内的强弱货币。
重要提示: 该指标在测试仪中不起作用,MT4不支持多币种背书。不要回测。
指标剖析
货币计量器指标评估几种货币对,并以绝对值确定在确定的时间段内哪种货币相对于所有其他货
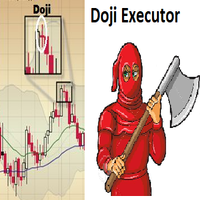
Doji Executor is an expert advisor who works by opening a trading position after detecting a doji candle, according to the doji formation.
Continuation formation bull - doji - bull = buy bear - doji - bear = sell
Reversal formation bear - doji - bull = buy bull - doji - bear = sell
with this ea, you don't need to monitor the chart all day long just to find a doji candle Pair = all pair Time Frame = all time frame suitable for use with brokers who give rebate programs please test first in th

Advisor Stability EurChf, Gbpchf works on currency pairs EurChf, Gbpchf timeframe is m1! In the video below the description of the test with the quality of modeling 99.90%! Please note that the standard quality of modeling on the timeframe is M1 25%! Expert Stability EurChf, Gbpchf works in a calm market, which allows you to avoid poor execution of orders!The principle of work of the adviser is scalping from levels in a calm market!
Please pay attention to the test that all systems have d

Heiken Ashi Trend (EURUSD M30) This EA has been developed for EURUSD M30, e verything is tested and ready for immediate use on real account. This Expert Advisor is based on continuation of TREND by HEIKEN ASHI CANDLES. It uses STOP pending orders with ATR Stop Loss . To catch as much profit as possible there is also a BREAKEVEN functions provided Every Friday at 9:00 pm we are closing trades to prevent weekly gaps.. !!!Adjust these times to your broker time. Preset values are for UTC+2 on

TradingDesk – Performance Analyse MT4
To test the indicator download free Demo version here: https://www.mql5.com/en/market/product/40471
TradingDesk analysed MetaTrader 4 historical data by Symbol, Magic Number, Trade or Comment. All these evaluations will be displayed in real time on your MetaTrader 4 chart window.
All this information will be displayed in the following dashboards: account info General information about the account is displayed in the account info dashboard. performance inf

其中一种强大的分析方法是使用Levy流程对财务系列进行建模。这些过程的主要优点是它们可用于模拟大量现象 - 从最简单到最复杂。我只想说市场中分形价格变动的想法只是Levy过程的一个特例。另一方面,通过适当选择参数,任何Levy过程都可以表示为简单的移动平均值。图1显示了一个Levy过程的示例,其中片段放大了几次。 让我们考虑使用Levy流程来平滑价格图表的可能性。首先,您需要选择Levy过程的参数,以便它可以用于模拟线性过程。然后我们得到一个权重系统,其中包括不同符号的系数。有了这个,我们不仅可以平滑金融范围,还可以跟踪其中存在的反趋势和周期性成分。 通过选择参数 LF 来配置指示器的操作。它决定了故事的深度,并将对其进行分析。此参数的允许值位于0 - 255之间。用于计算的条形数将比此数字多两个。 蓝线表示高价平滑的结果,绿线表示收盘价,红线表示低价。 该指标的主要缺点是根据严格定义的算法执行抗锯齿,该算法没有考虑市场中的急剧和强烈变化。此外,与所有平滑指标一样,存在可以达到简单移动平均值的滞后。

Forex Daily Percentage Calculator Forex Daily Percentage Calculator indicator is created for the Trader who cherishes the discipline of choosing only a percentage of their Trading account balance as profit per trade, per time or day. All you need to do is enter your desired percentage of your account balance, enable the notification popup alert to know when it has been attained so as to get out of the market till another day or trade. This helps the traders who are using it to determine a certai

当在多个时间范围内识别出一个或多个趋势反转蜡烛形态时,此多时间框架和多品种指标会发送警报。它可以用于从 M5 到 MN 的所有时间范围。可以启用移动平均线或 RSI 趋势过滤器以仅过滤掉最强的设置。结合您自己的规则和技术,该指标将允许您创建(或增强)您自己的强大系统。 特征
可以检测以下模式:Pin bar、吞没、镊子、晨星/晚星、三线罢工和三只黑乌鸦/白人士兵。 可以选择要使用的时间范围。 在仪表板内持续执行反转强度等级排序。可以禁用此排序,以便更轻松地找到特定符号。然后,交易品种将按照它们在交易品种参数中输入的相同顺序显示,或者按照它们在市场报价窗口中显示的顺序显示。 通过在矩形内单击,将打开一个带有相关交易品种和时间范围的新图表。 将指标放在一张 M5 图表上就足够了,您将收到来自您选择的任何交易品种的警报。支持所有 Metatrader 原生警报类型。 输入参数
请在此处 找到输入参数的说明和解释。 重要的
指标必须放在 M5 图表上,这是一个干净的图表,上面没有任何其他指标或智能交易系统。该指标将被加载到一个指标窗口,然后您可以将其展开以覆盖整个图表。 请注意,策略测试器不支
This system is based on an individual indicator and allows the constant trading of certain ranges and trends. The drawdrown is limited in this standard system and is not designed for short-term. The Expert was designed for the time units 5 minutes, 15 minutes, 30 minutes or 60 minutes. The system follows the stoploss according to certain rules. These rules are part of the individual indicator. The system is based on an individual indicator that considers various levels and the trend.
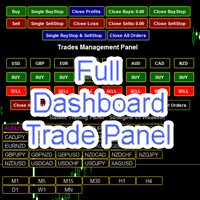
Full Dashboard Trade Panel Utility is built to perform overall task of trades and order managements to make trading an easy task for every trader that bought and using it. It comprises of three sections with each having a shift setting for a convenient placement as desired: 1. Trades Managements Panel 2. Basket Trades Panel 3. Symbol and Time frame Changer Each of these three sections has its own unique functions and roles to perform for a complete enjoyable forex trading ex
Partial Close Wizard Script is a script created to execute a partial close on any already profitable order in order to permanently lock in some part of the profits and reduce the lot size in the process. It can also be used to reduce the loss presently incurring on a trading account by cutting part of the loss and reduce the lot size to save the account from being wiped out. How to use: It is easy to use; just attach it to the chart of the same currency pair you intend to close the part of the p

Kryptosystém automaticky Automatický kryptosystém je v súčasnosti plne automatizovaný so všetkými špeciálnymi vlastnosťami a funkciami, je kontrolovaný a pravidelne monitorovaný. Jeho vývoj, parametre a jednotlivé algoritmy sú odborne vyhodnotené a optimalizované skúsenou vývojovou skupinou programátorov, ktorí vyvíjajú nové aktualizované verzie systému. Na rozdiel od ostatných systémov sme sa zamerali na vytvorenie systému, v ktorom je spätné testovanie úspešných výsledkov zodpovedajúce situ

The principle of the indicator.
The Asummetry indicator allows you to predict the beginning of a change in the direction of trends, long before their visual appearance on the price chart. The author statistically revealed that before changing the direction of the trend, the probability distribution function of the price is made as asymmetric as possible. More precisely, the price movement in any direction always pulls sideways the function of its dist

Agent Zero is a fully automatic Expert Advisor for Extreme Scalping Trading. This Expert Advisor needs attention, in fact presents a High Operating Frequency . Agent Zero is based on continuous openings , these Trades can be filtered with some indicators, Ma and Adx. The expert advisor is able to get a high-profit of winning trades.
Signal : https://www.mql5.com/en/signals/496936
Strategy involved :
Scalping Stop Loss Level of account equity Smart way to open order and close orde

White Shark is a fully automatic Expert Advisor. It can actually outsmart a market by placing BUY and SELL orders when the requirements are met. It uses an advanced technology to place orders in the right time with the right lot. This robot is designed for beginners yet expert traders: Most of the inner parameters are hidden from user so that even a beginner will not mess up. You can download this Ea and back-test. I personally used a 99.9% real tick data for back-testing for an accurate result.
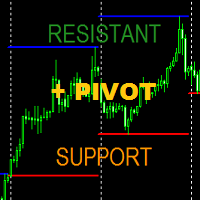
Indicator can drawing Support Level (Lowest price of choosed Time Frame) and Resistance Level (Highest price of choosed Time Frame), and this indicator can drawing last of Pivot Level from the Last of Support Resistance Level. Support and Resistance based Highest and Lowest at choosed Time Frame can be your next good experience for your forex trade to maximize your trade win and lost ratio.
Parameter : _S_and_R__Setup_ , Default is # SUPPORT AND RESISTANT # , No Need To Change Drawin
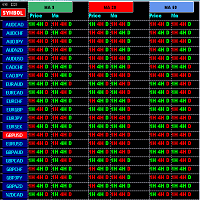
Constantly checking multiple pair & charts during day and still missing trade opportunities ? Let Market scanner do this job and you just focus on analysing opportunities and making trading decisions. Specially developed for need of intraday & scalping Traders . Must have tools for active traders. Market scanner indicator constantly monitors all Pairs from your MT4 watchlist for 9 /20 /50 Moving Average crosses in 1HR ,4HR & Daily Chart along with Closing price of last candle and alerts you if

GBP Strength VAR es un EA para la divisa GBPUSD, que actúa en temporalidad de 5 Minutos. Está construido principalmente en base al Oscilador Awesome y la desviación estándar. Por tanto se busca detectar la fortaleza existente en los movimientos de los precios, y predecir por tanto si existe una tendencia alcista o bajista en el mercado para posicionarse en consecuencia. Con objetivo cortar pérdidas y dejar correr ganancias, el robot tiene Stop de pérdidas, pero no usa profit fijo. No se usan si
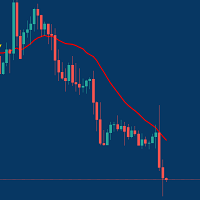
Managing Trades With Moving Average EA : Many Traders like using Moving Averages for trend confirmation , and timing Entry and Exits . With Semi- Automatic Moving Average EA we provide effective way to manage open trades as per your Moving average strategy and uses MA as trailing stop loss. EA considers only closing price of candle therefore avoids stop outs caused by sudden price fluctuations and helps to stay in trend longer. You can decide which MA to use and various settings of MA

EA works with none of the technical indicators. It works on logic, every jump has the reversal, It waits for the jump and on reversal it begins to trade. No standard indicators. No grid trading. No arbitrage. No curve fitting according to back-test results No Hedge Very low Stop Loss Ratio Tested with 99.90% data Modelling quality. Recommendations : Developed for M1, EURUSD ECN Broker with 5 points Settings Spread: Need to be as low as possible. Trailing Status: trailing stop usage option Tr

Hello all How the expert works on the MACD indicator In a way breakthrough level was put in the expert Login to buy or sell With multiplier deals being opened after a number of points All trades are closed together on a 20 pip gain. Parameters: MACD indicator . Lot1: Manual Lot Size Auto_Lot: Set true to automatically calculate optimal Lot Size based on risk preferences, Set False if you want use manual lot size. Max_Risk: Max Risk as percentage of Equity* the greater this percentage is the gre

PINBAR SCANNER PRO with TREND and RSI + CCI OSCILLATORS filter This indicator has been designed to automatically and constantly scan entire market to find high probability pinbar formations, so you can just wait for the perfect trading opportunity come to you automatically.
PINBAR is the strongest candle reversal pattern known in technical analysis. It shows excellent areas to determine potential entries and exits with opportunity to use excellent risk and reward ratios. It includes an RSI and

EA works with none of the technical indicators. It waits for the trend and trade accordingly. No standard indicators. No grid trading. No arbitrage. No curve fitting according to back-test results No Hedge Very low Stop Loss Ratio Tested with 99.90% data Modelling quality. Can work with even $30 USD Recommendations : Developed for M1, EURUSD ECN Broker with 5 points Settings Spread: Need to be as low as possible. Trailing Status: trailing stop usage option Trailing stop: Pips to allow trai

EA works with none of the technical indicators. It waits for the trend and trade accordingly. No standard indicators. No grid trading. No arbitrage. No curve fitting according to back-test results No Hedge Very low Stop Loss Ratio Tested with 99.90% data Modelling quality. Can work with even $30 USD Recommendations : Developed for M1, EURUSD ECN Broker with 5 points Settings Spread: Need to be as low as possible. Trailing Status: trailing stop usage option Trailing stop: Pips to allow trail

Basket trading is very interesting for those who are familiar with it. It is also very profitable if you know your way round BUT can be very destructive to anyone’s account if care is not taken. However, there are Basket traders all around making good incomes with it with ease. What it can do: This utility is created for them to remove the stress of opening trade on each of the currency symbol group. At just a click, it opens the symbol’s entire group of currency pair ORDERS in any of the direct

摘要 使用这款强大的自动化工具,在几秒钟内创建精确、高概率的趋势线。 描述 Trend Lines Master通过自动生成基于已证实方法的精确趋势线,彻底改变了您的技术分析工作流程。不再需要繁琐的手动绘制或对图表模式产生疑虑!这款高级指标利用比尔·威廉姆斯分形来识别关键市场转折点,并以卓越的精确度生成内部和外部趋势线。 严肃的交易者都明白,趋势线是有效技术分析的基础,但在多个时间框架上一致地绘制它们既耗时又主观。Trend Lines Master通过应用数学精确度来识别趋势,解决了这个问题,为您的交易决策提供了显著优势。 主要特点 自动识别并在几秒钟内绘制精确的趋势线 利用比尔·威廉姆斯分形方法定位关键市场转折点 生成内部(保守)和外部(激进)趋势线 有效适用于从M1到月线的所有时间框架 可自定义线条样式、颜色和粗细,以匹配您的图表偏好 当价格接近或突破重要趋势线时提供清晰的视觉警报 即使在繁忙的图表上也能流畅运行的优化代码 购买后包含定期更新和改进 价格 专业级趋势线自动化工具,仅售30美元 - 比一次亏损交易的成本还低!一次性购买,终身更新。 立即升级您的技术分析工具包,加入那

Launch promotion For a limited time only: 30$ instead of 157$ Summary Shows multiple Fibonacci retracements, projections and expansions ratios at a glance Description A Fibonacci confluence level is a price zone where Fibonacci retracements, projections and expansions meet closely when measuring a swing This technique is used by intermediate and advanced traders to detect possible reversal zones Tired of manually drawing the same Fibonacci ratios for the same X, A, B, C points to eventually f

Infinite Storm EA is a safe and fully automated expert advisor that analyzes market trend and price movements and thanks to that is able achieve high rate of winning trades. Every order has StopLoss (either real or virtual) and EA has implemented advanced filtering functions together with spread and slippage protections. This EA does NOT use any of the dangerous strategies like Martingale, Grid or Arbitrage. This EA is fully customizable by user. This EA is not limited by trading pair or time
Scalping Trend Strength в его основе лежит анализ сделок в реальном времени из стакана по етому в тестере он не работает индикатор разпазнает тренд флет пресичением линий указывает направление тренда тлично подходит для скальпинга бинарных и турбо опцыонов на одну свечу и отлично подойдет к вашей стратегии как фильтр или станет хорошим началом для создания собственной стратегии...

Swing Trade Reversal is an automated expert advisor. This expert advisor is based on the trend reversal strategy and is used to evaluate oversold and overbought market conditions. Swing trading is a short-medium speculation based on reading the buying-selling force in the price chart. Trading at a vantage point and having a low risk with a trend reversal pattern. This EA has passed 11 years back test of real tick data (2008-2019)
Key Features
Timeframe: M15
Currency pairs: GBPUSD
Use 4 or 5-d

MoneyMaker v8
Basic information: Trend based strategy Entry is confirmed with the 6 indicators Real take profit and stop-loss Low drawdawn Auto lots Recovery strategy No martingale, no grid, no dumb strategies Optimization is done for current market conditions (2015 and up)
Time frame: M5 Min wallet size: 1000 of your base currency (for better growth at least 2000 is recommended)
General recommendation for any EA: Test this on your demo account before going live.
SET files (for 2.1 version)

Mars 6 is a Oscillators indicator is a powerful indicator of Break Zone for any par and any timeframe. It doesn't requires any additional indicators for the trading setup.The indicator gives clear signals about opening and closing trades.This Indicator is a unique, high quality and affordable trading tool.
Perfect For New Traders And Expert Traders Low risk entries. Never repaints signal. Never backpaints signal. Never recalculates signal. For MT4 Only Great For Scalping Great For Swing T

Renko Charts now have the alerts and the Win-rate . Now you can know which signal will give you that edge your trading needs. Risk to Reward Settings Wins versus Losses Count There are four alert types to choose from for notification on screen, email or phone notification. The alert types also have buffers for use with automation. This indicator can be incorporated with any system that requires renko charts. The four (4) alert types are: Three-bar Formation ; Pinbar ; Marabozu and Engulfing Ba

Night Smart Grid
Night Smart Grid is an expert Advisor working at night (Asian session) according to its own algorithm.
The EA can open from 1 to several orders depending on the market situation in the Asian session.
The EA trades GBPUSD profitably.
Timeframe M15
To trade you need to correctly set the GMT of the broker.
Minimum Deposit 250$, lot 0.01
The parameters of the EA:
Lot; Lots from Deposit - true/false; Max Lots (0-auto); Min Lots (0-auto); % from Deposit; GMToffset; MagicNu
Managing Trades With Trendline EA : Trendline EA is a very good tool for using trend at your advantage & can be used for managing both take profit & stop loss . Can be used in all time frames and uses close price of Candle as stop loss therefore it will close the trade only if candle closes above or below trendline , this function saves traders from wicks and market noise . Where as Take profit is by simple touch of trendline.
check link below for examples :
https://www.noemotionfx.com/

EA works with none of the technical indicators. Just need to set the time of news and it will execute a trade in the direction of the news. Leave it on for daily news and back-test accordingly. Logic: It executes pending orders both buy/sell before news. With news, market moves in one direction and execute one pending order. Trailing stop helps to maximise the profit. Hidden trailing stops are available in this EA to hide your exit level from broker No standard indicators. No grid trading. No a

Introduction
It is common practice for professional trades to hide their stop loss / take profit from their brokers. Either from keeping their strategy to the themselves or from the fear that their broker works against them. Using this indicator, the stop loss / take profit points will be drawn on the product chart using the bid price. So, you can see exactly when the price is hit and close it manually.
Usage
Once attached to the chart, the indicator scans the open orders to attach lines for t

F ully automated Expert Advisor using the advanced algorithm for trading the EURUSD and GBPUSD currency pair. Designed for profit in a short period of time and big profit in a long run.
Prefers EURUSD and GBPUSD. Set up to work on EURUSD and GBPUSD M15. Principle of operation The Expert Advisor uses MACD and MA to open orders. The SELL and BUY orders are opened (depending on the parameters set), guided by signals and the market situation.
Deposit
The expert adviser can run with as l
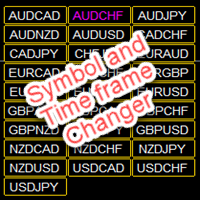
Symbol and Time frame Changer is an indicator created to save the trader from the stress of opening several charts windows on PC by enabling him or her to switch from one Currency pair to another and also be able to switch from one Time frame to another (displays the whole 9 Time frames) with the aid of the buttons on the chart. · You can customize the color of the buttons to your preferred color · You can choose the size you desire for the buttons · You can also choos

This trend indicator shows successful signals. It can be used with an optimal risk/reward ratio. The efficiency rate of the trend is 80%. The product shows the best opportunity to enter the market using the arrows. The indicator can be used for pipsing on small periods, as well as for the long-term trade. The indicator uses two parameters for the settings. The indicator does not redraw and lag. Take profit exceeds stop loss by 6-8 times on average! The product works on all currency pairs and all

Uses 1 trend search strategy by MA, if CCI and WPR are in the desired overbought / oversold range and the price is at a specified distance from MA, then it executes a trade in the direction of the trend. Always uses take-profit and stop-loss, which provide protection of the deposit in case of adverse developments in the market situation. The Expert Advisor does not use dangerous trading methods that can destroy a deposit: grids, martingale, locking, holding without stops. Optimized for EURUSD ti

The indicator tracks the market trend with unsurpassed reliability, ignoring sharp market fluctuations and noises around the average price. This indicator allows you to track the trend and see its beginning, as well as the end, especially when the reversal begins! It catches the trend and shows the favorable moments of entry into the market with arrows. The indicator can be used for pipsing on small periods, and for long-term trading. The indicator implements a variety of technical analysis base

This indicator is for those trading Engulf Candles – Bearish and Bullish. It can also be used in conjunction with another trading system. What it does is that you can use it to measure a candle for a Risk Reward 1: 1 for an easily attainable target. When attached to a chart, it picks on any current candle on the chart but if you want to use it with another candle, you will have to change the ‘0’ default value for current candle in the parameter setting to any value to get the candle position beg
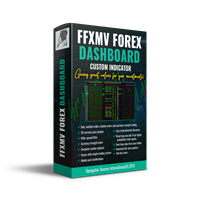
FFXMV Dashboard + CSM is a custom indicator combined with Currency Strength Meter . It is created to give the Traders a full view of what is going on in the market. It uses a real time data to access the market and display every bit of information needed to make a successful trading. Before attaching this Indicator to your window chart, go to your MT4's Market Watch panel and HIDE all the Currency pairs you don't need or trade and leave the rest there. The reason is that FFMV Dashboard will DISP
This LEGIT Indicator Can Accurately Predict the Outcome of One Bar.
Imagine adding more filters to further increase your probability!
Unlike other products, Binary Options PRO can analyze past signals giving you the statistical edge.
How Increase Your Probability
Information revealed here www.mql5.com/en/blogs/post/727038 NOTE: The selection of a Good Broker is important for the overall success in trading Binary Options.
Benefits You Get
Unique algorithm that anticipates price weakness. Gene
Euro Trend es un EA que opera en el par EURUSD,en temporalidad de 15 minutos. Es un robot que busca encontrar puntos de entrada cuando se producen cambios en la tendencia, usando dos indicadores técnicos principalmente, el RSI y el Bull/Bear Power. Para máximizar el beneficio y aprovechar los movimientos fuertes de la tendencia no se usa Profit fijo,dejando así correr las ganancias. No se usan sistemas de GRID,ni martingala,así como estrategias de entrada en las aperturas de mercado,ni moment
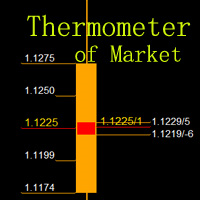
Measure the temperature of the market Like a thermometer .The function of this indicator is to measure the temperature of the market ,it is just like that using a thermometer to measuring water temperature, directly to show where the market is running and where it is likely to reach.
Pivot Point is a resistance and support system. It has been widely used at froex,stocks, futures, treasury bonds and indexes. It is an effective support resistance analysis system. Average True Range(ATR) is

1.this trendscanner is designer for you to judge the trend right now.You will see up arrows and down arrows in the seperate indicator windows!You can place your trade according to the arrows. Up arrow-means trending will go long Down arrow-means trend will go short 2.how to place long orders? You can find a lower place to place the long orders after the up arrow.you can also place orders just when the up arrow appear. 3,how to place short orders? you can find a high place to place the s

GOLD MINER H4 (XAUUSD H4) This EA has been developed for GOLD (XAUUSD) H4. E verything is tested and ready for immediate use on real account. Strategy is based on breakout of the HIGHEST CHANNEL after some time of consolidation. It uses Stop pending orders with FIXED Stop Loss and Take Profit . It also uses PROFIT TRAILING and BREAKEVEN functions to catch from the profits as much as possible. For every candle the pending orders are modified to adapt the market behavior. Everything is alre

为了隔离长期和非随机组件,不仅要知道价格变化了多少,还要知道这些变化是如何发生的。换句话说 - 我们不仅对价格水平的价值感兴趣,而且对这些水平相互替代的顺序感兴趣。通过这种方法,人们可以找到影响(或可能影响)特定时间点价格变化的长期和稳定因素。了解这些因素可以让您做出或多或少准确的预测。 让我们确定我们希望从财务系列的分析中得到什么具体结果: •首先,我们需要强调这一趋势,如果它存在于市场中; •其次,我们需要确定周期性成分; •第三,结果应足够稳定,可用于预测; •最后,我们的分析方法应该适应当前的市场形势。 为了满足指定的条件,我们使用相对价格变化的回归分析,并基于该模型做出指标。该指标的算法基于对历史数据的学习,其工作在交易者的完全控制之下。 LH 是一个参数,用于确定用于平滑金融系列的柱数。其允许值介于0到255之间。 UTS 是影响学习速度和深度的参数。它的值也在0到255之间。如果UTS的值为零,则在整个历史记录中进行学习。在所有其他情况下,训练集会不时更新。更新越频繁,UTS值越小。 该指标的主要缺点是,当平滑金融系列被认为是静止时,这可能会导致一些延迟。
Orders Closing Wizard Script This is an embellishment of the Orders closing script. It will close all manners of orders and in several ways too. Here are the kinds of order closing it can execute according to their names: Close sell orders only: Close buy orders only Close orders with profits only Close orders with loss only Close all buy-stop pending orders only Close all sell-stop pending orders only Close all pending orders at once Close all buy and sell orders at once Close all opened and pe

FIBO DASHBOARD This dashboard lists down multi currency Fibonacci level whenever price hit the level. It draws a Fibonacci Retracement based on daily time frame. It draws arrows, sends pop-up alert and phone notification whenever price crosses Fibonacci levels. This tool is useful for users who trade with Fibonacci. INPUT ON Alert: set to true will pop-up alert whenever arrow appears. ON Push: set to true will send phone notification whenever arrow appears. ON Email:set to true will send email

介绍 H4 趋势外汇交易机器人 - 一个易于使用且全自动的交易机器人,旨在交易 H4 图表以捕捉趋势变动。穿越移动平均线指标产生的买入/卖出信号。订单始终使用虚拟止损、止盈和追踪止损以及随后的硬止损,以防万一发生断开连接以确保资金安全。 特征 没有危险的技术,如鞅、套期保值或任何其他 低回撤 安全稳定的交易 易于优化,专注于 TP/SL 和追踪水平以及指标 虚拟止盈、止损和追踪止损水平 ATR(平均真实范围)计算止盈和追踪止损 风险评估 - 以固定手数或动态头寸大小百分比进行交易(始终推荐动态) ADX 趋势强度过滤器 低初始存款 - 基于账户杠杆 1:400-1:500 的美分账户为 200 美元/20 美元 可在 EurUsd H4 上使用的默认设置 优化 至少 6 个月的时间或多或少足以获得良好的使用设置。 H4 Trend 的默认设置在 EurUsd 上使用高质量 Ducas 复制报价数据进行了优化,并在具有可变点差和滑点、佣金和掉期的“每个报价”上进行了全面测试 - 尽可能接近实时交易!
专家菜单设置 我参考截图 一般如何购买/安装/更新市场产品 https://www.
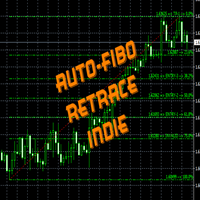
FiboRetrace Indie is a custom indicator created for those using Fibonacci indicator for trading. It enables the traders to use it independently and without limitations. This is created as an automated Fibonacci custom indicator that automatically plots itself when a trader attaches it to his chart, it will scan the chart and locate the recent trend direction either upward trend or downtrend and plot itself the way it should be. So there is no hassles looking for trend direction by the users, thi

TPA True Price Action indicator reveals the true price action of the market makers through 100% non-repainting signals (except early signals mode) strictly at the close of a candle!
TPA shows entries and re-entries, every time the bulls are definitely stronger than the bears and vice versa. Not to confuse with red/green candles. The shift of power gets confirmed at the earliest stage and is ONE exit strategy of several. There are available now two free parts of the TPA User Guide for our custom

Why Selecting our product ?
Our smart system expert advisor calculates a unique Currency Strength detection to select the best currency to trade on the right time. The algo intelligence system will calculates continuously on the live tick market. The parameter provided gives you the flexibility and capability to explore the variability deeply on any highest potential outcome in your trading account.
Strategy involved Currency Strength Meter Smart way to open and close order Automatic Smart Mo

Ace Supply Demand Zone Indicator The concept of supply demand relies on the quantity mismatching between buying and selling volumes in the financial market. Supply and demand zone can provide the good entry and exit. A zone is easier to trade than a line. The supply demand zone can provide the detailed trading plan and the risk management. Its ability to predict market direction is high. There are two distinctive points about Ace Supply Demand Zone Indicator. Ace Supply Demand Zone indicator was

The gravity line indicator to which the price always returns. This is a kind of center of attraction and a magnet for price. Allows you to trade on the trend and on pullbacks. It works on all timeframes, on any currency pairs, metals and cryptocurrency Can be used when working with binary options
Distinctive features Does not redraw its values; Price always returns to the line of gravity; Based on the laws of balance; It has simple and clear settings; It works on all timeframes and on all symbo

Support and Resistance is a very important reference for trading. This indicator provides customized support and resistance levels, automatic draw line and play music functions. In addition to the custom RS, the default RS includes Pivot Point, Fibonacci, integer Price, MA, Bollinger Bands. Pivot Point is a resistance and support system. It has been widely used at froex,stocks, futures, treasury bonds and indexes. It is an effective support resistance analysis system. Fibonacci also known as t

This indicator is a professional indicator for trading on the forex market. The indicator combines several progressive algorithms. Combined historical data analysis systems are projected onto lines as direct connecting extremes. That is, the pivot point of the market. These extremes or pivot points of the market can be used as a line of levels! Which is very convenient for finding support and resistance lines.
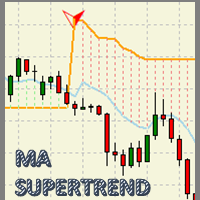
MA Super Trend An indicator based on the average maximum and minimum of a candle period, and next to the average true range (ATR) result in a powerful visual work tool to optimize the trend zones and potential areas of market entry. With great adaptability in any type of financial asset and with a potential for visual simplification in the graph, which will make the graph a simple work table. Accompanied by sound notifications, direct messages and enabled emails for an efficient trading experien
一个简单的趋势和水平线交易工具。图表上的一小组按钮允许您一键设置触发线并跟踪其状态。当价格触及线时,市场订单自动打开。订单方向(买入或卖出)由安装时的线条颜色设置。允许您应用无限数量的行,它们将在价格触及时工作。您可以创建任何图形模式:级别,通道,三角形,标志,网格等。
原理很简单: 给定颜色的实线是活跃的(有两种颜色 - 买入和卖出)。当价格触及该行并且订单被打开时,该行变为非活动状态并变为虚线,之后该行可以移动到新位置并再次激活,变为实线。 使用图表上的按钮,您可以立即关闭一个方向上的所有头寸(买入或卖出),或特定符号上的所有未平仓头寸或终端中的所有未平仓头寸。
使用“买入”和“卖出”按钮创建线时,默认批次等于设置中指定的批次。您可以停用该行,再次激活该行,更改该行属性中的批次,如下图所示。
它允许您设置止损,获利,以及使用追踪止损和盈亏平衡。您可以通过触摸相反的线来设置关闭位置。可以将线设置为剪切以限制其时间动作。
您可以使用Magic来识别您的订单。如果设置Magic = 0,您可以手动并行交易,它将同时看到自己的订单和手动订单。
您可以启用警报,发送邮件和通知。
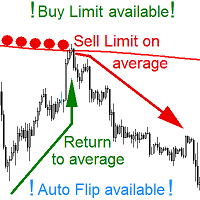
YOUR IDEAL AVERAGE Worker Place BUY and SELL LIMIT pending orders on AVERAGE line so it would be moved on opening of any candle! NOW YOU CAN do this on any kind of an AVERAGE available in MetaTrader. EA manages a scenario of an AVERAGE CROSSING. EA WORKS ON ANY INTERVALL. The chart interval determines what kind of candles will EA base upon its actions. EA places LIMIT pending order (Buy or Sell Limit) on ANY MOVING AVERAGE that is available in MetaTrader Platform. After placement EA moves a pe

Updated 11th April 2020 Gold Trend MT4 is a long-term Expert Advisor that uses the average directional index (ADX) as the main indicator in its system. This EA does not use strategies like martingale, grid, hedging, etc. Latest update is designed for XAUUSD on H1 and H4 Timeframes combined together. S et files are in the comments. Parameters Lots - fixed lot only Take Profit (point) - put 0 for auto TP Stop Loss (point) - put 0 for auto SL Break Even (point) - put 0 if not use Take Profit

很多时候,在金融系列的研究中应用他们的平滑。使用平滑,您可以删除高频成分 - 据信它们是由随机因素引起的,因此无关紧要。平滑总是包括一些平均数据的方法,其中时间序列中的随机变化相互吸收。大多数情况下,为此目的,使用简单或加权移动平均方法,以及指数平滑。 这些方法中的每一种都有其优点和缺点。因此,简单的移动平均值简单直观,但其应用需要时间序列的周期和趋势分量的相对稳定性。另外,信号延迟是移动平均值的特征。指数平滑方法没有滞后效应。但即使在这里也存在缺陷 - 只有在将系列与随机异常值对齐时,指数平滑才有效。 简单和指数平均值之间的合理折衷是使用加权移动平均线。但是,存在选择特定重量值的问题。让我们一起尝试解决这个问题。 因此,首先要定义我们希望从平滑过程中实现的目标: •首先,我们需要从价格序列中删除随机变化和噪音; •其次,我们希望识别异常排放和异常价格行为,这些行为也可用于贸易; •最后,平均程序应确定市场中存在的可持续趋势。 当然,我们希望平滑程序适应当前的市场情况。 为了获得理想的结果,我们将根据此价格水平与研究期间的最高和最低价格之间的差异来计算权重。通过这种方法,我们得到一个
I speak in Hungarian. Magyarul beszélek benne. Első felvétel. https://www.youtube.com/watch?v=MapbQrJ0uPU&t=9s (Első felvétel. https://www.youtube.com/watch?v=i2id5O1KPrI Második felvétel. https://www.youtube.com/watch?v=Zp2i7QN-IMc Első felvétel. https://www.youtube.com/watch?v=h7UbTWiM-Lw Második felvétel. https://www.youtube.com/watch?v=y54q4Rasf2A&t=1s Harmadik felvétel. https://www.youtube.com/watch?v=13zYjsoe6ZQ Negyedik felvétel. https://www.youtube.com/watch?v=NGiB1AnxxfU ) Nice Day Sign
MetaTrader 市场 - 在您的交易程序端可以直接使用为交易者提供的自动交易和技术指标。
MQL5.community 支付系统 提供给MQL5.com 网站所有已注册用户用于MetaTrade服务方面的事务。您可以使用WebMoney,PayPal 或银行卡进行存取款。
您错过了交易机会:
- 免费交易应用程序
- 8,000+信号可供复制
- 探索金融市场的经济新闻
注册
登录