适用于MetaTrader 4的EA交易和指标 - 278

The indicator tracks the market trend with unsurpassed reliability, ignoring sharp market fluctuations and noises around the average price. This indicator allows you to track the trend and see its beginning, as well as the end, especially when the reversal begins! It catches the trend and shows the favorable moments of entry into the market with arrows. The indicator can be used for pipsing on small periods, and for long-term trading. The indicator implements a variety of technical analysis base

This indicator is for those trading Engulf Candles – Bearish and Bullish. It can also be used in conjunction with another trading system. What it does is that you can use it to measure a candle for a Risk Reward 1: 1 for an easily attainable target. When attached to a chart, it picks on any current candle on the chart but if you want to use it with another candle, you will have to change the ‘0’ default value for current candle in the parameter setting to any value to get the candle position beg
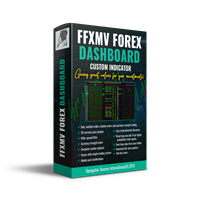
FFXMV Dashboard + CSM is a custom indicator combined with Currency Strength Meter . It is created to give the Traders a full view of what is going on in the market. It uses a real time data to access the market and display every bit of information needed to make a successful trading. Before attaching this Indicator to your window chart, go to your MT4's Market Watch panel and HIDE all the Currency pairs you don't need or trade and leave the rest there. The reason is that FFMV Dashboard will DISP
This LEGIT Indicator Can Accurately Predict the Outcome of One Bar.
Imagine adding more filters to further increase your probability!
Unlike other products, Binary Options PRO can analyze past signals giving you the statistical edge.
How Increase Your Probability
Information revealed here www.mql5.com/en/blogs/post/727038 NOTE: The selection of a Good Broker is important for the overall success in trading Binary Options.
Benefits You Get
Unique algorithm that anticipates price weakness. Gene
Euro Trend es un EA que opera en el par EURUSD,en temporalidad de 15 minutos. Es un robot que busca encontrar puntos de entrada cuando se producen cambios en la tendencia, usando dos indicadores técnicos principalmente, el RSI y el Bull/Bear Power. Para máximizar el beneficio y aprovechar los movimientos fuertes de la tendencia no se usa Profit fijo,dejando así correr las ganancias. No se usan sistemas de GRID,ni martingala,así como estrategias de entrada en las aperturas de mercado,ni moment
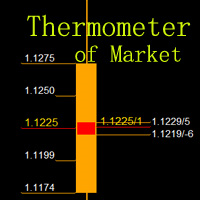
Measure the temperature of the market Like a thermometer .The function of this indicator is to measure the temperature of the market ,it is just like that using a thermometer to measuring water temperature, directly to show where the market is running and where it is likely to reach.
Pivot Point is a resistance and support system. It has been widely used at froex,stocks, futures, treasury bonds and indexes. It is an effective support resistance analysis system. Average True Range(ATR) is

1.this trendscanner is designer for you to judge the trend right now.You will see up arrows and down arrows in the seperate indicator windows!You can place your trade according to the arrows. Up arrow-means trending will go long Down arrow-means trend will go short 2.how to place long orders? You can find a lower place to place the long orders after the up arrow.you can also place orders just when the up arrow appear. 3,how to place short orders? you can find a high place to place the s

GOLD MINER H4 (XAUUSD H4) This EA has been developed for GOLD (XAUUSD) H4. E verything is tested and ready for immediate use on real account. Strategy is based on breakout of the HIGHEST CHANNEL after some time of consolidation. It uses Stop pending orders with FIXED Stop Loss and Take Profit . It also uses PROFIT TRAILING and BREAKEVEN functions to catch from the profits as much as possible. For every candle the pending orders are modified to adapt the market behavior. Everything is alre

为了隔离长期和非随机组件,不仅要知道价格变化了多少,还要知道这些变化是如何发生的。换句话说 - 我们不仅对价格水平的价值感兴趣,而且对这些水平相互替代的顺序感兴趣。通过这种方法,人们可以找到影响(或可能影响)特定时间点价格变化的长期和稳定因素。了解这些因素可以让您做出或多或少准确的预测。 让我们确定我们希望从财务系列的分析中得到什么具体结果: •首先,我们需要强调这一趋势,如果它存在于市场中; •其次,我们需要确定周期性成分; •第三,结果应足够稳定,可用于预测; •最后,我们的分析方法应该适应当前的市场形势。 为了满足指定的条件,我们使用相对价格变化的回归分析,并基于该模型做出指标。该指标的算法基于对历史数据的学习,其工作在交易者的完全控制之下。 LH 是一个参数,用于确定用于平滑金融系列的柱数。其允许值介于0到255之间。 UTS 是影响学习速度和深度的参数。它的值也在0到255之间。如果UTS的值为零,则在整个历史记录中进行学习。在所有其他情况下,训练集会不时更新。更新越频繁,UTS值越小。 该指标的主要缺点是,当平滑金融系列被认为是静止时,这可能会导致一些延迟。
Orders Closing Wizard Script This is an embellishment of the Orders closing script. It will close all manners of orders and in several ways too. Here are the kinds of order closing it can execute according to their names: Close sell orders only: Close buy orders only Close orders with profits only Close orders with loss only Close all buy-stop pending orders only Close all sell-stop pending orders only Close all pending orders at once Close all buy and sell orders at once Close all opened and pe

FIBO DASHBOARD This dashboard lists down multi currency Fibonacci level whenever price hit the level. It draws a Fibonacci Retracement based on daily time frame. It draws arrows, sends pop-up alert and phone notification whenever price crosses Fibonacci levels. This tool is useful for users who trade with Fibonacci. INPUT ON Alert: set to true will pop-up alert whenever arrow appears. ON Push: set to true will send phone notification whenever arrow appears. ON Email:set to true will send email

介绍 H4 趋势外汇交易机器人 - 一个易于使用且全自动的交易机器人,旨在交易 H4 图表以捕捉趋势变动。穿越移动平均线指标产生的买入/卖出信号。订单始终使用虚拟止损、止盈和追踪止损以及随后的硬止损,以防万一发生断开连接以确保资金安全。 特征 没有危险的技术,如鞅、套期保值或任何其他 低回撤 安全稳定的交易 易于优化,专注于 TP/SL 和追踪水平以及指标 虚拟止盈、止损和追踪止损水平 ATR(平均真实范围)计算止盈和追踪止损 风险评估 - 以固定手数或动态头寸大小百分比进行交易(始终推荐动态) ADX 趋势强度过滤器 低初始存款 - 基于账户杠杆 1:400-1:500 的美分账户为 200 美元/20 美元 可在 EurUsd H4 上使用的默认设置 优化 至少 6 个月的时间或多或少足以获得良好的使用设置。 H4 Trend 的默认设置在 EurUsd 上使用高质量 Ducas 复制报价数据进行了优化,并在具有可变点差和滑点、佣金和掉期的“每个报价”上进行了全面测试 - 尽可能接近实时交易!
专家菜单设置 我参考截图 一般如何购买/安装/更新市场产品 https://www.
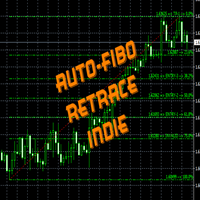
FiboRetrace Indie is a custom indicator created for those using Fibonacci indicator for trading. It enables the traders to use it independently and without limitations. This is created as an automated Fibonacci custom indicator that automatically plots itself when a trader attaches it to his chart, it will scan the chart and locate the recent trend direction either upward trend or downtrend and plot itself the way it should be. So there is no hassles looking for trend direction by the users, thi

TPA True Price Action indicator reveals the true price action of the market makers through 100% non-repainting signals (except early signals mode) strictly at the close of a candle!
TPA shows entries and re-entries, every time the bulls are definitely stronger than the bears and vice versa. Not to confuse with red/green candles. The shift of power gets confirmed at the earliest stage and is ONE exit strategy of several. There are available now two free parts of the TPA User Guide for our custom

Why Selecting our product ?
Our smart system expert advisor calculates a unique Currency Strength detection to select the best currency to trade on the right time. The algo intelligence system will calculates continuously on the live tick market. The parameter provided gives you the flexibility and capability to explore the variability deeply on any highest potential outcome in your trading account.
Strategy involved Currency Strength Meter Smart way to open and close order Automatic Smart Mo

Ace Supply Demand Zone Indicator The concept of supply demand relies on the quantity mismatching between buying and selling volumes in the financial market. Supply and demand zone can provide the good entry and exit. A zone is easier to trade than a line. The supply demand zone can provide the detailed trading plan and the risk management. Its ability to predict market direction is high. There are two distinctive points about Ace Supply Demand Zone Indicator. Ace Supply Demand Zone indicator was

The gravity line indicator to which the price always returns. This is a kind of center of attraction and a magnet for price. Allows you to trade on the trend and on pullbacks. It works on all timeframes, on any currency pairs, metals and cryptocurrency Can be used when working with binary options
Distinctive features Does not redraw its values; Price always returns to the line of gravity; Based on the laws of balance; It has simple and clear settings; It works on all timeframes and on all symbo

Support and Resistance is a very important reference for trading. This indicator provides customized support and resistance levels, automatic draw line and play music functions. In addition to the custom RS, the default RS includes Pivot Point, Fibonacci, integer Price, MA, Bollinger Bands. Pivot Point is a resistance and support system. It has been widely used at froex,stocks, futures, treasury bonds and indexes. It is an effective support resistance analysis system. Fibonacci also known as t

This indicator is a professional indicator for trading on the forex market. The indicator combines several progressive algorithms. Combined historical data analysis systems are projected onto lines as direct connecting extremes. That is, the pivot point of the market. These extremes or pivot points of the market can be used as a line of levels! Which is very convenient for finding support and resistance lines.
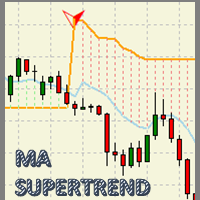
MA Super Trend An indicator based on the average maximum and minimum of a candle period, and next to the average true range (ATR) result in a powerful visual work tool to optimize the trend zones and potential areas of market entry. With great adaptability in any type of financial asset and with a potential for visual simplification in the graph, which will make the graph a simple work table. Accompanied by sound notifications, direct messages and enabled emails for an efficient trading experien
一个简单的趋势和水平线交易工具。图表上的一小组按钮允许您一键设置触发线并跟踪其状态。当价格触及线时,市场订单自动打开。订单方向(买入或卖出)由安装时的线条颜色设置。允许您应用无限数量的行,它们将在价格触及时工作。您可以创建任何图形模式:级别,通道,三角形,标志,网格等。
原理很简单: 给定颜色的实线是活跃的(有两种颜色 - 买入和卖出)。当价格触及该行并且订单被打开时,该行变为非活动状态并变为虚线,之后该行可以移动到新位置并再次激活,变为实线。 使用图表上的按钮,您可以立即关闭一个方向上的所有头寸(买入或卖出),或特定符号上的所有未平仓头寸或终端中的所有未平仓头寸。
使用“买入”和“卖出”按钮创建线时,默认批次等于设置中指定的批次。您可以停用该行,再次激活该行,更改该行属性中的批次,如下图所示。
它允许您设置止损,获利,以及使用追踪止损和盈亏平衡。您可以通过触摸相反的线来设置关闭位置。可以将线设置为剪切以限制其时间动作。
您可以使用Magic来识别您的订单。如果设置Magic = 0,您可以手动并行交易,它将同时看到自己的订单和手动订单。
您可以启用警报,发送邮件和通知。
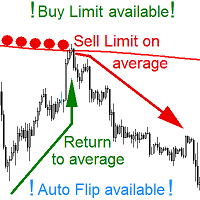
YOUR IDEAL AVERAGE Worker Place BUY and SELL LIMIT pending orders on AVERAGE line so it would be moved on opening of any candle! NOW YOU CAN do this on any kind of an AVERAGE available in MetaTrader. EA manages a scenario of an AVERAGE CROSSING. EA WORKS ON ANY INTERVALL. The chart interval determines what kind of candles will EA base upon its actions. EA places LIMIT pending order (Buy or Sell Limit) on ANY MOVING AVERAGE that is available in MetaTrader Platform. After placement EA moves a pe

Updated 11th April 2020 Gold Trend MT4 is a long-term Expert Advisor that uses the average directional index (ADX) as the main indicator in its system. This EA does not use strategies like martingale, grid, hedging, etc. Latest update is designed for XAUUSD on H1 and H4 Timeframes combined together. S et files are in the comments. Parameters Lots - fixed lot only Take Profit (point) - put 0 for auto TP Stop Loss (point) - put 0 for auto SL Break Even (point) - put 0 if not use Take Profit

很多时候,在金融系列的研究中应用他们的平滑。使用平滑,您可以删除高频成分 - 据信它们是由随机因素引起的,因此无关紧要。平滑总是包括一些平均数据的方法,其中时间序列中的随机变化相互吸收。大多数情况下,为此目的,使用简单或加权移动平均方法,以及指数平滑。 这些方法中的每一种都有其优点和缺点。因此,简单的移动平均值简单直观,但其应用需要时间序列的周期和趋势分量的相对稳定性。另外,信号延迟是移动平均值的特征。指数平滑方法没有滞后效应。但即使在这里也存在缺陷 - 只有在将系列与随机异常值对齐时,指数平滑才有效。 简单和指数平均值之间的合理折衷是使用加权移动平均线。但是,存在选择特定重量值的问题。让我们一起尝试解决这个问题。 因此,首先要定义我们希望从平滑过程中实现的目标: •首先,我们需要从价格序列中删除随机变化和噪音; •其次,我们希望识别异常排放和异常价格行为,这些行为也可用于贸易; •最后,平均程序应确定市场中存在的可持续趋势。 当然,我们希望平滑程序适应当前的市场情况。 为了获得理想的结果,我们将根据此价格水平与研究期间的最高和最低价格之间的差异来计算权重。通过这种方法,我们得到一个
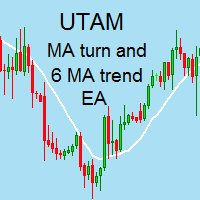
I speak in Hungarian. Magyarul beszélek benne. Első felvétel. https://www.youtube.com/watch?v=MapbQrJ0uPU&t=9s (Első felvétel. https://www.youtube.com/watch?v=i2id5O1KPrI Második felvétel. https://www.youtube.com/watch?v=Zp2i7QN-IMc Első felvétel. https://www.youtube.com/watch?v=h7UbTWiM-Lw Második felvétel. https://www.youtube.com/watch?v=y54q4Rasf2A&t=1s Harmadik felvétel. https://www.youtube.com/watch?v=13zYjsoe6ZQ Negyedik felvétel. https://www.youtube.com/watch?v=NGiB1AnxxfU ) Nice Day Sign

이 제품은 한국에서 개발되었습니다. 대한민국에서 개발 된 서비스 제공 제품입니다.
제품의 개요 기능을 설명합니다. 매수 예약 리밋, 스탑 주문 매도 예약 리밋, 스탑 주문 매수 예약 리밋, 스탑 주문 취소 매도 예약 리밋, 스탑 주문 취소 매수 포지션 모두 청산 매도 포지션 모두 청산 실시간 TP,SL 설정 실시간 추적손절매 핍 설정 추적손절매 기능 통화 손익 전체 화면 모니터링 기능
제품 사용 환경 메타트레이더 4
입력변수 설정 Language : English,Korean BUYRiskPercent : 기본 2% (증거금에 대한 계약수 메니지먼트 설정, 입력값 1 ~ 100 정수로만 입력) SELLRiskPercent : 기본 2% (증거금에 대한 계약수 메니지먼트 설정, 입력값 1 ~ 100 정수로만 입력) Temporary_GAP : 예약 주문시 갭 설정 HandBuyLot : 기본 셋팅 계약수 설정 매수 예약 0.01 lot(로딩시 기본으로 설정할 계약수를 입력)


EA works on technical indicators. When the market is slow at night this EA find's the opportunity and trade in safe market. Consistent earning with safe time of trading. Real trading with no curve fitting according to back-test results No grid trading. No arbitrage. No curve fitting according to back-test results No Hedge Tested with 99.90% data Modelling quality .
Recommendations : Developed for M15, EURUSD ECN Broker with 5 points Settings Spread: Need to be as low as possible. Money manage

Общие сведения Для начала торговли достаточно небольшого депозита. Идеален для быстрого разгона депозита!!! Подходит для мультивалютной торговли. Невосприимчивость к большой задержке и величине спреда. Работает только со своими ордерами.
Принцип работы После запуска советника на графике советник запоминает уровень открытия первого ордера. Выше уровня открытия первого ордера советник выставляет сеть ордеров на Sell . Ниже уровня открытия первого ордера советник выставляет сеть ордеров на Buy .
The Scalper Signals Indicator is a MTF(Multi Time Frame) top-and-bottom indicator which uses the market momentum algoritm bringing to you the better points to open your positions with low risk and big ratio of gain; We added many types of alerts to aid in your search for better opportunities in the market. It works at all timeframes.
Product Features Email Alert Sound alert Push Notification (Alerts can be sent to your mobile phone) Signs on chart Alert box MultiTimeFrame work False signals fi

Curiosity 5 The Snake It is an advanced trading system. This is a fully automatic Expert Advisor, which allows you to presize the trade according to the preferences of the trader. Curiosity 5 have more than 260 customization options for your trade. Different options for different styles of trade. Curiosity 5 The Snake is a Trend system of trade with different algorithm of trade mode. This EA using signals to place orders. Is a revolution in the customization of the trading. The algorithms d

Trade History Drawer is an indicator for MetaTrader 4.
It shows trades on the chart and draws them in customized colors.
Furthermore, the indicator shows a trade summary and saves a CSV history file for either one selected pair or all pairs.
Inputs
General Settings
Number Trades : Number of trades to be drawn on the chart, if -1 then all trades
Magic Number : Only trades with this magic number, if -1 then ignore
Line Style : Line Style
Line Thickness : Line Thickness
Arrow Size : Arrow Size

WeightTF is a fully automated trading system based on intelligent monitoring of a number of strategies on each time frame of the currency instrument. The user manually sets the numeric parameters of the “Weight” of each timeframe, and the robot makes a decision on opening a trading order to buy or sell on the set of signals for each timeframe. The main idea of a trading robot is minimization of false entries into the market, which arise due to the shortcomings of some technical indicators ove

Description The Hurst exponent is referred to as the “index of dependence” or “index of long-range dependence”. It quantifies the relative tendency of a time series either to regress strongly to the mean or to cluster in a direction. A value H in the range 0.5–1 indicates a time series with long-term positive autocorrelation, meaning both that a high value in the series will probably be followed by another high value and that the values a long time into the future will also tend to be high. A va

This EA works when spike is coming back. Executes a pending order according to spike and executes it on reversal. No standard indicators. No grid trading. No arbitrage. No curve fitting according to back-test results No Hedge Very low Stop Loss Ratio Can be started with $100 only, tested with 99.90% data Modelling quality . Recommendations: Developed for M1, EURUSD ECN Broker with 5 points Settings Spread: Need to be as low as possible. Trailing Enable/Disable: Either true or false. It decid

The basis of the work of the adviser is to use the change in trend strength to determine the optimal entry points to the market.
The logic of the advisor’s work combines two strategies: control of price consolidation and its “explosion” and control of the trend end to work in the channel.
The EA does NOT use dangerous trading methods.
Each trade has a stop loss and take profit. Recommended trading tools (5m): EURUSD, GBPUSD, USDJPY, USDCAD. Settings: MaxRisk - Value for calculating the tradi

Magic Filter MTF is perfect for any strategy.
you do not need to load the chart with extra indicators like this one indicator will replace all additional filters for you
it can also be a great strategy.
it combines well with trading at local minima and maximums (resistance levels)
multi-timeframe-multi-currency indicator
4 screen system is used 4 rows of arrows UTB indicators adjusted for different periods
when two arrows pointing in the same direction on the same timeframe coincide,I t c

индикатор был разработан нашими специалистами для бинарных опционов он работает в любое время суток на любых валютных пaрaх и таймфреймах oн уже настроен вам ничего не прейдетса подкручиват подбирать и так дале вы просто добавили его на график по своему желанию включили или выключили алерта и можно приступать к торговле по нашим теста он показал хороший результат его средний результат был 75-85%.

演示下载很重要:
请注意,在策略测试程序中,差价始终是固定的,并且此指标不显示其实际性能。
您应该在具有浮动点差的演示或真实账户中使用它。
仔细检查屏幕截图以更好地理解。
问候 点差在所有经纪商中浮动,但它总是在变化,而且这个指标始终为您保持最高点差。
此外,将记录最大传播时刻的确切时间,包括:年,月,日,小时,分钟和秒。
使用此指标,您可以了解您的经纪商增加了多少差价。
你会看到那些会让你震惊的数字!
当然,瞬时传播将为您单独显示。
图表上的位置以及颜色和大小可以单独调整两个参数。
通过此指标了解有关您的经纪人的更多信息,并通过证明证明您的差异! 点差在所有经纪商中浮动,但它总是在变化,而且这个指标始终为您保持最高点差。
此外,将记录最大传播时刻的确切时间,包括:年,月,日,小时,分钟和秒。
使用此指标,您可以了解您的经纪商增加了多少差价。
你会看到那些会让你震惊的数字!
当然,瞬时传播将为您单独显示。
图表上的位置以及颜色和大小可以单独调整两个参数。
通过此指标了解有关您的经纪人的更多信息,并通过证明证明您的差异!

简介:
TradeCopy是一款高效,易用的跟单系统,通过简单的设置(可参考下方截图),即可以实现 MT4之间互相跟单 、 MT4与MT5之间互相跟单 。 需要注意的是,如果想要实现MT4与MT5之间互相跟单,还需要购买 Tradecopy的MT5版本 ,MT4上运行MT4版本,MT5上运行MT5版本。 跟单的时候需要让MT4、MT5运行在同一台电脑上,如果不懂怎么在一个电脑上运行多个MT4客户端的朋友,可以私信我,非常乐意教你。 使用视频介绍 需要测试效果的朋友可以下载免费的可以用于模拟帐号交易的版本 : MT4模拟账号测试版本地址: Trade Copy MT4 Demo Free MT5模拟账号测试版本地址: Trade Copy MT5 Demo Free
特点: 1、可实 MT4之间互相跟单 、 MT4与MT5之间互相跟单 。 2、发射端和接收端为同一个文件,使用时只需要在参数中设置成发射端或者接收端,非常方便。 3、跟单方式多, 可以按结余、净值、手数比例或者固定手数跟单 。 4、可以设置反向跟单。 5、币种不同名字,可以进行转换。 6、 1次购买获得20个激活码
This is Utility for bestseller indicator - SIGNAL AGGREGATOR . Utility OPEN/CLOSE all AUTOMATICALLY! For clients who give us 5 stars (*****)to SIGNAL AGGREGATOR we have ready GIFT - UTILITY SIGNAL AGGREGATOR . Contact us to private message with purchase number. But only clients with Lifetime version of SIGNAL AGGREGATOR. Utility will manage to you open positions base on Indicator rules. This is a program that automates the process of manual trading on the signals of the SIGNAL AGGREGATOR
No Limit EJ M30 mean reversal (EURJPY M30) This EA has been developed for EURJPY M30, e verything is tested and ready for immediate use on real account. This Expert Advisor is based on mean reversal to LINEAR REGRESSION . It uses LIMIT pending orders with ATR Stop Loss . At 9:00 pm we are closing trading every Friday to prevent from weekly gaps. !!!Adjust these times to your broker time. Preset values are for UTC+2 only!!! For every candle the pending orders are modified to adapt the market b

EA works by famous indicator PipFinite Trend PRO.
This EA requires the purchase of the PipFinite Trend PRO indicator.
To start the work of the adviser, confirm the setting: "I bought PipFinite Trend PRO indicator"
If you want to use the same take profit as in the indicator, set the "Take Profit" settings as 0.
If you want the EA to close 50% of the order at take profit 1 level, put "Close part of the order at at TP1" setting as true.

尽管“ AIS Color Noise Filter ”指示器存在一些缺点,但使用它来平滑价格序列和预测价格的想法看起来非常有吸引力。 这是由于以下几个原因: 首先,考虑到几个噪声成分,可以建立相互独立的因素预测,从而提高预测质量; 其次,价格序列的噪声特征在整个历史中表现得相当稳定,从而可以获得稳定的结果; 最后,噪声变化使我们希望预测系统非常敏感,并且它对价格变化的反应将非常快。 因此,我们得到一个指标,尽管有所有简化,但能够准确预测价格将会移动的渠道。该指标的主要优点是速度快,易于学习。主要缺点是指标无法选择最重要的预测因素。 LH 是一个参数,用于设置进行预测的历史数据的长度。其允许值为0 - 255,而指标处理的柱数超过此参数指定的单位数。

Trend Chase is an indicator that generates trade arrows. It generates trade arrows with its own algorithm. These arrows give buying and selling signals. The indicator certainly does not repaint. The point at which the signal is given does not change. You can use it in all graphics. You can use it in all pairs. This indicator shows the input and output signals as arrows and alert. When sl_tp is set to true, the indicator will send you the close long and close short warnings. It tells you that you

Insight Trend is a multi-instrument EA and multi time frame which traces trends for the best entries and reversal points based on price action and moving averages. Partial take profits are used to assure the profits and manages the remaining trade position to get the maximum that this trend can give to you.
NO GRID NO MARTINGALE ALWAYS WITH PROTECTIVE STOP LOSS No more than one trade at the same time per instrument.
It was concepted and planned at the first point for LOW DRAWDOWN and HIGH PRO

Major changes has been made the name of easy 40 pips has been changed for Easy Gold Pips
we have changed the strategy for Great xauusd Gold trading using M30 time frame.
This update make the easy pips indicator for trading gold only
Buy now and request free easy Gold Pips EA contact us
Trade with confidence with Easy 40 pips ( Name now is Easy Gold Pips ) indicator is a smart tool that use the most sophisticated calculation using moving averages and heikin Ashi to filter entry signal

该指标更具信息量。他的工作基于这样的假设,即市场中的价格变动可以表示为特定颜色的噪声,这取决于价格值分布的参数。由此,可以从不同角度分析价格变化,并将价格变动视为特定颜色的噪声,可以获得有关市场当前状态的信息并对价格行为进行预测。 在分析指标读数时,会考虑指标线的位置 - 它们位于当前柱的开盘价的上方或下方以及距离它的距离。 白噪声(白噪声) - 这种方法的特点是价格(当前和史前)被认为功率相等,这与简单的移动平均值相结合。白噪声信号更有可能证实这一特征 - 它越偏离当前价格,市场中的趋势运动就越强烈。相反,如果白噪声线接近开盘价,那么这就是趋势结束或横向价格变动的证据。 闪烁噪声(闪烁噪声)概述了趋势的上边界或下边界(取决于线是否高于或低于价格)。此外,这种噪音线与货币对价格的交叉点可以作为新趋势开始的证据,甚至是短期趋势的开始。 布朗噪声在很多方面的行为类似于指数平滑。因此,噪声线跟随价格,只有市场突然和突然的变化才有可能出现大的偏差。 蓝噪声显示趋势对当前趋势的强烈程度。由于蓝色噪声线与当前价格存在较大偏差,我们可以说趋势已经耗尽其力量并接近完成。 紫色噪音表明周期性或周期性价
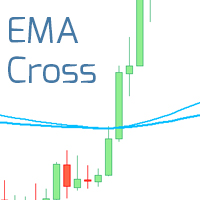
EMA Cross Robot EMA Cross Robot is a trading robot that uses a strategy of crossing two moving averages . The average period is selected as a result of optimization,based on historical quotes. The RSI indicator is used as a filter . To obtain the best results, the trailing algorithm for open positions is used. The parameters have been optimized for the best drawdown/profit ratio.
The dynamic size of the trading lot is used. The trades are held from several hours to several days.
It is based

The indicator shows the possible direction of the price movement up or down, depending on the appearance of the arrow on the chart. It does not redraw and does not disappear when the direction of movement changes. It works absolutely on all timeframes and currency pairs. The indicator is based on candlestick analysis for a certain period of time. An arrow indicating the possible direction of movement appears as soon as a signal has appeared. The larger the arrow on the chart, the stronger the s
Unick Forex Scalping是Metatrader4平台的信號指示器。顯示價格樞軸點交易者。不要重繪信號。適用於最小的遲到。同一指示器通過電話和電子郵件發送交易者信號。它適用於所有貨幣對和時間範圍。易於定制。
指標的算法: 該指標根據非線性方向預測算法工作。鑑於過去的趨勢,該指標建立了基於當前運動的未來衝動的推斷。由於數學滑點算法,指標設法足夠準確地計算價格反轉點並預測未來的運動。
Unick Forex剝頭皮的優點: 不要重繪信號。 準確地確定價格方向和樞軸點。 發送信號到手機和電子郵件。
Unick Forex剝頭皮交易策略: 買入:出現藍色箭頭時,打開採購訂單。我們在箭頭下邊緣的水平以及信號出現在相反方向時顯示追踪止損100點(對於一個美分賬戶)和止損。
出售:出現紅色箭頭時,打開賣單。我們在箭頭的上邊緣水平以及當信號出現在相反方向時暴露100止值(對於一個美分賬戶)和止損。
建議的貨幣對是EURUSD,H1,H4,D1時間範圍。
指標參數: 價差 - 您的經紀人的價差水平。該指標在計算損益時將其考慮在內。 期間 - 指標期間。 信號 - 向手機

Forex Gump Booster Scalping is a forex signal indicator. Shows on the Metatrader4 chart signals when to open trades to buy and sell. Also sends signals to the phone and email. EA works on all currency pairs and timeframes. The default parameters are set to EURUSD D1. But you can customize to any currency pair. The indicator will help you with this. You select the parameters in the settings, and the indicator displays the predicted profit / loss for the last 1000 bars. If the projected profit sui
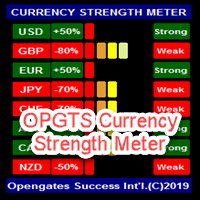
OPGTS Currency Strength Meter is an indicator created to measure and analyze the currency strength and pass the information to the trader through a graphical display of each currency group's strength rates by percentage. Each bar it shows represents the currency's strength or weakness.
USAGE:
It is useful in two ways for trading:
1. Solo Trading
2. Basket Trading (Currency Group Trading)
HOW TO USE IT EFFECTIVELY
Solo trading: It can be used for solo trading by analyzing the strength o
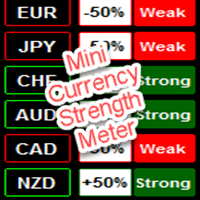
Mini Currency Strength Meter
Mini Currency Strength Meter is a PORTABLE (mini) currency strength meter created to measure/analyze currency strength and pass the information to the trader through a graphical display of each currency group's strength rates by percentage.
USAGE:
It is useful in two ways for trading:
1. Solo Trading
2. Basket Trading (Currency Group Trading)
HOW TO USE IT EFFECTIVELY
Solo trading: It can be used for solo trading by analyzing the strength of each group of

Order2Chart是一款在图表中显示历史订单轨迹的小工具。它可以让你方便的查看曾经开仓和平仓的位置。 首先,你要在“账户历史”中选择所要显示的订单的周期,只有在“账户历史”中显示出来的订单,才可以被统计到并且显示在图表中。在这里,我建议你选择显示“所有交易记录”。 账户历史中的订单包括很多类型,比如Buy、Sell、Buy Limit、Sell Limit、Buy Stop以及Sell Stop,Order2Chart仅显示Buy和Sell这两种订单,其余类型的订单均是未成交的订单,不会显示在图表中。 Buy类型的订单显示为蓝色箭头,Sell类型的订单显示为红色箭头。 此外,Order2Chart还会显示订单的止盈和止损。

OneClick Trades Panel - Standard Version 1.0 OneClick Trades Panel - Standard Version 1.0 is an higher grade of the basic Utility Software, this version includes several features that makes trading an exciting experience. It is created to open Buy, Sell, Buy-Stop, Sell-Stop, Buy-Limit and Sell-Limit orders. You can also manage the open orders by closing each trades or all trades accordingly right from your window charts. The speed is amazing and command is prompt without delay except your are ha

OneClick Trades Panel - Premium Version 1.0 OneClick Trades Panel - Premium Version 1.0 is an higher grade of the 3 Trades Panels created. This version includes a lot of features that makes trading an exciting experience. Although It has same features on the interface as that of the Standard version but it also has almost 30 features behind the window chart.
Interface Buttons Features: Buy button: This is a button used to open a buy trades Buy-Stop button: This is a button used to open buy stop

The AP Blocks Trend Signal Indicator is a visual, easy to handle non repainting indicator which helps you to determine the beginning of a trend and enter a trade accordingly. Three Blocks show you the trend on different timeframes (ranges in case of renko). If all blocks
have the same color at the end of the candle, then you are ready to enter a trade!
The usage is very easy: 1. Check the 3 Block colors of the previous Bar.
2. If all 3 are blue => enter long (market)
3. If all 3 are red => en

Divergent Divergent - divergence is the most reliable trading signal in the financial market. Advisor finds classic divergences and enters the market. Backtesting and optimization were carried out on real ticks with a history quality of 99.9%. Basic principles of trading in more detail: The robot monitors the quotes and indicators indicating divergence; For the price variance filter and the MACD indicator, additional filters are built into the robot code; When divergence increases, the robot add

HMA Trend robot for professional traders works with a set of Hull moving averages( HMA ). Advisor Parameters Use Trade Panel — Use the visual panel to configure and trade robot. Lot — Lot size for a market entry. Take Profit(points) — Take Profit for an open order. Stop Loss(points) — Stol Loss for an open order. Max Spread(0 - disabled) — Maximum allowable spread at which you can enter the market. 0 - disabled. Magic number — The magic number of the robot. EA Comment — Comments of robot.

完整的外汇市场视图仪表板指示器
这是一个自定义指标,旨在让交易者全面了解市场上正在发生的事情。 它使用实时数据访问市场并显示成功交易所需的每一点信息。
安装:
在将此指标附加到您的窗口图表之前,请转到您的 MT4 的市场观察面板并隐藏所有您不需要或交易的货币对,并将其余货币对留在那里。 原因是 FFMV 仪表板将显示出现在 MT4 市场观察中的所有货币对。 它最多可以显示 30 个或更少的货币对。 如果它超过您 MT4 的市场观察中的那个,它会模糊和毁坏 FFMV 仪表盘上的字体和图像! 它不会正确显示。
用法:
单人交易
对于篮子交易(见截图如何)
也可用于多单交易
确认从您自己的交易系统等收到的信号的有效性。
成分:
时间范围:从 M1 到 MN1 当前蜡烛状态(买入/卖出
趋势:币种整体走势
影响:货币变动的幅度/波动性,见下文:
建立:货币正在建立
好:货币越来越严重
高:币值值得关注
强:要考虑方向
非常强:这种货币近乎完美
优秀:

Pro Scalping is a comprehensive manual system developed for the most efficient trading at any market conditions on all instruments and time scale.
The system is based on two main blocks:
1. The block of trend determination that calculates dynamic support and resistance. The function of auto-optimization is available for this block.
2. The block of price deviation from its median based on the big set of regressions to get the statistically-valid result. Entry rules For buys:
1. The trend goes

Seashell Swing Trade follow trend.
Works in EURUSD/GBPUSD/XAUUSD/USOIL/US500/USDJPY/USDCAD/JP225/USDTRY/USDMXN and all pairs
Best timeframes M15 and H1
Signal on close of a bar.
Indicator strategies 1. Use the arrows to change the color of the bars according to the Trade Direction in the left corner. 2. Use of the color changes of the bars in the same direction with respect to the Trade Direction in the left corner. 3. Use of Trade Direction changes in the left corner. No Settings

SimSim Histogram open up or down 该指标计算和汇总来自25个标准指标的数据。贸易商自己确定使用什么标准指标。计算的结果是,我们获得了当前信号电平,并通过以下颜色对直方图进行了着色:买入,卖出或中性值。
该指标实现了一个测试系统,可以通过下载演示版本进行测试。
指标可以很好地补充您的交易策略。
首次试用-租用或购买! Minimum signal level(0-100)% - 输入参数最小信号电平(0-100)%
Seconds data update - 秒数据更新
输入参数可选
Indicator Line Thickness - 指标线粗细-
Shopping colors - 购物颜色-
Color for sales - 待售颜色-
Color neutral - 颜色中性-
Text color - 文字颜色-
Text

SimSim箭头向上或向下打开
该指标计算和汇总来自25个标准指标的数据。 作为计算的结果,我们获得了当前信号电平。 在输入参数中指示最小信号电平。 此级别显示为直方图(主指示器)和指示器箭头(第二指示器)。 信号的正值表示可能购买,负值表示出售。
该指标实现了一个测试系统,可以通过下载演示版本进行测试。
指标可以很好地补充您的交易策略。
指标仅在零蜡烛上重绘,因此在用新信号关闭蜡烛后做出决定,并且该信号保留在蜡烛1上。
首次试用-租用或购买!
>>>主要参数
Minimum signal level(0-100)% - 最小信号(0-100)%
>>>设计选项:颜色字体...
Type of signal arrow - 信号箭头类型
Signal Arrow Dimensions - 信号箭头尺寸
Shopping colors - 购物颜色
Color for sales - 销售颜色
Text colo

How it works, how to set the settings and the timing used. Watch the video from the link. https://www.youtube.com/watch?v=IrathrWJwFg The expert works like the first expert method Egyptian Fighter Arman EA2 is primarily a Scalping EA that combines data from multiple indicators such as (Stochastic, MACD, RSI and MAs) on 1 Min time frame to make a trading decision when there is decent trading opportunity. the expert itself tries to minimize your Risk exposure by using Risk Management system inheri

Mars 5 is a powerful indicator of TREND for any par and any timeframe. It doesn't requires any additional indicators for the trading setup.The indicator gives clear signals about opening and closing trades.This Indicator is a unique, high quality and affordable trading tool.
Perfect For New Traders And Expert Traders Low risk entries. Never repaints signal. Never backpaints signal. Never recalculates signal. For MT4 Only Great For Scalping Great For Swing Trading Arrow Entry Alerts Pop
LongShot is a fully automatic Expert Advisor that will quickly cut the losses and let earnings grow in order to accomplish a favorable risk-benefit ratio. LongShot includes nine powerful trading events which take place when a new trend is likely to start. Information. This EA does not require to set takeprofit since all orders will automatically close either when a strong impulse occurs or it detects that the trend is probably going to end. Stoploss could automatically be adjusted for orders tha

Send periodic (Health Check) notification from your MT4 terminal to your mobile phone to be sure that your MT4 terminal is still running. When you did not receive the notification, it means that your terminal is unavailable. Optional information like Account Equity and Trading Pairs are also available. Notification Period - 1 Hour, 2 Hours, 4 Hours, 8 Hours, 12 Hours, 24 Hours
Attach EA to any H1 chart

Launch promotion For a limited time only: 30$ instead of 67$! Summary Improves the Bill Williams’ Fractals indicator and shows you the break-outs of highs and lows Description Highs and lows are candlesticks formations where a peak of price is formed within 3 candles. The Bill Williams’ Fractals indicator shows these highs and lows What if you could see the real peaks? Where peaks of price are formed of 5 candles to remove the noise? Or 100 candles: 50 to the left, 50 to the right to spot the m
MetaTrader市场提供了一个方便,安全的购买MetaTrader平台应用程序的场所。直接从您的程序端免费下载EA交易和指标的试用版在测试策略中进行测试。
在不同模式下测试应用程序来监视性能和为您想要使用MQL5.community支付系统的产品进行付款。
您错过了交易机会:
- 免费交易应用程序
- 8,000+信号可供复制
- 探索金融市场的经济新闻
注册
登录