适用于MetaTrader 4的EA交易和指标 - 270
Price Point Signal is an indicator that generates trade arrows. It generates trade arrows with its own algorithm. These arrows give buying and selling signals. The indicator certainly does not repaint. The point at which the signal is given does not change. You can use it in all graphics. You can use it in all pairs. This indicator shows the input and output signals as arrows and alert. When sl_tp is set to true, the indicator will send you the close long and close short warnings. It tells you t

This EA offers following features to automatically increase the volume of the lot received from your signal: you can manually set the multiplier using the "multiplier" parameter; Risk control is implemented. You can set the maximum lots-to-account balance ratio using the "ratio" parameter; The "stop loss" an "take profil" levels are synchronized from the corresponding signal tickets; One-to-one replication. Each signal ticket corresponds to a copied ticket; For MT5 version: https://www.mql5.c

Prometheus is created to give a constant profit from the moment of launch and bring profitable transactions every day. It is automatic trading advisor with a built-in double strategy module, which are used depending on market conditions. The EA has fully customizable parameters for working in different market conditions. As inputs, indicators Rsi and Long Parabolic is used. When the profit from open basket of orders is greater than used parameter, they are automatically closed with a profit. If

This EA has been developed for GBPJPY H1 timeframe. Everything is tested and ready for immediate use on real account. This Expert Advisor is based on BREAKOUT of the BOLLINGER BAND channel after some time of consolidation . It uses STOP pending orders with ATR STOP LOSS and FIXED TAKE PROFIT . Very SIMPLE STRATEGY with only FEW PARAMETERS. At 9:00 pm we are closing trading every Friday to prevent from weekly gaps. !!!Adjust these times to your broker time. Preset values are for UTC+
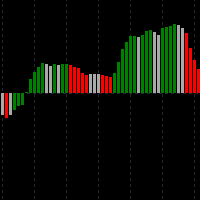
Hybrid MacdAO - индикатор, сделанный на базе двух популярных индикаторов: MACD + AO. Он вобрал в себя их лучшие качества, но при этом лишен недостатков. Предназначен для ручной торговли по тренду. Отлично показывает усиление, замедление текущего движения цены. Также будет хорошим помощником, кто торгует по дивергенциям (довольно точно показывает нужную точку входа в позицию сменой цвета гистограммы). Есть алерт-система (чтобы вы не сидели постоянно возле монитора). Преимущества перед стандартны

Trend Sniper Super Indicator is one of the best indicator which can provide you will perfect signals for short term and long term trades. This indicator is suitable for both scalping and swing trading strategies. The indicator is over 85% accurate. It uses terminal Message Alerts, Emails and Push notifications to your mobile device to inform you about the new trading opportunities and it will calculate the take profit and stop loss level for you. All you will need to do is to place a trade. Subs
Utility, which draws buy or sell trendlines, which can also become support or resistances able to close any position on the screen Algorithm that calculates the gain of the position, at the touch closure of the line. The benefits you get: Works on forex and CFD, timeframe from M1 to Weekly. Easy to use screen control panel. Audible warning messages at the touch of the line. Easy to use.

This is a universal adviser working in several directions. The first and main thing is assistance in various situations that arise during trading. The second is scalping or positional trading according to the trend, open orders, at the same time, insured with support orders using the model of a quantum set of algorithms. Main Advantages Work in several directions; Increase in account balance during drawdown; Maintenance of already open orders; Building a grid lock; Scalping and/or trend trading
Automatic enumeration of input parameters of the TrendImprovement Pro indicator to find the optimal combination. Description.
A powerful tool for testing the input parameters for the TrendImprovement Pro indicator will allow you to quickly find the most profitable options for the input parameters.
Settings
DateOrBars – switch for using time or number of bars; MaxBars - the maximum number of bars for calculation; StartHistory - indicator start time; BEGINNING - the initial historical data (In-S

For the expert to work correctly, do not forget to upload the files to the directory of the agreement (... AppData \ Roaming \ MetaQuotes \ Terminal \ Common \ Files)
STP is an automated trading adviser based on neurotechnology, working on an hourly timeframe. The Expert Advisor is configured for trading according to the safe trading strategy from levels, involving the opening of short-term deals and closing them when positive profitability dynamics of several points are achieved, which allows

For the expert to work correctly, do not forget to upload the files to the directory of the agreement (... AppData \ Roaming \ MetaQuotes \ Terminal \ Common \ Files)
Accuracity is a completely new generation automated trading neuro-system. This system, whose structural basis is a specialized neural network, is able to permanently learn in chaotic market conditions, organizing and systematizing them to optimize trading and protect the user from the systematic opening of transactions against th

For the expert to work correctly, do not forget to upload the files to the directory of the agreement (... AppData \ Roaming \ MetaQuotes \ Terminal \ Common \ Files)
Alfascal is a new model of a fully automated trading neuro-system, working on short timeframes. This system, which is based on a specialized neural network, is able to provide continuous training, transform the chaotic realities of the market into a specific system that can improve the quality of open transactions and absorb most
除去暴力爆仓的观点,本ea以稳定盈利为中心 适用品种,audusd,usdchf,nzdusd,usdjpy等等走势相对平稳的货币 本ea提供图表参数,和快捷平仓按钮,桌面文字都是汉语和拼音拼写而成,更方便中国人观看,只需要简单拼读便可以理解变量意思,账户应该保持3000以上的资金,如果小于3000,请将xiadanlaing修改至0.01, 和jiacangjiange修改至900,如果不够可以用美分账户。如果资金量很大可以提高xiadanliang,但请不要高于0.2,jiacangjiange不要低于500. “如果ea盈利高于50%应当将盈利部分取出”保存利润才是交易的根本 解释“zuidazhisunjinekaiguan”最大止损金额开关.如果需要开启,请在输入栏输入“kai”当浮亏金额大于“zuidakuisunjine”就会清仓止损
xiadanliang----------------------------------------下单量 jiacangbeishu-------------------------------------加仓倍数 zhiyingdi

这是一位高级专家顾问,它的策略是在图表上出现突然剧烈波动时进行交易。 这个EA是趋势突破交易 不过,它在市场每个蜡烛上产生一笔交易 它是低风险EA,没有很多仓位,具有预定义的TP、SL和TS 特征 监控全部货币对. 这个EA能监控默认的15个设置货币对, 但也能选择较少或较多的货币对. 这个EA是多货币EA,仅仅在一个图表运行EA,推荐H1图表。 通常每单利润成功率在80%以上 参数: InpPairs = "EURUSD,GBPUSD,GBPJPY,USDCHF,XAUUSD,USDJPY,AUDJPY,AUDUSD,NZDUSD,AUDCAD,AUDCHF,NZDCHF,NZDJPY,EURGBP,EURJPY" InpMagicnumber=36723457 // EA标识号码 InpAdxLevel = 30 // 趋势强度 AutoLotLevel = Second // 自动交易量级别 InpLotsExponent =

The momentum trader uses an array of well established principles in Forex trading to open and close intraday positions. It performs approximately the following steps to generate a signal: Draw support and resistance on current timeframe. Is used to determine whether we are currently trading in a range or in a breakout scenario. MACD is used to indicate the current Trend RSI is used to determine overbought and oversold conditions. There are a few things to note about the operation of the Expert:

Two Kids - high frequency EA-scalper. Two Kid s - uses only two standard indicators to generate signal to oder opening. Two Kids -universal and simple. Two Kids - trades accurately and swiftly. Two Kids - independent on TF. Two Kids - worsk on all currency pairs. Two Kids - uses no martingale and no grid Two Kids -needs 20 units of currency for lot 0.01 for each used currency pair.
Two Kid s EA Parameters : Trading hours HH . ММ (server time) : trade time limit on time : tim

ATTENTION: This EA looks for trends in multiple timeframes and analyzes 28 currency pairs at the same time which makes it impossible to fully test it on the MT4 StrategyTester. The expert advisor opens trades when the Forex GoPro indicator enter in oversold or overbought areas. The Stop Loss, Take Profit, and Trailing Stop are calculated based on the ATR indicator. Verify the recommended currency pairs for the current market conditions here . The recommended timeframe to operate is M5 . Fo

The Quick trade report separately by symbols advisor will be useful for simultaneous trading on multiple instruments. It provides the ability to assess the effectiveness of trading on each symbol separately. It is possible to set a time period for making the reports. Frequency and time of automatic generation and sending of reports via FTP. The report visualizes the changes in the balance for deals on each symbol. Also, the following key trading parameters are calculated for each instrument: T

Strategy
The main logic behind this strategy is quite simple. Basically it trades once per day. Max 1 trade per day. Which means it does not open plenty of trades during the day, this strategy does not use some very risky martingale elements. EA tries to open a trade by the trend's direction, then it holds that trade all day and tries to get maximum profit. At the end of the day it closes a trade. If it's a win when it repeats the main method, if it's a loss when it opens a trade with multiplie

This Indicator provides Buy/Sell Signal based on calculations on Higher frame (Trend) and Lower frame(Entry signals) * You should select the higher and lower frame for indicator calculations * You select the Trend line colors as you prefer * Enable or disable Alerts! Trend lines UP/Down are drawn when a trend is detected Wait for small arrows for entry : *Normally an UP arrow in an UP Trend is a BUY signal : ---you Close the BUY position IF a Reverse DOWN Trend signal appears Or when Up trend li

MiK RSI Safe is a very safe EA. New Update Apr 05 2020 version 3.0 :
1) Discover dipper in the market so that decrease wrong position. 2) More rule for the profit, so that it don't going too far in wrong direction. 3) More rule for the next grid, so that it can fix the first position better. 4) More note to make sure you don't make it wrong before start the EA. 5) Main Update: Hedge strategy added, we can earn even first position wrong. Hedge also shut the first position down if it found th

Cusiosity 12 The Pullback Signal It is an advanced trading system. This is a fully automatic Expert Advisor, which allows you to presize the trade according to the preferences of the trader. Cusiosity 12 The Pullback Signal have more than 260 customization options for your trade. Different options for different styles of trade. This EA using signals to place orders. Is a revolution in the customization of the trading. The algorithms developed for the identification of areas of chan

Smart and simple Indicator based on wolves waves reversal pattern also near to falling and rising wedge and butterfly patterns with Stoploss and entry signal preferred time frame M30 : with parameters bars count used for calculation = 200 and moving average for accuracy = 100; you can try it for other higher or lower parameters and try your own set of inputs higher timeframe = lower input !!! important note ::: Indicator don't back draw when first installed on Chart
once installed wait for new

BBMAV 交叉机器人 是一款功能强大的工具,旨在自动执行 布林带和移动平均线交叉策略 。它结合了多个指标来生成可靠的交易信号。通过利用这些指标的交叉,机器人识别市场中潜在的进入点和退出点。交易者可以根据自己的喜好自定义指标设置并激活或停用特定功能。 机器人的主要信号 BBMA 交叉可以使用其他指标进一步过滤,例如成交量、震荡指标、RSI 和移动平均线交叉。这使交易者可以完善他们的策略并提高交易的准确性。 为了保护利润和最大化收益,BBMAV 跨界机器人采用了现代尾随系统。此高级功能会随着交易的进行自动调整止损水平,确保锁定利润并将潜在损失降至最低。 此外,机器人结合了适当的风险管理系统,使交易者能够有效地控制他们的风险敞口。通过定义手数、最大风险百分比和减少因子等参数,交易者可以自信地管理他们的交易。 BBMAV Crossover Robot 提供完全可定制的指标集,使交易者能够根据其特定的交易风格和偏好定制策略。每个指标都可以根据交易者的需要单独激活或停用。 请务必注意,提供的默认设置并未针对最大利润进行优化。交易者可能需要微调参数以符合他们的交易目标和市场条件。 凭借其全面的功

Purple Ice Purple Ice is a bias trading robot that sells and buys at predefined hours on specific days. It has been developed on three crosses, EURJPY , EURAUD and EURNZD on H1 timeframe.
Key Features Absence of dangerous algorithms. It works just when the bar is closed. Each order has a protective dynamic SL and TP level based on the current volatility. Easy to use, optimization not required, very few parameters.
Description of the Main Expert Advisor Settings Magic Number : self-explicative

For Meta Trader 4. We have all experienced a situation where the market wipes out our stoploss before it turning in the direction we had anticipated. This is experience becomes more frequent when we use a trailing stoploss. If only there was a way to place and trail the stoploss just the perfect amount of pips away. Well, there is... The Average True Range (ATR) is a one of the most popular technical analysis indicator, introduced by J.Welles Wilder, that measures Market Volatility for a give

Auto redrawn Pivot support resistance horizontal lines with signal of Buy/Sell possibilities with SL level and with trend support resistance lines too used for all symbols and time frames you can adjust inputs parameters (only 2) and test it on various symbols and time frames input number of bars for calculation and moving average for signal accuracy example : use it on M30 time frame with input 200 for bars count and 100 for MA

Turbo Pro - Advisor uses a number of indicators to search for signals for entry. It works in fully automatic mode! Use default settings. Unlike alternative developments, this bot can simultaneously trade on both buy and sell. This is a significant advantage in real work because it makes it possible to achieve significantly better results due to increased capitalization. The bot works like a scalpel with sharp price movements, or uses series closures by averaging the overall position. Turbo Pro

海滩旅行EA
这款EA是为认真的交易者设计的,他们变得过于严肃,需要放松,并且仍然有一些不错的交易,设置如此简单,可以在任何图表上运行
机器人将在1分钟,5分钟和15分钟图表上连续扫描。请参阅《策略测试人员指南》以了解您的历史记录数据是否足够有效。
EA并没有针对任何一种货币进行优化,因此资金管理不会持续很长时间,也不会在某些货币对上形成不切实际的抛物线。
赢利,每月以新的更新资本设置重新启动EA。
阅读下图中的重要说明。
看看我的其他产品海滩波分流指示器,这对交易者来说也很棒。
如何自定义EA
在输入选项卡下,您将看到一些可自定义的选项,可以对其进行调整以在每个符号/对之间进行优化。
Beach Trip EA使用最少的设置进行自定义。
如果您认为技术分析有效(就像我一样!!),那么您就不必使选择过于复杂吗?
EA与海滩波动指标一样,也意识到市场的差异。
强烈建议使用VPS来连续扫描市场
您可以更改以下内容:
1.指标的RSI周期。 (整数/无小数)
2.固定手数:设置为true可以手动打开手数,但是如果设置为false,则

Despite the popularity of inside bar pattern among the traders, using it as a standalone signal doesn't provide any edge in the market.
KT Inside Bar Advanced indicator solves this problem by combining the classic inside bar pattern with the "ECE" cycle and Fibonacci extensions. Using this indicator in place of our classic inside bar indicator will provide a tremendous advantage and edge in the market.
What is the ECE cycle?
In financial markets, the price never moves in a straight line but u

Galactic Volume spread analysis (VSA), is an indicator designed for the visualization of the Volume, and the proportion in which it affects the volatility of the spread of the different pairs.
The strategy consists of the following:
Bull Trend: Always going in favor of the trend, open buying operations at the lows of the trend, provided that it coincides with a high volume shown by the Galactic VSA indicator. Downtrend: Always going in favor of the trend, open sales operations at the highs of
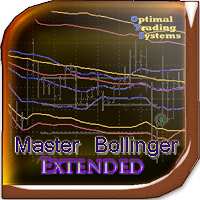
This Expert Advisor is an improved version of Master Bollinger Bands and has more settings; it can set stop loss per parabolic. Added parameters to improve optimization (for example, to discard profitable settings, but with a small number of transactions).
Like the regular version, the adviser can close positions by a return signal, take profit and stop loss, set the transaction to breakeven when it reaches the center line of Bollinger or at a given value. It can use up to 3 Bollinger indicato

This EA has been developed for EURUSD M30 timeframe. Everything is tested and ready for immediate use on real account. This Expert Advisor is based on BREAKOUT of the PREVIOUS CANDLE CLOSE after some time of consolidation . It uses STOP pending orders with FIXED STOP LOSS and TAKE PROFIT . Very SIMPLE STRATEGY with only FEW PARAMETERS. At 9:00 pm we are closing trading every Friday to prevent from weekly gaps. !!!Adjust these times to your broker time. Preset values are for UTC+2 only

Strategy – Bollinger Band, Moving Average and Price Actions. Bollinger Bands to identify High-Low Price, Moving Average to identify Trend and Price Action is to synchronize both of them. SardaFx 4.1 has average holding time 24 hours (1 day) on timeframe H1. It is not a Martingale EA or Averaging EA. The work is simple, BUY and Exit or SELL and Exit. No recurring BUY and or SELL in the same time and the same symbol except you adjust Max BUY/SELL more than 1,default setting is 1 BUY and 1 SELL.

The Order Manager Script is a user-friendly designed panel on your chart that can help you to manage your opened orders by using its special tools. It calculates the breakeven price for Buy or Sell orders and can close all Buy or Sell orders instantly or in their breakeven price plus some profits (as your selection) in less than couple of seconds. Also it can close all orders in profit or all orders in loss in your account instantly. -Sometimes you opened several Buy orders (or several Sell orde

This is script to check what is max lot allowed on a currency pair , so you need to drag this script to a currency chart and this utility will print max allowed lot with available balance. Sometimes we need know maximum allowed lot information for some purpose so this script will really help to know the lots allowed with given balance in live account for any broker . Hope explanation will help.

A unique multicurrency and multi-timeframe strategy developed by a team of LATAlab specialists. Strategy Profit Creator by LATAlab has been tested and verified by our team. This will allow you to earn maximum profit comfortably and efficiently. Strategy features Profit Creator by LATAlab never redraws. Works on any trading symbol. Time frame - from M1 to MN. Automatically detects Buy, Sell, Take Profit, Stop Loss levels. The indicator is equipped with a convenient information panel in which all
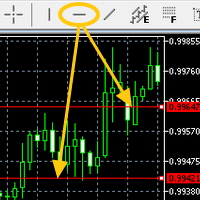
Attach the indicator on the chart and draw the red line from the button on MT4's built-in menu bar then the alert will be sent to you(push,email,popup and sound)
Hi You all know the red line (the MT4 built-in red line) drawn from the menu bar on MT5. It is often used to check the resistance etc.....It is very useful but it is little troublesome to get an alert(sound, push, email and popup) when the red line is touched by the price. Here is Price Touch Alert indication, just use the button to

You can: observe the price chart inside the chart of a different price evaluate correlation and relationships observe the difference in charts in the form of a histogram
Opportunities: "Auto" mode - auto-adjust the chart for another chart "multiplier" - you can multiply the chart by any number shift up / down the chart by value shift the chart to the left "invert" - mirror flip of the chart
Important: only charts added to MarketWatch are used Version for MetaTrader 5 - https://www.mql5.com/e

Do you think it's a bit cumbersome when you need to switch symbols or timeframes with mouse click? 1. What is this? This is a program that can switch symbols and timeframes with direction keys. Fast switching, very convenient, no mouse click required. For traders, one symbol with multi-timeframe charts are usually added, you can change symbol on those charts easily. For multi-currency traders, different symbol charts are usually added, you can also change those timeframes easily. I wrote this p

Direction Trend indicator. Shows the direction of the current trend. Colors bars in red and blue. It works on all currency pairs and on all timeframes. Do not forget that the approach should be comprehensive, indicator signals require additional information to enter the market. The principle of the indicator is that when placed on a chart, it automatically determines the current state of the market, analyzes historical data, based on historical data.

Martingals indicator works on all currency pairs and on all timeframes. The arrows indicate the optimal entry points for future Martingale averaging, even with a zero exponent. The indicator shows a signal to close the series only if all previous signals can be closed in profit. After closing a series in profit, you need to immediately open an order in the direction of the signal. Thus, the close signal is at the same time the reverse opening point to the other side of the new order. The probabi
Introduction
Ultimate Arrows Prognosis is a unique indicator, in which the signals are actually rendered without delay! This fact, unlike other indicators, allows traders to respond to the current market situation and achieve to high quality and efficient analyzes.
This indicator does not redraw and never changes the previous signals! And so, you know, that every signals, which is possible to see in history, will this unique indicator show exactly the same in the future. With this indicator,

EA 每天早上 7 点都会设置待定的买入止损和卖出止损,以便捕捉未来一天可能出现的向上或向下突破。 如果订单没有被触发,它们就会在晚上午夜之前被删除。 默认设置使用 1000 点止损和止盈,并且 EA 具有可通过输入参数启用或禁用的鞅放大系数。
默认设置:EurUsd,H1 时间范围。
在 H1 时间框架上使用,外汇主要货币对:EurUsd、GbpUsd、AudUsd、UsdJpy、UsdCad、UsdChf。
最新的设置可以在“评论”部分找到。
EA 每天早上 7 点都会设置待定的买入止损和卖出止损,以便捕捉未来一天可能出现的向上或向下突破。 如果订单没有被触发,它们就会在晚上午夜之前被删除。 默认设置使用 1000 点止损和止盈,并且 EA 具有可通过输入参数启用或禁用的鞅放大系数。
默认设置:EurUsd,H1 时间范围。
在 H1 时间框架上使用,外汇主要货币对:EurUsd、GbpUsd、AudUsd、UsdJpy、UsdCad、UsdChf。
最新的设置可以在“评论”部分找到。

The expert advisor opens trades when the forex market is ranging and the NITRO PIPS indicator enter in oversold or overbought areas. The Stop Loss, Take Profit, and Trailing Stop are calculated based on the ATR indicator. Verify the recommended currency pairs for the current market conditions here and the recommended timeframe to operate and to do backtests is M5 . For better results you must use a broker with Low Spreads . Recommended Settings at Comment #2

Special Volume - Volume indicator, in the Forex market volumes are peculiar (teak). Why is Forex not possible to track normal volumes? The fact is that it is an OTC market. Therefore, it is practically not realistic to calculate the volume of purchases and sales by one instrument. Many Forex traders completely abandon volume indicators in their work. But for those who want to use them, there are some interesting tools, and one of them is Special Volume. The Special Volume indicator shows the ave

Dolphin Bands indicator works equally well on any timeframes. For medium-duration trends, it is recommended to use the standard setting. To study long-term trends, it is recommended to use an indicator value greater than the standard. To analyze short-term trends, it is better to use a lower indicator value. Most often, an exponential method is used to calculate the indicator, but other varieties can also be used.
Dolphin Bands is a collection of lines. The two center lines of the indicator ar

This trading robot has advanced methods of measuring volatility and measuring the standard price range. It places a trading order when the market breaks through the "standard price range" and other trading conditions are met. ::::::::::::::::::::::::::::::::::::::::::::::::::::::::::::::::::::::::::::::::::::::::::
TOP PRODUCTS https://www.mql5.com/en/market/product/30353 :::::::::::::::::::::::::::::::::::::::::::::::::::::::::::::::::::::::::::::::::::::::::: Only one trade is always open

This indicator can track the steady price movement in a certain direction. In this case, the movement itself can be downward, upward or lateral, when the market movement does not have a pronounced focus. The indicator works on the basis of two moving average as well as an oscillator. Using the signal search algorithm, the indicator generates signals in the form of arrows.
Benefits. Allows you to determine the current trend. You can quickly enough understand which particular trend is currently

Yggdrasil is a fully automated hedging system . The EA opens orders in both direction on the chosen pairs by the user. Currency pairs aren't traded individually, all trades opened are part of the system. The algorithm will close the unprofitable orders with the available profit. It prevents drawdown to increase if a big trend occurs on a currency pair.
The EA is designed to be efficient with minimal settings . No need fine tuning parameters, it's a long term "set & forget" expert advisor.
As t

The indicator calculates the saturation levels of the price chart. A signal to exit the resale area is a buy signal. A signal to exit the overbought area is a sell signal. Usually, you need to set relative values for the overbought and oversold levels of Bottom and Top - for this indicator.
Most often, a good trend is visible on the price chart visually. But an experienced trader must clearly understand the current balance of power in the market before entering. And the indicator will help t

Strategy for trend trading. The indicator shows entry points and displays TakeProfit and StopLoss levels on the chart, as well as calculates the overall result. ATTENTION! TI Opti Pro – a powerful tool for testing the input parameters for the TrendImprovement indicator will allow you to quickly find the most profitable options for the input parameters. New project.
Description.
It is no secret to anyone that there is no universal indicator that would be profitable on all currency pairs and ti
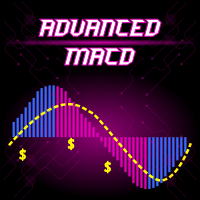
Advanced MACD is a safe and fully automated EA. This EA uses MACD indicator with double confirmation set and filtering by range of latest price movements. Every order has stop-loss and the EA has implemented advanced filtering functions together with spread and slippage protections. This EA does NOT use the dangerous strategies like Martingale, etc. Advanced MACD is NOT a tick scalper that produces high number of trades per day and it is NOT dependent on every point of price. This EA is

Trade History Exporter automatically exports trade history to a CSV (comma separated values) file.
Trade History Exporter: - automatically exports trade history every time a trade is closed - allows you to manually force an export by using the "W" key on your keyboard - can use Order Comments as Magic Numbers - useful for instance when using a Trade Copier - calculates the Net Profit per trade

Vik Two plus - two strategies in one EA. Overclocking - (aggressive), or calm trading. It's simple. Trading is carried out by pending orders, which are placed, at a specified time, at a distance from the close of the daily candle. Distance is measured by the ATR indicator. And also the direction of the previous daily candle can be used as a filter. And in addition there is * Martin * - by ATR, for averaging positions. There is no Stop Loss, since the Expert is calculated only to make a profit.
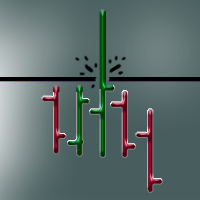
Панель предназначена для быстрого визуального нахождения и отображения ложных пробоев по всем периодам и на любых выбранных валютных парах одновременно . Цвет сигнальных кнопок , указывает на направление возможного движения . По клику на сигнальную кнопку , осуществляется открытие графика с данным паттерном . Отключить не используемые периоды , можно кликом по его заголовку . Кнопка "All" открывает графики всех сигналов по данному периоду . Имеется поиск в истории ( по предыдущим барам ). Прокру

Советник ProfitHUNTER - новейший советник с уникальной фильтраций первого входа, который позволяет торговать с минимальным депозитом и отличным результатом. Сделки не частые, но результативные . Этот советник - настоящий охотник. по результатам тестов нет минусовых сделок! Советник очень прост в настройке: из настроек Вам нужно указать лот первого ордера (Minimum lot) и сумму реинвестирования (Money for min lot) ТОЛЬКО EURJPY! Таймфрейм м1
Входные параметры: Chose settings : EURJPY Magi
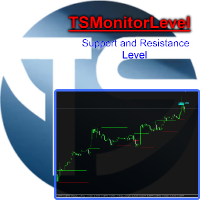
Indicator, which draws supports and resistances. Algorithm that calculates the entry zone of the position and the possible target. The benefits you get: Never redesigns, does not retreat, never recalculates. Works on forex and CFD, timeframe from M1 to Weekly. Integrated pop-up, push notification and sound alerts. Easy to use.
Parameters: SENSIBILITY = indicates the importance of levels, we recommend a minimum value of 1.0
PERIOD_BAR = indicates how many bars are considered for volatility, w
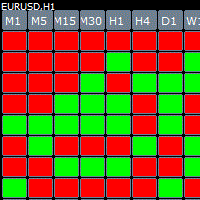
Cube indicator represents the original candle stick chart but in a top down cube form in order to see previous patterns in the markets more easy. The indicator has build in alert once there is a consecutive 3,4,5 bars in a row you get an message.
Parameters Bars_Limit = total visible cubes
TF_M1 = true; TF_M5 = true; TF_M15 = true; TF_M30 = true; TF_H1 = true; TF_H4 = true; TF_D1 = true; TF_W1 = true; TF_MN1 = true; Table_Position_X = 20; Horizontal shift Table_Position_Y = 40; Vertical sh
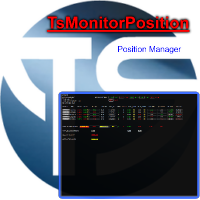
Utility, which displays all your market positions. Analyze: The clear exposure of each currency. Total orders Total lots Profit and loss for every cross. Percentage reduction of positions. Closing of the entire basket, or closing only positive or negative positions. Etc. The benefits you get: Each button will open a pop up to inform you of its usefulness Works on forex and CFD. Easy to use. Parameters
Template = Default.tpl; possibility to open your favor

Average Daily Weekly Monthly Range Alerts.
The most complete multi-period dynamic range indicator with full alert options. Visually displays the Average Range lines on chart + real time distances to the Range Highs and Lows. Notifications are sent when the average ranges are hit. An essential tool for any serious trader! Average period ranges, especially the ADR (Average Daily Range) for day traders, are one of the most useful and consistently reliable indicators available to traders. Always av

TRADING PAIR: EUR/USD CANDLE TIME: 5M BROKER: IG https://www.ig.com
LEVERAGE: 1:200
NOVA EurUsd EA uses RSI , CCI , Stop Loss and it locks profits and sustains little drawdown by trailing its profits.
Bars in test 262084 Ticks modelled 75562166 Modelling quality 90.00 % Mismatched charts errors 4 Initial deposit 10000.00 Spread Current ( 6 ) Total net profit 3417.50 Gross profit 33101.90 Gross loss - 29684.40 Profit factor 1.12 Expected payoff 0.64 A

該專家被設計為根據移動平均線,MACD,較大時間框架的趨勢輸入訂單,並具有沿相反方向(反向)進入市場的能力,還可以分析貨幣對及其特徵以幫助決策。投資。 該頭寸由止損和基於價格的靜態止盈繪製。
操作方式: EA適用於常規可變點差經紀人,通常在以下貨幣對上效果最佳:( USDCHF,EURUSD,USDCAD,AUDUSD,EURGBP,EURJPY ) 首先建議在模擬帳戶上運行Octopus,以查看哪種設置最適合您的經紀人,因為每個經紀人使用不同的流動性提供者和軟件服務。
期間: H1和M30 。
批次是自動計算的,也可以是固定的。
採取止盈和止損功能。 與4到5位數字經紀人一起使用。 傳播過濾器。 降低保護。 EA面板上的EA信息。 3種類型的資金管理(固定手數,已計算手數,EA內部比例)。 調整可調整的交易時間。 超級超級進出市場的高級算法。
可配置參數:
-選擇所需的設置類型:交易者可以在Robot_Setup或My_Setup之間進行選擇,我們建議您先選擇Robot_Setup選項。 -選擇比例手數或固定手數:默認情況下,手數是按帳戶餘額的數量成比例計算的,

Ez 通道 指标是趋势跟踪交易者的重要工具,因为它会自动识别图表中的真实趋势通道。使用此指标,您不再需要花费数小时在图表上手动绘制趋势线。它可以为任何交易品种和时间框架快速绘制趋势通道,从而节省您的时间和精力。 Ez Channel 的主要功能之一是其迷你控制面板,可让您根据自己的喜好轻松调整时间段。此控制面板还使您能够在新的市场变动发生变化之前保存已识别的渠道。此功能确保您可以轻松跟踪和分析市场趋势,而无需重新绘制趋势线。 Ez Channel适用于所有交易品种和时间范围,使其用途广泛,适用于各种交易策略。它为您提供了保存已识别频道以供将来使用的便利,并且您可以在任何时间范围内查看这些已保存的频道。此功能允许您比较和分析不同时间范围内的趋势,从而增强您的交易决策过程。 无论您是经验丰富的交易员还是新手,Ez Channel 都提供用户友好的界面和易于调整的参数。它旨在简化趋势跟踪策略,让您轻松跟踪趋势并做出明智的交易决策。该指标在识别趋势通道方面的准确性和可靠性有助于其作为交易工具的有效性。 凭借其强大的功能和用户友好的设计,Ez Channel 是任何想要最大化其趋势跟踪策略的交易

Cash Cow is a fully automated Expert Advisor with no use of martingale. Night scalping strategy. The SMA indicator filter are used for entries. This EA can be run from very small accounts. As small as 25EUR.
General Recommendations The minimum deposit is 100USD . Use a broker with good execution and with a spread of 2-5 points.
This EA works best at an 1:500 leverage account with small spread and microlots 0.01.
I recomend http://www.icmarkets.com/?camp=28024
Default parameters are dedicated

Fully automatic trading system.In this robot, I decided to combine four trading strategies at once-three trend strategies based on several technical indicators and one - scalping.These are two robots in one "Trend Analyzer Pro" and "Pound & Euro Grabber".Using this trading technique gives a more stable yield and drawdown by hedging losing trades .Testing was performed on tick data with 99.9 quality % The risk level should be set in the ratio 1/3 .That is, we allocate only the 3rd part of the fu
the best indicator to put your own fingerprint on your products, put your signature and protect your rights easily and simply. You can customize any program (indicator, Expert or script) by choosing your own signature and your favorite color, adjust the indicator properties to suit your needs, and change your signature at any moment you want with this wonderful indicator.

This EA has been developed for LIGHT CRUDE OIL (WTI) M30 timeframe. Everything is tested and ready for immediate use on real account. This Expert Advisor is based on BREAKOUT of the KELTNER CHANNEL after some time of consolidation . It uses STOP pending orders with FIXED STOP LOSS . To catch more profit there is also a TRAILING PROFIT function provided. At 9:00 pm we are closing trading every Friday to prevent from weekly gaps. !!!Adjust these times to your broker time. Preset

CRYPTOCURRENCY: XRPUSD (TUNED)--- Can work for other currencies but needs tuning CANDLE TIME: 5M For best results BROKER: http://Hugosway.com LEVERAGE: 1:50
ICECOLD MA works off of Moving averages when they cross. It uses Trailing stop(Trails profits) and has a very tight stop loss . Very simple BUT effective EA * BACKTESTING MATCHES LIVE DEMO
RECOMMENDED DEPOSIT: $2000
* REMEMBER TO EITHER HAVE A VPS OR CONTINUE TO RUN ON COMPUTER 24/7*

Cryptocurrency - XRPUSD/BTCUSD Candle Time - 5 m Leverage - 1 : 5 Account Minimum Recommended - $ 3000 This strategy uses Martingale, RSI, CCI and a few others for entry points. *BACKTESTING MATCHES lIVE DEMO* DATE: 2018 - OCT 2019 CURRENCY: XRPUSD CANDLE TIME: 5 M Bars in test 137239 Ticks modelled 5913780 Modelling quality 90.00% Mismatched charts errors 0 Initial deposit 3000.00 Spread 95 Total net profit 5297867.03 Gross profit 5736213.23 Gross loss -438346.19 Profit factor 13.09 Expecte
MetaTrader市场是 出售自动交易和技术指标的最好地方。
您只需要以一个有吸引力的设计和良好的描述为MetaTrader平台开发应用程序。我们将为您解释如何在市场发布您的产品将它提供给数以百万计的MetaTrader用户。
您错过了交易机会:
- 免费交易应用程序
- 8,000+信号可供复制
- 探索金融市场的经济新闻
注册
登录