适用于MetaTrader 4的EA交易和指标 - 269

Ilan RGD Ilan RGD -это аналог советника, с добавлением множества дополнительных логик и возможностей для торговли, с оставленными настройками советника . Советник торгует по системе Мартингейл с увеличением последующих лотов в серии ордеров, с целью их усреднения. Первый ордер робот выставляет по сигналам встроенного индикатора. либо сигналам своего индикатора пользователя(имеется возможность встроить его в советник). Так же советник имеет возможность прекращать торговлю в зависимости от новост

Fx Kryptonite Советник Kryptonite не имеет аналогов , он создан на основании опыта торговли на рынках более 15 лет. Советник имеет хорошую информативность и показывает отличную доходность, но всё же, в основе советника -это безопасность торгового счёта. Имеется множество включаемых торговых модулей которые улучшают торговый процесс робота и трейдера, так же есть возможность подключения новостного индикатора и подключение своего индикатора. В советнике имеется торговая стратегия "Волна", кото
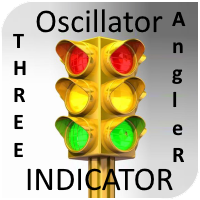
The triple oscillator indicator " ThreeAngleR " is a common indicator for three calculators of the angular deviation of the price chart of a trading instrument.
INPUT PARAMETER: Input1 = " AnglerSPeriod "; - DRAWs1 =128 - Number of bars to display the indicator in the chart history; - PeriodIND =14 - calculation period of the indicator in the number of bars; Input2 = " JAngleR "; - DRAWs2 =128 - Number of bars to display the indicator in the chart history; - Period_IND =14 - calculation period

Welcome to the DCC Forex Expert Advisor
As for this self made EA , the winning rate is 79%
it is a self made Forex automated Software by myself . The robot works on every broker as well as cent brokers.
I wish everyone who purchases the EA maximum sucess and good trading results
Please trade carefully and responsibly. Thank you and Happy trading everyone Thank you and happy trading

Long Term Investment Software
This EA is created to work on all Time Frames and all Currency Pairs. You do not need to do much. The file is ready to be used for 1H Frame or Higher. But of course you can play around with the settings and choose your favorite frame. Very Simple made and easy to understand. Different settings possible SL and TP Trailing Stop Martingale The Ea is very good for longterm Growth Works best on higher Time Frames as there will be more data collected. It works as well on
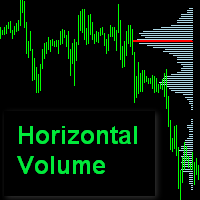
Horizontal Volume Profile indicator shows volume distribution for some interval. The lines length is proportional to traded by this price volume. Input parameters : Interval = 0-the indicator is recalculated daily at 00: 00, Interval= 1..5 -the indicator is recalculated on a given day of the week (Mon..Fri.) Count Of Days= 1..30 - analysis days. PipStep= 10 - scan range step. The larger it is, the faster and coarser the count. It doesn't make sense to set it to less than 10 points (the default v
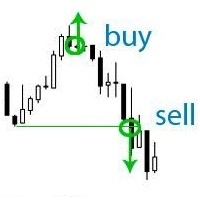
If your deposit is in a drawdown - this EA will help you get out of it!
DEPOSIT SAVER will lock your position in order to prevent the drawdown from increasing significantly, and then will close all orders to breakeven. Please note that it is not the EA task to bring you profit. The EA task is to withdraw you from the drawdown and close all positions to zero. 1. Before installing the EA on the chart, delete the stop loss of your orders, if any; 2. The EA works only with sell or buy orders. If th
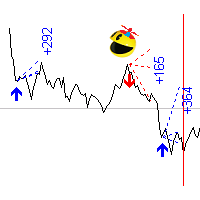
Simplified release of PACman EA. Expert is multycurrency, thus it is no use to test it in the MT4 terminal. So, watch for real signal and joing to telegram channel. After setting the pairs, the expert Advisor simulates trading for the previous period with visualization of the results. The user can interactively change the signal levels and observe their impact on the simulation result. In this way, you can select the optimal level values. By manually moving the vertical boundary lines to the ri

Bossman EA Ver 1.1 Is the Scalping Forex Expert Advisor for MT4 Bossman EA Ver 1.1 Working on Timeframes (M5) Bossman EA Ver 1.1 Best Trigger Setting on Pair EURUSD or USDCHF Bossman EA Ver 1.1 Calculation is based of Envelopes indicator ///////////////////////////////////////////////////////////// (I N D O N E S I A (ID) (Rakyat +62)) Bossman EA Ver 1.1 Adalah Penasihat Ahli Scalping Forex untuk MT4 Bossman EA Ver 1.1 Bekerja pada Jangka Waktu (M5) Bossman EA Ver 1.1 Pengaturan Pemicu Terbaik
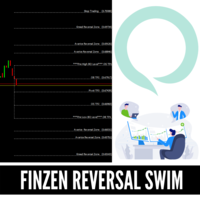
REVERSAL FINZEN LEVELS More than a regular indicator is a complete system with Entry levels, Stoploss, AND TakeProfits Levels. This System indicator is Based on Our Private Strategy that has been using During A while with our Private FUNDS, this indicator can be used in stocks, FOREX CFD but mainly use with amazing results in FOREX Markets.
This indicator will detect in some specific levels when market reversal so you try to sell when market is OVERBOUGHT and Sell when market is OVERSOLD with

This EA has been developed for GBPUSD M15 timeframe. Everything is tested and ready for immediate use on real account. This Expert Advisor is based on RSI indicator. It enters if DIVERGENCE occurs after some time of consolidation . It uses STOP pending orders with ATR STOP LOSS and FIXED TAKE PROFIT . To catch more profit there is also a TRAILING PROFIT function provided. Very SIMPLE STRATEGY with only FEW PARAMETERS. At 9:00 pm we are closing trading every Friday to prevent from week

Expert adviser uses a breakout strategy when opening all orders without exception. Trading is conducted exclusively by pending orders. Entry points are located at local minimums and maximums, some levels are excluded with the internal filter of the EA. The maximum number of orders is set in the settings. The EA automatically determines the number of digits in quotes, so the user does not need to think about it and make the appropriate changes to the settings. You can use any type of account, suc

引入 Watermark Manager Utility ,这是一款功能强大的工具,旨在毫不费力地将个性化水印添加到您的图表背景中。凭借其独特的自定义选项,您可以使用多个文本字段和帐户信息字段创建令人惊叹的水印。无论您是 YouTuber、信号提供者、博主,还是需要水印图表的任何人,此实用程序都是您的最佳选择。 此实用程序支持多图表功能,使您可以轻松地为所有打开的图表添加水印。它提供完全可定制的水印区域,让您可以控制字体、字体大小、颜色、角位置、距离等。您可以灵活地显示重要信息,例如经纪商、客户、服务器、余额、利润、代码、时间范围和代码 + 时间范围。 由于其用户友好的参数,使用 Watermark Manager Utility 轻而易举。只需配置设置以满足您的要求,该实用程序将处理其余部分。它使您能够同时在多个图表上绘制多个水印,从而节省您的时间和精力。 有 13 个水印文本字段可用,包括两个自定义文本区域和一个帐户信息显示区域,您有足够的空间向图表添加品牌元素或个人信息。该实用程序可确保您的水印有策略地放置,允许您选择图表的角和距离。 无论您是想提升您的品牌形象、保护您的内容

*This Price for only limited time and limited copy to 1 year rent. **Signal page can be found this link https://www.mql5.com/en/signals/614621 PDADaily Expert Advisor This expert advisor works well on daily charts. Opens a pending order based on daily price movements and may revise this pending order based on price movements during the day. It can keep the current order by following the price movements and can open additional orders as soon as it sees the opportunity. If a re-entry condition
The adviser uses a strategy based on the use of 7 Envelopes indicators, on each timeframe (M5, M15, M30, H1, H4) there are 7 Envelopes indicators. Trading is based on the “Price Action” strategy, the adviser searches for a simultaneous signal on 5 time frames: M5, M15, M30, H1, H4 and then opens an order. The EA uses the built-in Martingale and Averaging algorithm. The adviser uses economic news to achieve more accurate signals. Hidden Take Profit, Break Even and Trailing Stop are used. Real m

Dual Horizontal - a whole new level in the automatic Forex trading. The adviser uses a support / resistance strategy. All transactions occur within a day. A smart algorithm for constructing price breakout levels is used. Backtesting was carried out on real ticks with a history quality of 99.9%. Many years of experience have borne fruit and we have managed to create a new generation of robots. There are no risky strategies, small stop losses and large price slippages.
Working currency pair / tim

На счёте более 11000$. Я на 100% уверен в своём роботе! Доверьтесь и вы! Ссылка на мониторинг: https://www.mql5.com/ru/signals/631995 Для начала торговли достаточно небольшого депозита. Идеален для быстрого разгона депозита!!! Подходит для мультивалютной торговли. Невосприимчивость к большой задержке и величине спреда.
Принцип работы Эксперт торгует сеткой с мартингейлом.
Рекомендации Рекомендую использовать мультивалютную торговлю. Для этого запустите советника на 4 - 8 валютных парах!!!
This is a Longterm Investment EA
In times where the interest with your Bank is 0 or negative, that EA can generate good longterm profit.
You will have more options to runthe EA Standard Option TP and SL Martingale Trailing How you run it depends on you. Works on all Frames and all Pairs. My recommendation Martingale or standard with trailing stop I recommend the current settings and run it on the Day Chart for Longterm Investment Be aware that different Broker have different Times and spreads

Levels Market is one of the simplest, but no less effective tools from this. Pivot points can be built from these levels, levels are constructed as statistical significance at a given point in time. Trading by levels is a classic in the work of a trader. You can use them as a ready-made trading strategy or as an additional filter in your trading system. In the settings you can specify the offset for building levels.
Interpretation of levels: Lines 8/8 and 0/8 (Final Resistance). These lines ar

The 27x GBPUSD ninja
"The 27x GBPUSD ninja" is an EA that makes sure to get profit from the market using refined abilities like a Japanese ninja. It comes loaded with RSI and an indicator using a unique logic. The setting is simple and easy.
Setup
$1000 or more initial margin is recommended. Please use this EA on the GBPUSD currency pair on a 15 minute chart. It is extremely lightweight and has no problem running with other EAs at the same time.
Backtest
If you are backtesting, please us

EA introduction:
Gold long short hedging is a full-automatic trading strategy of long short trading, automatic change of hands and dynamic stop loss and stop profit. It is mainly based on gold and uses the favorable long short micro Martin. At the same time, combined with the hedging mechanism, long short hedging will be carried out in the oscillatory market, and in the trend market, the wrong order of loss will be stopped directly to comply with the unilateral trend, so the strategy can be a

Funcionamiento: Athome funciona de la siguiente manera: En el momento en que usted ponga a funcionar el expert , éste colocara ordenes pendientes de compra (BuyLimit) hacia abajo del precio, y ordenes pendientes de venta (SellLimit) hacia arriba del precio. usted podra modificar las variables de Athome en los parametros de entrada. Recomendamos los siguientes parámetros para un funcionamiento eficaz: lot = 0.01 StopLoss = 3500 TakeProfit = 850 Distance = 50 OperationsAmount = 75 EarningPercent

Candle Inside indicator - draws Japanese candlesticks of a higher timeframe on the chart. Now, after loading the indicator, it is possible to see what is happening inside each candle. In addition to the standard buttons for selecting the timeframe in the MT-4 terminal, additional buttons are added, when clicked, an older period is selected to display Japanese candles or zones. For example, if you select the standard period M1 and the period of the indicator M5, then the chart will display minute
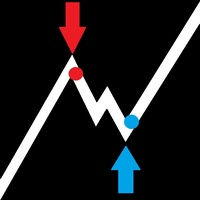
EnE EntryDotPro is a unique development for traders who are not confident in their trading and cannot find a working strategy. The indicator is suitable for all instruments and for all time frames. The indicator works in all market situations in trend and flat. Also, the indicator is specially made very simple in settings and in use so as not to distract traders from trading. The indicator shows the signal in the place where the point appears, also to make it easier to trade along with the poin

EA開市後一定數量的價格變動後關閉市場訂單。如果您需要在一定時間後完成交易,請使用此顧問。
EA具有以下輸入參數:
僅當前交易品種-如果為true,EA將僅關閉所選工具的訂單;如果設置為false,它將關閉任何工具的任何訂單。 超時-EA將關閉訂單的訂單數量。 請注意,如果參數only current symbol = false,則所有訂單將同時關閉,而不管哪個訂單早先打開,哪個以後打開。
EA簡單易用,不消耗不必要的計算機資源,並且沒有任何額外的設置。建議在不重新報價的帳戶上使用。 _______________________________________________________________________________________ EA开市后一定数量的价格变动后关闭市场订单。如果您需要在一定时间后完成交易,请使用此顾问。
EA具有以下输入参数:
仅当前交易品种-如果为true,EA将仅关闭所选工具的订单;如果设置为false,它将关闭任何工具的任何订单。 超时-EA将关闭订单的订单数量。 请注意,如果参数only current symbol =

This EA allows you to duplicate any order coming from a signal provider with a specified lot size, opening and closing accordingly, included stop loss and take profit. The EA must be connected to a graph and works automatically on all orders, independently from the symbol. It can work also on Hosting. Please consider that duplicating signals will rise your risk! Take it into account.

Turbo Fix - the adviser uses a number of indicators to search for signals to enter. It works in fully automatic mode! Use default settings. Unlike alternative developments, this bot can simultaneously trade on both buy and sell. This is a significant advantage in real work because it makes it possible to achieve significantly better results due to increased capitalization. The bot works like a scalpel with sharp price movements, or uses series closures by averaging the overall position. Turbo F

A trend indicator, and not the first view, is a regular indicator, but it can be used with an optimal risk coefficient. The principle of work is simple - the indicator shows the moments for entering the market with arrows, which is very easily perceived visually.
It is recommended to use an oscillator with an additional indicator, for example, standard RSI. You need to respond to level 50. Or use some other confirmation system.
The indicator can be used both for piping for small periods and f
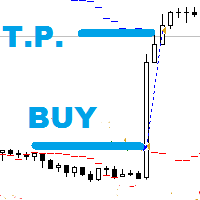
The expert places pending orders around important trade levels and if they are activated whithin the input validity of the order they may be closed by Take Profit , Stop Loss , by implemented indicators (Williams Percent Range , Bollinger Bands , Momentum) or by the number of candles passed since the order has opened . It also has BreakEven , TrailStop and AutoLot management functions . Preferred pair : USD/JPY ; Timeframe : H1 ;

This EA has built-in trend Stochastic, RSI and EMA Cross indicators to check the trends before performing any trading action. It's engine is provided with: trailing Stop Loss; bad time to trade filter for each day of the week; enable and disable martingale mode; define the maximum spread value to trade; define the minimum equity percentage to allow trading; the input values are already optimized for EURUSD at timeframe M30. The Strategy This Expert Advisor uses its built-in trend indicators com

The indicator displays two RSI lines of different Symbols and a histogram of the difference between them modulo. Symbols names are set in the settings: First Symbol Second Symbol Next, you can enable mirroring for the RSI line of the second Symbol. This is necessary to control the divergence of RSI lines for symbols with inverse correlation. For example, if you compare the RSI readings of the EURUSD and USDCHF symbols, you need to enable the line mirroring function for the second One. Second RSI

This EA is created to work on all Time Frames and all Currency Pairs. Different settings possible SL and TP Trailing Stop Martingale The Ea is purely Candle Based. Works best on higher Time Frames as there will be more data collected. It works as well on cent accounts.
I wish everyone who purchases the EA maximum sucess and good trading results
Please trade carefully and responsibly. Thank you and Happy trading everyone

Trend Actual 当前趋势方向的指标。方向由指标线相对于零水平的位置决定,如果指标线在零水平之上 - 趋势方向是向上的并假设买入,如果指标线低于零水平 - 趋势方向是向下和销售假设。当指标线越过零位时,趋势变为相反的趋势。 指标设置说明: period - 指标期 Trend Actual 当前趋势方向的指标。方向由指标线相对于零水平的位置决定,如果指标线在零水平之上 - 趋势方向是向上的并假设买入,如果指标线低于零水平 - 趋势方向是向下和销售假设。当指标线越过零位时,趋势变为相反的趋势。 指标设置说明: period - 指标期 当前趋势方向的指标。方向由指标线相对于零水平的位置决定,如果指标线在零水平之上 - 趋势方向是向上的并假设买入,如果指标线低于零水平 - 趋势方向是向下和销售假设。当指标线越过零位时,趋势变为相反的趋势。 指标设置说明: period - 指标期

I personally love trading robots, but there are many situations where semi-auto trading is superior to automation. The system is very simple and effective.
Trend lines are typically used with price charts, however they can also be used with a range of technical analysis charts such as CCI and RSI.
What is the trend line?
Trend line is a bounding line for the price movement. It is formed when a diagonal line can be drawn between a minimum of three or more price pivot points. A line can be

This is an reversal detection Robot
https://youtu.be/2wCzTFIGNp4 The Robot was designed by myself and works already on live accounts. This Ea is based on high probability reversals in trends. Higher accuracy in higher time frames Can be used with TP and SL settings with trailing stop as MArtingale The robot works on all Currency Pairs and all Time Frames. The higher the Frame so higher the possibility of the trade accuracy. I wish everyone who purchases the EA maximum sucess and good tradin
Mars 14 is a Break indicator is a powerful indicator of Pattern trade for any par and any timeframe. It doesn't requires any additional indicators for the trading setup.The indicator gives clear signals about opening and closing trades.This Indicator is a unique, high quality and affordable trading tool. Can be used in combination with other indicators Perfect For New Traders And Expert Traders Low risk entries. Never repaints signal. Never backpaints signal. Never recalculates signal. For M

Speed Master - трендовый индикатор, сигналы которого отображаются в виде гистограммы, и нескольких видов стрелок на ценовом графике. Показания индикатора основаны на идентичных расчетах индикатора Speed Trend - https://www.mql5.com/ru/market/product/36524#!tab=tab_p_overview , за исключением того, что данный индикатор рассчитывает вместо одного, три указанных периода на текущем таймфрейме, и на их основе отображает сигналы в направлении от старшего периода к меньшему. Speed Master - подходи
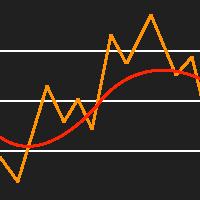
This indicator places a moving average of the specified type over the standard RSI indicator. This is an extremely useful tool for spotting reversal points and RSI divergences. This indicator provides buffers, allowing you to use it in your expert advisor. I like to make the RSI period the same as the moving average period, but it is up to you to set it up however you would like.

NighBird Scalp: It is an algorithm developed for low volatility scenarios, where the market is in a small rank period. The algorithm will look for a small target with an adjustable risk. It works in 15 minute temporalities. (Only one order is executed at the same time by Set) Filters and conditionals are incorporated into the code, so they will not be disclosed to the public for copyright reasons. In robot properties you can see that there are only time and maximum risk parameters per operation,

Martian RSI is an EA which detects RSI divergences and places trades accordingly. The EA is optimized for trading GBPUSD and NDAQ100 on the daily timeframe. The EA is designed for medium to longterm investing. Simply deposit funds into your account, adjust risk settings to fit your personal risk tolerance and then watch your account grow exponentially over time.
- Follows FIFO rules - No Martingale - Optional Grid
Default settings are for HIGH RISK strategy on NDAQ100 daily. Please PM me for s

The Expert Advisor uses two strategies based on indicators: Moving Average, Envelopes, Commodity Channel Index, Average True Range. Trading takes place according to certain trend patterns (patterns of the price market), the adviser searches for a signal pattern and opens an order, then an order for averaging the first order can be opened. If the first order is closed at a loss, then the EA will open the second order with an increased lot. The adviser also uses economic news to achieve more accu

This is a Longterm Investment EA Watch here how to set the bot https://www.youtube.com/watch?v=2wCzTFIGNp4&feature=youtu.be
This Ea is based on 3 Forex Indicators.
You will have more options to run the EA Standard Option TP and SL Martingale Trailing Close at opposite signal Increase Trade Volume Time Filter How you run it depends on you. Works on all Frames and all Pairs. My recommendation Martingale or standard with trailing stop Time Frame 1H or Higher Be aware that different Broker ha

随着AI行业的发展,有很多观点认为人类将被算法取代,
有些人担心工作会被机器人取代。
而有些人则认为机器人能比人做得更好(如果不是完美的话)。
“只有少数人意识到这是人类的创造力和洞察力与AI的失误和不知疲倦的结合
那将是真正的卓越。”-SomeGuy引用。
人们正在寻找合适的EA来长期进行投资,
根据先前的数据,从统计上讲,它有效。但是我们仍然会有疑问。
回测基于先前的数据,因此对于任何程序员而言,更容易将其EA绑定到特定环境下进行工作(对)
例如,他们知道的情况(在2017年上升,在2018年下降)
因此,有理由认为人们不会对自己的EA承担大风险,而只会对它承担小风险。
即使是最佳EA也只是下注。
首先,信任EA的人们应该已经看到了技术分析有效的证据,
然后,他们将尝试使用机器人寻找更简便的方法和更精确的方法。
尽管有挑衅性的标签“坚硬的石头贸易比你更好”。与其他EA不同。
所有EA均应符合可在任何时间任何对中使用的标准,并且它们必须在大多数时间工作。
表示它使用了统计上可以超时工作的通用技术分析。
当然,以前与EA合作的每个人

Euro Stars trades one hour candle price retracements, typical trades are open no longer than 50 minutes. The EA is best suited for the EURUSD, other liquid pairs with low spreads can also be traded but with no guaranty of success as compared with the EURUSD pair. Please trade only on LOW TO ZERO SPREAD ACCOUNTS. Euro Stars has a decent win rate that is based on a hybrid algorithm with multiple close logic. Default setting opens 5 simultaneous trades, you can change number of trades opened in se
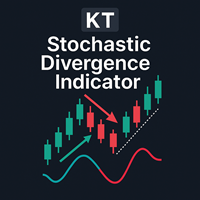
背离是市场中预测价格反转的重要信号之一。KT Stoch Divergence 指标可识别价格与随机指标之间形成的常规和隐藏背离。
KT Stoch Divergence 的局限性
仅将随机背离用作入场信号可能存在较大风险。并非所有背离都预示强烈的反转信号。为了提高准确率,建议结合价格行为和趋势方向使用。
功能特色
标注价格与随机指标之间的常规和隐藏背离。 支持趋势反转与趋势延续的交易策略。 可嵌入至自动交易专家顾问(EA)中使用。 过滤掉不对称背离,减少图表混乱并提升精度。 既可用于入场,也可用于出场。 包含所有 MetaTrader 提供的预警功能。
什么是背离? 通常来说,当价格创出新高时,振荡指标也应创出新高;当价格创出新低时,振荡指标也应创出新低。当价格与振荡指标未同步时,即为出现背离。这表示价格与指标行为相矛盾。背离分为两种类型:
常规背离 常规看涨背离:价格创出新低,但指标创出更高的低点。 常规看跌背离:价格创出新高,但指标创出更低的高点。 隐藏背离 隐藏看涨背离:价格创出更高的低点,指标却创出更低的低点。 隐藏看跌背离:价格创出更低的高点,指标却创出更高的高点

Every morning, the Morning Fenix expert advisor analyzes the selected instrument according to the pre-trading movement pattern and determines the expediency of entering the trade, filtering bad days by a complex algorithm based on price channels and areas of accumulation-distribution of past days trading volumes. Advisor closes 60-70% of transactions by Take Profit order. To improve the results, the author's method of money management is used. The effectiveness of this approach has been proven b

Despite the popularity of inside bar pattern among traders, using it as a standalone entry signal doesn't provide any evidentiary advantage. KT Inside Bar Hunter trades only selected inside bar patterns using some preassessment and ECE price action cycle.
Trading Strategy
On successful detection of the required pattern, EA places a pending order in the direction of the forecasted price expansion phase. Pending orders are canceled if they are not triggered within the next bar. Once triggered, ac

Introduction
This is a volume based heatmap type indicator. The indicator does not repaint . Its gives a collective view of short, intermediate and long term volume buy sell activities(bottom to top of map). This indicator should prove quite beneficial to all those who believe in the power of volumes. As usual for any volume based indicators, a ECN broker is recommended.The indicator can be useful for both binary and other fx trading.
Before wondering how to use it, it is probably worthwhi

Swing Trading Forex is a new indicator that shows the trader impulsive price movements, as well as using the arrow predicts future movement for the short term. Using this indicator, you can trade using the scalping system, where traders try to make a profit for short periods of time. To get good trading results, you need to put the Swing Trading Forex indicator on the chart of any currency pair and add any free channel indicator. We will trade in the direction of the channel according to the sig

The trend triangle is quite complex. It is a hedge between two straight currencies and one cross currency, or between two cross currencies. Traders are often affected by external factors and cannot strictly execute it, resulting in losses. After a large number of data statistical analysis and strict scientific demonstration calculation, the system can achieve stable profits through many years of real transaction verification. Traders are expected to strictly follow the trading rules. Viewing acc

Main: Not martingale, not a grid; Use on EURUSD; Use on M5.
Signals: There is a good rational algorithm. Work of two indicators: Moving Avarage and Parabolic SAR (you can set a separate Timeframe for each indicator)
Stop Loss/Take Profit: There is a good money management system (there are several type for trailing stop loss); There is virtual levels of Stop Loss / Take Profit; There is smart lot (percent by risk) or fix lot
Important: EA can work on closed candles, and on current candles; Qu

This EA has been developed for GBPJPY M30 timeframe. Everything is tested and ready for immediate use on real account. This Expert Advisor is based on MACD indicator. It enters if DIVERGENCE occurs after some time of consolidation . It uses STOP pending orders with ATR STOP LOSS and FIXED TAKE PROFIT . Very SIMPLE STRATEGY with only FEW PARAMETERS. At 9:00 pm we are closing trading every Friday to prevent from weekly gaps. !!!Adjust these times to your broker time. Preset values are

RSI 交叉警报 是一个功能强大的通知系统,专为在其交易策略中使用 相对强度指数 (RSI) 的交易者而设计。该指标侧重于识别 RSI 交叉,当快速 RSI 线穿过慢速 RSI 线上方或下方时发生。通过结合这些交叉点,该指标可以有效地过滤掉错误信号,让交易者做出更准确的交易决策。 RSI 交叉警报提供了几个增强其功能和可用性的关键功能。它适用于任何时间框架和交易品种,为交易者提供灵活的交易方式。该指标还拥有用户友好的参数,允许交易者根据自己的喜好和交易策略轻松定制其设置。此外,该指标可以在图表上绘制之前的信号,使交易者能够分析历史交叉模式。 为确保交易者不错过重要的交易机会,RSI Crossover Alert 包含一个快速通知系统。该系统提供及时的弹出消息提醒,让交易者了解潜在的 RSI 交叉和信号机会。通过及时收到这些警报,交易者可以立即采取行动并利用有利的市场条件。 该指标的参数设置包括调整快速RSI周期、慢速RSI周期、RSI应用价格、起始蜡烛指数、历史计算周期、箭头距离、买入箭头字符、卖出箭头字符、买入颜色、卖出颜色和警报重置周期的选项.交易者可以微调这些参数以符合他们个

Fully automated Ichimoku EA. Perfect EA for Longterm Investments not short term profits. These days with zero interest or negative interest at Banks there is a better way to invest. This EA generates more then leaving Money sitting on the Banks. works on all Time Frames but i would recommend the Higher Frames. On the lower Frames there are too many small trades but its up to yourself. I would recommend to test it on a Cent Account if you are not sure. You can click on the link below for a Cent

Advanced MACD Lite is a safe and fully automated EA. This EA uses MACD indicator with double confirmation set and filtering by range of latest price movements. Advanced MACD Lite is EA based on Advanced MACD dedicated to less experienced users in forex trading. Only settings required by user is selection of Trading mode, size of lot to trade and unique magic number for each chart. Every order has stop-loss and the EA has implemented advanced filtering functions together with spread and slippag

Main: Not martingale, not a grid; Working on all symbols; Use on EURUSD Use on M5
Signals: There is a good rational algorithm. Work of two indicators: Bollinger Bands and Moving Average (you can set a separate Timeframe for each indicator)
Stop Loss/Take Profit: There is a good money management system (there are several type for trailing stop loss); There is virtual levels of Stop Loss / Take Profit; There is smart lot (percent by risk) or fix lot
Important: EA can work on closed candles, an

Major Features Works on multiple pairs Multiple Entry Control Features (432 entry types) BUY/SELL trade entries or STOP/LIMIT trade entries Grid Trading Strategy with many control features feature, stops Grid Turpo trading after basket close Emergency Close All Feature Holiday Shut Down Feature Order Management/Checking Conditions Email Management – Grid Turpo talks back to you Grid Array Generation based on user input Take Profit Trader Stealth TP trader – no TP sent to broker Stealth SL featur

Mars 13 is a Break indicator is a powerful indicator of Pattern trade for any par and any timeframe. It doesn't requires any additional indicators for the trading setup.The indicator gives clear signals about opening and closing trades.This Indicator is a unique, high quality and affordable trading tool. Can be used in combination with other indicators Perfect For New Traders And Expert Traders Low risk entries. Never repaints signal. Never backpaints signal. Never recalculates signal. For

This indicator is a professional indicator for Forex trading. Shows points for entering the market, points of potential market reversal. Uses one parameter for settings. Ready trading system. The indicator combines several progressive algorithms. Combined systems for analyzing historical data are projected onto lines in the form of straight lines connecting extremes. That is the pivot point of the market. These extremes or pivot points of the market can be used as line levels! Which is very conv

Это прототип известнейшего торгового робота DaVinci заработавшего миллионы долларов его пользователям. Это наш самый серьёзный проект экстра-класса ориентированный на максимальный успех и дальнейшее улучшение. Успейте купить торгового робота от 30 $. В дальнейшем будет однозначное увеличение стоимости. Мы вам предлагаем: Стоимость эксперта от 30 $. Онлайн поддержку и последующее улучшение проекта. Стабильнейший алгоритм исключающий критические ошибки.
Технические аспекты робота.
Раскрывать всё

As the name says, Trendless Scalper doesn't care for what trend is going on in the currency pair. It opens one trade as selected by user and then keep on adding trades according to direction itself. It don't have very complicated parameters. Simply apply on any chart and it works. It is recommended that the spread of the account should be low, but it dont have any restriction for accounts with high Spread too. It can trade any chart and any timeframe. This EA works for those accounts which can h

This Expert is for starters who want to use Moving Averages and to use stoploss with it. This algo which can trade either using SMA or EMA and uses PSAR as the trailing stop (if selected) and uses fixed Take Profit. It is recommended to use this EA above M15 chart and it works on good trending currencies. Kindly backtest it on different charts to learn more about it.
Parameters are explained below: LotSize - This will set the lot size of the trades mode - EMA/SMA Periods_Small - 1st Moving Av

Smart Awesome Volume 技术指标旨在通过组合蜡烛图交易量数据并用平均值对其进行过滤以提供准确信号来衡量市场动能。它着重于“量确定价”的概念,使交易者能够轻松识别市场势头以及每根蜡烛内买卖双方之间的战斗。凭借其快速警报系统,交易者可以掌握有价值的交易事件,绝不会错过重要的市场动向。 使用实际交易量信息改进策略的一种方法是使用买家和卖家的交易量来确认突破。这有助于交易者验证潜在的突破机会并做出更明智的交易决策。另一个策略增强是使用交易量信息来确认整体趋势。通过分析交易量数据,交易者可以获得对当前趋势方向的额外信心。最后,交易量信息可用于识别市场的潜在逆转,为交易者提供潜在趋势变化的早期信号。 飞碟策略由 Smart Awesome Volume 指标支持。对于买入条目,指标会寻找特定条件,例如 Awesome Oscillator 位于零线上方、连续的红色直方图,第二个比第一个短,以及紧随其后的绿色直方图。然后,交易者可以在第四根烛台上建立买入头寸。同样,对于卖出条目,指标寻找零线下方的真棒震荡指标、连续的绿色直方图,第二个比第一个短,然后是红色直方图。交易者可以在第四根

The universal indicator Diamond Grail which received such a name is not so simple!
The indicator has been tested for over a year by our experts!
One of the best arrow indicators that is perfect for binary options and forex trading,
If you trade on binary options, the best ragtime for it is from 3 minutes to a maximum of 5 minutes
An arrow appears on the previous candle.
If you trade forex, then the opening time from candle to candle
Forex result From 40 To 1324 pips!
Profitability of Diam

Info: marcobarbosabots
CCI Warrior
Note: An detalhed image of backtest is on here https://drive.google.com/open?id=1Se8Qcgzqmd8YrG7_O3LfXszcVfvlBrCv
CCI is short for the Commodity Channel Index indicator. CCI Warrior is an Expert Advisor that generates signals through Commodity Channel Index (CCI) levels. A value above the positive level generates a SELL signal and below the negative level generates a BUY signal. When a signal is generated an MA Filter checks it. If the signal is in the s
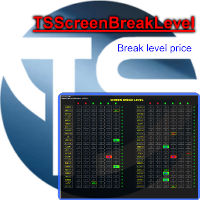
Indicator, which draws supports and resistances that have been broken. Intelligent algorithm for scalper and intraday traders. Multi time frame and multi currency panel. The benefits you get Never redesigns, does not retreat, never recalculates. Works on forex and CFD, timeframe from M5 to Daily. Integrated pop-up, push notification and sound alerts. Easy to use. Parameters input int Number_Instrument = 10; Number of crosses present in your panel SENSIBILITY = 1; indicates the imp

This EA is very easy to use and can apply for many currency pairs. Transactions are automatically adjusted using the AccountFreeMargin and ATR metrics and RiskPercentage.
EA는 Martingale, Grid 또는 Scaling을 사용하지 않습니다.
* Trade settings RiskPercentage - Money Management Risk Percent
TakeProfit- Fixed Take Benefit value (point). If 0 then profit will not be set.
StopLoss- Fixed stop loss value (point). If 0 then no stop loss is set.
EA discovers small price deviations due to sudden changes in tra
Price Point Signal is an indicator that generates trade arrows. It generates trade arrows with its own algorithm. These arrows give buying and selling signals. The indicator certainly does not repaint. The point at which the signal is given does not change. You can use it in all graphics. You can use it in all pairs. This indicator shows the input and output signals as arrows and alert. When sl_tp is set to true, the indicator will send you the close long and close short warnings. It tells you t

This EA offers following features to automatically increase the volume of the lot received from your signal: you can manually set the multiplier using the "multiplier" parameter; Risk control is implemented. You can set the maximum lots-to-account balance ratio using the "ratio" parameter; The "stop loss" an "take profil" levels are synchronized from the corresponding signal tickets; One-to-one replication. Each signal ticket corresponds to a copied ticket; For MT5 version: https://www.mql5.c

Prometheus is created to give a constant profit from the moment of launch and bring profitable transactions every day. It is automatic trading advisor with a built-in double strategy module, which are used depending on market conditions. The EA has fully customizable parameters for working in different market conditions. As inputs, indicators Rsi and Long Parabolic is used. When the profit from open basket of orders is greater than used parameter, they are automatically closed with a profit. If
MetaTrader市场是独有的自动交易和技术指标商店。
阅读MQL5.community用户备忘更多地了解我们提供给交易者的独特的服务:复制交易信号,自由职业者开发的自定义应用程序,通过支付系统完成的自动付款和MQL5云网络。
您错过了交易机会:
- 免费交易应用程序
- 8,000+信号可供复制
- 探索金融市场的经济新闻
注册
登录