适用于MetaTrader 4的EA交易和指标 - 272

The Overnight EA is a fully automated trading Expert Advisor, which uses technical analysis to take decisions based on various signals. It is originally intended to be used in the late hours of the night, where volatility is low, where we could scalp a few pips and avoid large drawdowns, however it could be used during any time of the day. Overnight EA is designed to have a very high winning ratio, and low drawdowns. It averages between 5-7% monthly with a fixed lot size. Using a VPS to run the

KT Bollinger Bands Trader 是一款 100% 自动化的智能交易顾问(EA),基于布林带在低波动时期的均值回归交易策略构建。价格经常在布林带的上轨或下轨附近产生反应,但并非每次都会发生反转。然而,在低波动期间,价格反转的可能性更高。
入场规则 当价格正确下穿布林带下轨时,开启买入交易。 当价格正确上破布林带上轨时,开启卖出交易。 出场规则 在低波动阶段结束时自动平仓。 也可在达到止损或止盈时平仓。 本 EA 在经典布林带策略基础上进行了诸多改进,允许用户通过内置的趋势过滤器、波动率过滤器、Vortex、MMI 和星期过滤器等工具,对策略进行细致调节。
输入参数
----- 策略设置 ----- 布林带周期、带移位、带偏差 开始时间(Start Hour) 结束时间(End Hour) GMT 时区偏移(GMT offset)
----- 交易设置 ----- 手数类型:固定手数 | 自动手数 每单风险百分比(Risk Per Trade)
----- 出场设置 ----- 止损方式:无止损 | 基于波动率 | 固定点数 止盈方式:无止盈 | 基于波动率 |

It can be used as an independent trading system. It is based on the idea that some currency pairs follow one another. The indicator allows you to simultaneously display several other charts on the chart of one currency pair, which allows you to anticipate some movements and fairly accurately determine the beginning of trends. The principle of trading according to indicator signals is also simple: you need to sell a currency pair whose chart is higher, and buy the lower one.

Close ALL Mobile is a trading tool that allow MT4 Mobile App users to close floating orders via mobile using pending order in tricking closing functions. Parameter Magic Number for Maual Trades (Defult = 0)
Magic Number for EA1 Magic Number for EA2 Magic Number for EA3 Slipage for closing order Close All BUY Positions: Type of Pending order trick Close all BUY positions function Close All SELL Positions: Type of Pending order trick Close all SELL positions function Close ALL Positions: Type of

This EA is a hedging EA. So, please make sure your broker supporting this rule. Works well on ANY PAIRS. WARNING! MARTIANGLE tactic used. Martiangle can boost your money very fast, BUT Martiangle can also be a dangerous strategy since it is increasing size by the time. That's why we recommend: - Please use as small as possible lot at start; recommended: 0.01 lot for $1000. - RangeOP : set this value with the 1/4 of average daily candle range - MaxOP : this value handle maximum running positions

This indicator will provide you with everything you need in order to overcome losses due to human emotions. The indicator determines the moments of a trend reversal and the direction of its movements. This development is equipped with the most modern, adaptable trading algorithms. The main secret of short-term trading is to have information on when to enter a deal. The indicator works great on all timeframes and informs the trader about the most successful moments of buying or selling a currency

Automatic trading Advisor .Refers to the breakdown scalping robots .Traded pairs EURUSD and GBPUSD .The EA places pending orders at price levels where strong recoilless movements are likely to occur.All trades have a fixed stop loss and take profit .Orders are closed either by take profit or by trailing stop.For successful trading, a broker with the narrowest possible spread is recommended . To use the VPS server is a must! Testing was performed on tick data with modeling quality 99.9 %, using

Atila Expert Advisor passes the test from 1999 to the current day! The EA works during the night flat on the eurusd currency pair M5 timeframe!
It opens a maximum of 2 positions per day (the second position doubles the lot), transactions are usually less than a day on the market! The robot controls the volume of trading positions, slippage, spread expansion, trading time, maintains and protects open orders, works with a deposit of $ 100 or more!
Trading takes place mainly during periods of

The indicator monitors the market trend with very high reliability. Sharp price fluctuations, as well as noise around averaged prices, are ignored. All intersection points will be ideal points at which the direction of the trend changes. Signal points, places where color changes, can be used as points of potential market reversal. This development can be used both for long-term trading, and for piping on small periods. The indiuctor algorithm implements a kind of technical analysis based on the

Heraclitus is a trend-following intraday trading robot engineered to find promising reversal points to enter the market. This product works with EURUSD symbol on M1 timeframe and MUST NOT be used in combination with others EA on the same account to avoid interferences in automatic trading decisions. KEY FEATURES Fully-automated Autolots Trailing stop Flexibile trade management Works also with minimum lot size Risk can be controlled by input parameters
TRADE MANAGEMENT POLICY PARAM
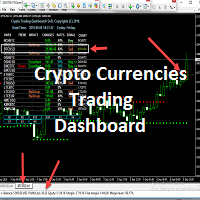
Micro Crypto Trading Dashboard
This is a custom indicator created to give CRYPTO TRADERS a full view of what is going on in the Crypto market. It uses a real time data to access the market and display every bit of information needed to make successful trading. This is a Micro size of the Compact Crypto Market Trading Dashboard Indicator created mainly for trading Crypto Currencies Markets for a living.
They practically perform the same operation but MicroMini FFMV Dashboard has a few features.
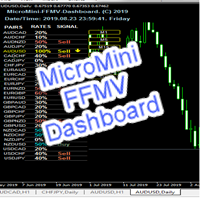
MicroMini FFMV Dashboard This is a custom indicator created to give Traders a full view of what is going on in the market. It uses a real time data to access the market and display every bit of information needed to make successful trading. THIS IS A MicroMini size of the FULL FOREX MARKET VIEW DASHBOARD INDICATOR. This is for those who don't like the Indicator to cover all the charts and for those who don't like BOGU S things. They practically perform the same operation but MicroMini FFMV Dashb

-40% OFF
Telegram Group: Find the link in my profile or contact me
Welcome.
Virtual Killer Trade is an exceptional EA which : Guides you WHEN to open the FIRST trade. After that an intelligent system starts to manage that trade and you do not have to worry when to close it neither when you must open a second or third etc one !!!
Attach the EA, wait for the signal,open the trade and then go to sleep !!!
FOR more experienced traders,you do not have to wait for a signal.Open the first tra
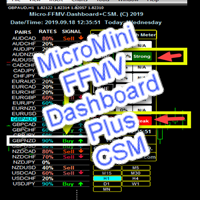
MicroMini FFMV Dashboard+CSM This is a custom indicator created to give Traders a full view of what is going on in the market. It uses a real time data to access the market and display every bit of information needed to make successful trading. To add value to the trading operation, Currency Strength Meter is added to it in order to consolidate the effective work of this indicator.
THIS IS A MicroMini size of the FULL FOREX MARKET VIEW DASHBOARD INDICATOR with CSM added. This is for those who d

Introducing the trend indicator! Ready trading system. The principle of the indicator is to automatically determine the current state of the market when placed on a chart. The indicator analyzes market dynamics for pivot points. Shows the favorable moments of entering the market with stripes. Can be used as a channel indicator or level indicator! This indicator allows you to analyze historical data, and on their basis display instructions to the trader on further actions. To find out how to dete
DPOMASimple (DetrendPrice Oscillator) is an indicator that removes the price trend, in order to observe the cyclical movements of the price without the noise of the trend, the DPOMASimple indicator can be used to determine support and resistance levels in the peaks and valleys or as trading signal whe cross 0 level.
DPOMASimple > 0 -> Buy. DPOMASimple < 0 -> Sell.
Markets in range: Maximum and minimum will be the same as in the past. Set the overbought and oversold levels based on

NewsReady is a semi-automated Expert Advisor that uses a smart straddle methods It needs to be set in charts 2 to 10 minutes before Economic Data release with a red-flag impact on currencies related to the news. Then it run pending orders in specified number of minutes indicated in the time-period parameter. After the specified time, it will stop trading and will remove all pending orders. Important
You can not backtest this tool because it is semi-automated and can only be set and run a few min

Advisor FU PULSAR - is a scalper with high accuracy of market entries. The EA is able to work with medium spreads (for testing we used a spread of 20 points on GBPUSD), it is not critical to slippage, and it is also not demanding on trading conditions. It uses Stop Loss as protection for orders, and uses virtual trailing stop as a percentage of the balance as order support. It does not open orders often but as accurately as possible.
FU PULSAR does not use indicators. The algorithm contains a

Общие сведения Classic - это сеточный эксперт следующий строгим правилам торговли. Главное отличие от сеточных экспертов имеет фиксированный Stop_Loss каждого ордера! Использовать на периоде M1. Для начала торговли достаточно небольшого депозита. Мультивалютность. Невосприимчивость к большой задержке и величине спреда. Работает только со своими ордерами.
Рекомендации Рекомендую использовать мультивалютную торговлю. Для этого запустите советника на разных валютных парах!!! Если ваш копмьютор сла

This Expert Advisor is designed to enter orders according to trend parameters of other TimeFrames, MACD and Moving Averages as well as the characteristics of each currency pair to assist in the decision to invest. It has the possibility to enter the market in the opposite direction of movement (reverse). Position is plotted by a stoploss and static takeprofit, based on price..
Operation : You work with regular variable spread brokers and generally work best on the currency pairs below, so it i
This EA has been developed for EURUSD M15 TF. It also works very well on GBPUSD M15. So you will get 2 strategies for lower price, that means better equity curve, higher profits, lower drawdowns. Everything is tested and ready for immediate use on real account. This Expert Advisor is based on BREAKOUT of the LOWEST CHANNEL after some time of consolidation. It uses STOP pending orders with FIXED Stop Loss and FIXED Take Profit . To catch as much profit as possible there is also a TRA

A trend indicator, the main direction of which is to display the possible direction of price movement. The price reversal occurs with the same patterns on the indicators. The indicator shows the possible direction of price movement. Signals are generated on the previous bar. Red Coogie - the signal is considered unconfirmed. The indicator works best on timeframes H1, H4 and D1.
This is one of the few indicators that can signal strength and direction, which makes it a very valuable tool for tra

Fully automated expert Advisor belongs to the category of night scalpers traded EURCHF,USDCHF,and GBPCAD with the M15 ,in the principle of operation of the robot laid down the simplest strategy based on price breakout from Bollinger Bands to definitely watch specified,the remaining parameters of the trading algorithm is classified. To get true results ,it is desirable to test the EA on tick data. *Does not use dangerous trading strategies such as martingale and averaging *Minimal deposit 100$ *

Monitoring of real trading on this system https://www.mql5.com/ru/signals/632726 Guru Pro Signal does not repaint! Guru Pro Signal is an original indicator, developed for the work of employees of one of the large funds! It is the best tool that can be added to your chart!
Guru Pro Signal signals about price reversal with the highest degree of accuracy, the best tool for both scalping and position trading. The entry signal is shown by the BUY and SELL arrows. It is possible to receive notif

Royal Ace Signal 3 MA The Royal Ace Signal 3 MA indicator tracks the market trend with combine 3 MA. Amazingly easy to trade The indicator needs no optimization at all It implements a multi-timeframe dashboard The indicator is non-repainting
Anatomy of the Indicator The Royal Ace Signal 3 MA indicator displays a colored arrow. If the arrow is gold you should be looking for long trades, and if the arrow is red, you should be looking for short trades. Use this indicator in H1, H4 timeframe o

Just $30 for six months!!!. This will draw Supply & Demand zones just by clicking on a candle. It can also draw the mean threshold of the zone. https://youtu.be/XeO_x7cpx8g
As a drawing tool, it is not active all the time after adding it to the chart.
Activate by pressing 's' twice on the keyboard within a second. If activated but then decided not to draw, deactivate by pressing 's' once. Box color depends if candle is above or below current price.
Settings/Inputs: Number of candles the box

Just $30 for six months!!!. This will draw Order Blocks just by clicking on a candle with different colors for different timeframes. It will use the body or the wicks. It can also draw the mean threshold of the candle open/close or high/low.
As a drawing tool, it is not active all the time after adding it to the chart.
Activate by pressing 'b' twice on the keyboard within a second. If activated but then decided not to draw, deactivate by pressing 'b' once. Box color depends if candle is abov

Just $30 for six months!!!. This will draw Order Blocks just by clicking on a candle. It will use the body or the wicks. It can also draw the mean threshold of the candle open/close or high/low. As a drawing tool, it is not active all the time after adding it to the chart. Activate by pressing 'b' twice on the keyboard within a second. If activated but then decided not to draw, deactivate by pressing 'b' once. Box color depends if candle is above or below current price. Settings/Inputs: Number

Tortoise Master Professional 该专家设计用于根据其他时间框架的趋势参数输入订单,使用参数MACD,移动平均线和每个货币对的特征来协助投资决策有可能以相反的方向进入市场。 运动(反向)。 根据价格,止损和静态止盈图绘制头寸。
手术 : Tortoise适用于常规可变差价经纪商,通常对下面的货币对最有效。 建议您首先运行模拟账户,以查看哪些设置最适合您的经纪商,因为每个经纪商使用不同的流动性提供商和软件服务。
特征 : 预定以下货币: 期: M30 e H1 货币对: USD/CHF, GBP/USD, EUR/USD, USD/JPY, USD/CAD, AUD/USD, EUR/GBP, EUR/JPY, GBP/CHF, CAD/JPY, GBP/JPY, AUD/NZD, AUD/CAD . 采取TakeProfit和StopLoss功能。 适用于4到5位经纪人。 传播过滤器。 降低保护。 EA信息仪表板。 4种资金管理类型(固定批次,计算,比例,平衡)。 Ajust可调

Growth 651% dd only 21.62% Top 4 best EA's on mql5 for 3 years! This ea trades every day and non-stop, if you purchased i will provide settings and full support.
Because mt4 only has max 1 pair to backtest and this ea trades with correlation pairs! Therefore, a separate real account is attached to the product, where you can constantly monitor all trading results

This expert works with several indicators Rasai and Mollinger Band and also depends on certain models of candles and that the success rate of the deal more than 90% and also contains strict capital management works based on the correct rate of capital management is correct in addition to the success rate is good Try it yourself The result is communicating with me.

Super grid nineth (ninth) generation is another grid type EA on this huge forex system population, this EA not using any indicator to avoid any fake signaling to open or closing position orders. This EA will open pending order stop and limit in the first time EA run, then maintain all opened order with unique way to balancing account free margin and make equity growth. This EA have unique system not like anyother grid EA, with correct setup and run on max 3 pairs in one account, this EA capable
Mars 11 is a Trend indicator is a powerful indicator of FOLLOW DIRECCTION for any par and any timeframe. It doesn't requires any additional indicators for the trading setup.The indicator gives clear signals about opening and closing trades.This Indicator is a unique, high quality and affordable trading tool. Can be used in combination with other indicators Perfect For New Traders And Expert Traders Low risk entries. Never repaints signal. Never backpaints signal. Never recalculates signal.


Greetings to all friends! I propose to get acquainted with the high-tech and multilateral advisor Money Nest. The Expert Advisor is developed on the basis of the "Nest" indicator and contains three robots at once. Advisor management allows you to work with each robot separately and together, which allows you to configure the work as safely as possible using hedged positions with the maximum profit as much as the adviser allows. For maximum efficiency, it is necessary to optimize the instrument y

Jabuti Super Trend Explorer: 該專家旨在根據較大的TimeFrames,MACD和移動平均線的趨勢參數輸入訂單,並且能夠以相反的運動方向(反向)進入市場,還有貨幣對及其特徵以協助決策 我正在投資 該頭寸由止損和基於價格的靜態止盈圖繪製。
操作: Jabuti Super Trend Explorer適用於常規可變差價經紀商,通常對下面的貨幣對更有效。 首先,建議在模擬賬戶中運行Jabuti Super Trend Explorer,以查看哪種配置最適合您的經紀商,因為每個經紀商使用不同的流動性提供商和軟件服務。
產品特點: 預定以下貨幣: M30: USD/CHF, GBP/USD, EUR/USD, USD/JPY, USD/CAD, AUD/USD H1: USD/CHF, GBP/USD, EUR/USD, USD/JPY, USD/CAD, AUD/USD, EUR/GBP, EUR/JPY, GBP/CHF, CAD/JPY, GBP/JPY, AUD/NZD, AUD/CAD TakeProfit和StopLoss功能。 適用於

Testosteron uses independent strategies, including trading on short-term and long-term trends! by default, trades on the EURJPY currency pair M5 timeframe!
The EA works at night and deals are not opened every day! How often deals are opened can be viewed in the strategy tester!
Test the adviser since 2010 to understand how it works on history.
Please pay attention to my other products: https://www.mql5.com/en/users/malishko89/seller#products
Please note that the adviser has summ

The OMEGA PIP is a unique revolutionary semi -automated software which change the game entirely to your favor.This product developed from years of research in the FX Market is embedded with complex algorithms which filters off false signals, generating only accurate valid signals which is immediately printed on your chart , thus it guarantees profit anytime its installed on your computer. Due to this significant feat, the daunting and the strenuous effort a traders goes through during

The Ceres Trend Indicator displays polynomial regression on history and in the current time.
In the indicator settings: module - degree of regression (1 - linear, 2 - parabolic, 3 - cubic, etc.) koeff is the standard deviation channel multiplier.
The main direction of application of this indicator is the ability to determine the likelihood of further growth. If there is an intersection of the linear regression line from below, then this indicates a trend inhibition and a possible reversal. Si
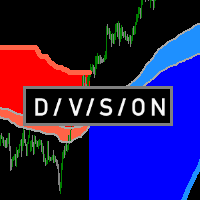
Определения текущей тенденции одна из самых важных задач трейдера не зависимо от стиля торговли. Индикатор Division поможет с достаточно высокой вероятностью это сделать. Division - индикатор распознавания тенденции, использующий в качестве источника данных подобие скользящих средних, в расчете которых используются объемы. От этих средних строятся границы, которые служат сигнализатором для смены текущей тенденции. Показания индикатора не изменяются не при каких условиях. При желании можно вкл

Tasmanian Devil is a fully automated Expert Advisor with no use of martingale and gridsystems. It Uses significant price levels to make the order entries.
All trading positions contain a stop loss, and also include take profit. Which results in a very low draw down. Advantages
Advanced algorithm for tracking positions. Each item contains a protective stop loss. Work with fixed and risk based lots on MM. Does not use indicators, grid, martingale, arbitration. More exit strategies Protecti

Комплексный индикатор который работает на основе 4-х стандартных индикаторов МТ4: Moving Average, Stochastic, Bollinger Bands, RSI (в дальнейшем список индикаторов будет расширятся). Показания индикаторов берутся из 7-и тайм фреймов от М1 до D1. Строка Average показывает средние значения индикаторов в разрезе тайм фреймов. Сигналы индикаторов: Moving Average: быстрая скользящая выше медленной скользящей - покупка; быстрая скользящая ниже медленной скользящей - продажа; данные берутся из последне

DO NOT STOP OCCUPY THE POWER OF THE UNION OF VARIOUS TIME FRAMES. From now on you can see the RSI that you use for your trading analysis in a single window without having to be opening others to form very graphic and easy. Color settings Possibility of deactivating the timeframes you want. Up or down arrows in relation to the previous sail. We also have Multiframe MACD and Momentum version available. Visit My signals https://www.mql5.com/es/signals/620506

Ссылка на мониторинг: https://www.mql5.com/ru/signals/631995 Для начала торговли достаточно небольшого депозита. Идеален для быстрого разгона депозита!!! Подходит для мультивалютной торговли. Невосприимчивость к большой задержке и величине спреда.
Принцип работы После запуска советника на графике советник запоминает уровень открытия первого ордера. Выше уровня открытия первого ордера советник выставляет сеть ордеров на Sell . Ниже уровня открытия первого ордера советник выставляет сеть ордер

顾问数据说明MACD 打开MACD指标波动的订单。关闭MACD指标波动的订单。
默认值。
extern double TakeProfit = 500; extern double StopLoss = 500; extern double externalLots = 0.01; extern double TrailingStop = 10000; extern bool isAutoMoneyManagmentEnabled = false; extern int moneyManagement4And8Or12And24_4_Or_12 = 12; extern double TrailingFiboLevel = 0.236; extern double maxOrders = 30; extern double riskOnOneOrderPercent = 2; extern bool limitSinglePositionOnOpenOnHalfWaves = false; // extern bool OpenOnHalfWaveUp_M1 = fals

此指标可让您确定价格达到一个或另一个级别的可能性。它的算法非常简单,并且基于对特定货币对的价格水平的统计数据的使用。由于收集的历史数据,可以确定价格在当前柱形期间的变化程度。 尽管简单,但该指标可以为交易提供宝贵的帮助。因此,在其帮助下,可以确定交易头寸的TakeProfit和StopLoss水平。它可以帮助确定挂单的价格和确定TrailingStop的价格水平。 此外,该指标可以纳入现有战略。例如,您使用某种日内策略。然后,通过在D1时间框架上设置此指标,您可以在克服已经不希望开启新交易头寸之后获得水平。 该指标的主要缺点是它完全依赖于历史数据,并且不会以任何方式对某些当前的市场变化作出反应。 通过选择输入参数-L1 ... L4来执行该指标的设置 - 每个输入参数确定从每个柱的开盘价达到价格价格的概率。每个参数的值必须在99 ... 0之内,并且以下每个参数必须严格小于前一个参数。 尼古拉·尼古拉耶维奇(Nikolai Nikolaevich)是创造这个指标的意识形态灵感,如果你喜欢这个指标,那就写下几句话,我会告诉他。

The most handy indicator for searching classical and hidden divergences either between price chart and an oscillator-type indicator or between two oscillator-type indicators.
Just drop the indicator on the chart at which 1 or 2 oscillators are executed (see the video below).
The indicator doesn't require setting-up. You have just to choose the operation mode: to search divergences between price chart and an oscillator or between two oscillators..
Switch between classical and hidden divergence

Script to reduce the exposure of your operations on the chart. Convenient and quick to use. Just drag the script to a point in your template, and in the input values you will be able to modify several variables to reduce the exposures. We would appreciate your feedback, so we can improve ourselves. Good trading. Parameters: FilterTrade = All; All positions or only the buy or only the sells. Only_Profit = True; Only those in profit if true, in false it applies to all positions. Reduce_Perc = 50
Gladiator Signal indicator for binary options can be used in the forex market...
a signal appears when you open a new candle, we need to wait for it to close.. and at the time of opening a new one if the signal is to open a deal for one candle of the current timeframe works great on all time frames... in the settings you can enable turn off the alert and sound vision...

Ни для кого не секрет, что для того чтобы, заработать на финансовых рынках необходимо движение цены инструмента. И чем движение сильнее тем больше возможностей предоставляется для торговли трейдеру. Для поиска сильных движений цены и был разработан PulseScanner. Панель предназначена для быстрого визуального нахождения и отображения сильных движений цены по всем периодам и на любых выбранных валютных парах одновременно. Индикатор имеет несколько режимов поиска и визуального отображения сигналов.
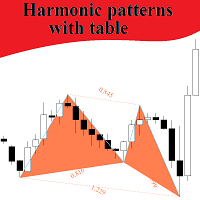
This indicator searches harmonic patterns on different TFs, and can track patterns in real time on all TFs for seted symbols. High and Low points for patterns defined by Bill Williams method, not by Zigzag or Fractals, it's more clear signals. Important input parameters: Where patterns search : "Current symbol" - searches patterns on the current symbol; "Seted symbols" - indicator creates table with seted symbols. Allowable percent of deviation : percent of deviation from perfect pattern Sym

Scalping Modulator is a scalping trading system. The indicator consists of several analytical modules. It automatically analyzes the market and shows the trader all the necessary information for trading. Scalping Modulator draws two trend lines on the chart. One line shows the long-term direction of the price, the second line shows the medium-term direction of the price. The indicator also draws red and blue dots on the chart. They indicate a likely change in price movement. In order to open a

The expert uses independent strategies, including trading on short-term and long-term trends! By default, he trades on the GBPJPY m5 currency pair! Transactions are accompanied by invisible stop loss for the broker.
Please pay attention to my other products: https://www.mql5.com/en/users/malishko89/seller#products
Please note that the adviser has summergmtshift and wintergmtshift in its settings, so summer and winter gmt may differ! It all depends on your broker! So that testing i
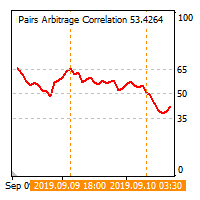
The cross-correlation indicator calculates the relationship between the specified pairs for the previous period. Automatically selects the instruments with the highest and the lowest correlation, and then simulates trading on the selected pairs on the same test period. Then indicator displays the pairs that have shown the best trading results. Visualizes the PAC (Pairs Arbitrage Correlation) criterion for the pairs selected by the trader. The signal to open trades is set by the PAC levels. When
This EA has been developed for DAX (GER30) M30 timeframe, everything is tested and ready for immediate use on real account. This Expert Advisor is based on BREAKOUT of the TRENDLINE after some time of consolidation. It uses STOP pending orders with FIXED Stop Loss and FIXED Take Profit . To catch more profit there is also a TRAILING PROFIT function provided. At 9:00 pm we are closing trading every Friday to prevent from weekly gaps. !!!Adjust these times to your broker time. Preset valu
Ilan16Dynamic The robot uses Martingale strategy. It starts working from a set point and withdraws at the other set point. Once the initial order has been opened, each of the following ones is opened (Additional orders) in a set amount of pips. The robot uses an average price for that. The robot is capable of creating break-even orders. In this case it changes the Magic number and starts a new order series. Input parameters Wk - new order series allowed. LONG TRADE - Long Trade allowed. SHORT

Script to move the stoploss of your positions all on one level or just a stoploss of one of them. Convenient and quick to use. Just drag the script to a point in your template, at the price level you want, and the utility will ask you if you want to move all the stoplosses to that level, or move only one stoploss of a position. Very useful when the positions are very near or the stoplosses are too near. We would appreciate your feedback, so we can improve ourselves. Good trading.
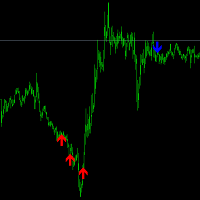
This index doesn't disappear, it doesn't get rewritten, the way it's calculated is to look for a trend shift, when the arrow comes up, there's a high probability that the trend will change. It is recommended to use a larger cycle, but you can also use the 5 minute cycle, the larger the cycle, the higher the winning rate. Indicators in the form of arrows, blue down arrow short, red up arrow do, in a large trend may appear in a continuous arrow, every arrow appears, is an opportunity to add positi

LRY SL Robot 是一个多货币套息机器人,根据涨跌幅进行交易。 EA运行环境 EA可以运行在任何货币、任意时间上,初始资金建议在300美金以上。 Parameters Lot - 开仓手数 Open Percentage - 开仓百分比 Close Percentage - 关闭百分比 Compound Interest - 复利金额,余额增大多少开仓手数加大 Move Stop Loss - 移动止损点数 Add Points - 加仓点数 Liquidated Amount - 有加仓的情况盈利多少进行平仓 Liquidated Loss - 亏损金额 Currency Group - 交易货币组(不填代表所有货币组) Exclusion Currency Group - 不进行交易的货币组 Magic - EA编号

Layout modified version for high-resolution displays!
The different server times for each broker can be a heavy load when trading in short period.
This indicator displays the minimum trade information required to win at a glance.
The sub window displays the local time, and the main chart displays not only the local time,
-Symbol
-Period
-BarEndTime
-Spred
-TokyoTime
-LondonTime
-NewYorkTime
-ServerTime
and so on...
The information display on the main chart can be selected from fo

Ranger Pro is a fully automated expert adviser that detects and takes advantage of ranging price action and make precise entries based on several indicators including RSI and Moving Averages while also utilizing price action to filter out false signals. Ranger Pro can either be set to avoid strong trends, trade with the trend, or both. User settings can range from conservative to moderate to aggressive with a minimum account balance of $400. Set files are available in Comments. Ranger Pro is cur

TickChart Indicator plots tick line on the main window of MetaTrader. ( Free version is "TickChart Indicator Lite" )
The tick-line shows the most detailed, fastest and real-time activities of the market, which are usually hidden in bars or candles longer than 1 minute. Usually, several new tick-line segments appear while a bar of M1 time frame is completed. After the release of an important economic indicator, the number of ticks per bar may exceeds 100. This indicator overlays the tick-line on

Curiosity 10 The Bars Signals It is an advanced trading system. This is a fully automatic Expert Advisor, which allows you to presize the trade according to the preferences of the trader. Curiosity 10 The Bars Signals have more than 260 customization options for your trade. Different options for different styles of trade. Curiosity 10 The Bars Signals is a Trend system of trade with different algorithm of trade mode. This EA using signals to place orders. Is a revolution in the customizatio

Indicator is used for: defining price probability distributions. This allows for a detailed representation of the channel and its borders and forecast the probability of a price appearing at each segment of its fluctuations; defining the channel change moment. Operation principles and features Indicator analyzes a quote history on lower timeframes and calculates a price probability distribution on higher ones. Forecast algorithms allow the indicator to calculate probability distributions and m
Hulk GBPCHF passes the test from 2000 to the current day! The expert uses independent strategies, including trading on short-term and long-term trends! trades on the GBPCHF, GBPCAD m5 currency pair by default !
Please pay attention to my other products: https://www.mql5.com/en/users/malishko89/seller#products
Please note that the adviser has summergmtshift and wintergmtshift in its settings, so summer and winter gmt may differ! It all depends on your broker! So that testing is

Flower Trend Flower Reserve 这款EA以趋势为主,可以作为很好的工具使用,默认参数,是多空双方单子加在一起盈利时候离场,注意回避重大新闻和事件。 现在通过下面链接(入金大于5000美金)开户,可以免费使用这款EA https://www.usgfx.com/RegAcc/RegAccStep1?culture=zh-CN&IB=2128p8x8R8x8K8P-0b EA signal : https://www.mql5.com/en/signals/630704 建议:
在使用这款EA前,请现在模拟账户上测试; 使用VPS ; 不限制账户类型 ; 每300美金开0.01单位,1:500杠杆; 交易主流货币对; 任意周期上使用,推荐1小时; 你也可以在1分钟周期上使用,不过这样风险比较高;
参数 Maxspreed size_n - 这是加仓最小间隔 Lots - 固定下单手数. DecreaseFactor - 资金倍投参数,建议在0.1~0.6之间 (0~0.6) UseMM - 复利开关 PercentMM -复利开关参数 MFTS_S
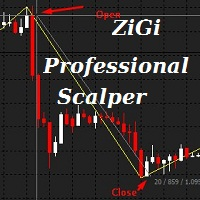
ZiGi Professional Scalper Indicator: Real Wave Analysis Tool This indicator reveals the true waves of the market by identifying alternating highs and lows on the price chart, thus displaying the market's wave structure. The algorithm of this indicator is entirely new, and its association with ZiGi Professional Scalper and Zigzag is purely cosmetic. It is based on eight radically different algorithms and is capable of calculating market volumes in real-time. When using this indicator, manual wave

it is an indicator for trading on the forex market and binary options, it is a trend tool with which you can take it most often when the first signal appears, open a trade in the indicated direction stop loss set above the arrow if the signal is lower or below the arrow if the buy signal when signals appear in the same direction where the transaction is open, you can enter into additional stop loss orders; we also set up trading without take profit; you need to close the transaction when a signa

The expert advisor opens trades when the forex market is ranging and the RSI indicator enter in oversold or overbought areas. The Stop Loss, Take Profit, and Trailing Stop are calculated based on the ATR indicator. The recommended currencies pairs are EURUSD, EURGBP, USDJPY, EURCHF, EURNZD, AUDCAD and the recommended timeframe to operate and to do backtests is M5 . This Expert Advidor can be profitable in any TimeFrame and with any Currency Pair but you should know how to adjust the parameters

A professional version of the ZigZag indicator for visualizing the structure of price movements by fractals. Fractal ZigZag fixes the flaws of the standard version of the ZigZag indicator MT4. It uses Price action and a unique filtering algorithm to determine fractals. Suitable for all types of trading.
Ideal for trading according to the WM pattern "Sniper" strategy !!! Features Marks the place of price reversal during the formation of a new fractal with specified parameters. Suitable for al
您知道为什么MetaTrader市场是出售交易策略和技术指标的最佳场所吗?不需要广告或软件保护,没有支付的麻烦。一切都在MetaTrader市场提供。
您错过了交易机会:
- 免费交易应用程序
- 8,000+信号可供复制
- 探索金融市场的经济新闻
注册
登录