Robots comerciales e indicadores para MetaTrader 4 - 269
Este indicador calcula el Chaikin Money Flow (CMF), que es muy útil para identificar la tendencia de los precios. El indicador proporciona alertas cuando los niveles superiores o inferiores (especificados por el usuario) son cruzados por CMF. Puede decidir recibir una alerta estándar en MT4 y/o una notificación push en su aplicación Metatrader. Puede configurar el indicador especificando también: - Periodos CMF - Niveles en los que se proporciona la alerta
Enlace al canal de Telegram para la c

asesor sin indicadores. Los puntos de entrada se calculan a partir del movimiento del mercado. Pares recomendados EURUSD,USDJPY.TF H1
extern double Tp = 200; //TP extern double Tp1 = 15; //TP1 extern double Sl = 15; //SL extern double Lote = 0.1; //Lote extern int Magia = 56; //Magia int deslizamiento = 3 extern bool ilan_martin = false; //Cierre en apertura extern bool zkrplu = false; //Cierre con un plus
extern bool sig = false; //un montón de órdenes))) extern bool slzb = true; //SL detrás
El indicador ZigZag se basa en el indicador RSI. Esto permite identificar extremos significativos.
Se proporcionan diferentes opciones de cálculo:
- Indicador RSI en precios Close o Hi-Low (1 y 2 buffers respectivamente en modo OnClose - el primer buffer, en modo Hi-Low el primer buffer en precio High, el segundo buffer en Low);
- Indicador ZigZag por periodo (estándar) o desviación mínima. (Los valores del indicador ZigZag siempre están en buffer cero).
Si utiliza un marco de tiempo superi

indicador de cusiosidad Cusiosity INDICATOR Es un sistema de comercio avanzado. Se trata de un Asesor Experto totalmente automático, que le permite presize el comercio de acuerdo a las preferencias del comerciante. CDiferentes opciones para diferentes estilos de comercio. Este EA utilizando señales para colocar órdenes. Es una revolución en la personalización de la negociación. Los algoritmos desarrollados para la identificación de áreas de cambio de tendencia. Puede descargar la demo y probarlo

Pips Sniper es 85% rentable robot de comercio de divisas que utiliza la acción del precio y los indicadores para entrar en el mercado con los oficios. Utiliza una estrategia de cobertura para corregir las operaciones erróneas y hacer uso de stoploss y tomar ganancias para salir del mercado. También proporciona opciones para utilizar la estrategia de equilibrio. Este robot da mejores resultados en el gráfico H1 con una cuenta con spread mínimo (por debajo de 10 puntos). Este robot se puede utiliz

Hola a todos. Este EA funciona igual que el Probability Expert Advisor, excepto los puntos de entrada de la orden, aquí se utiliza el nivel de soporte y resistencia combinados con SMA , me explico: COMPRAR: Cuando el precio toca el nivel de soporte y todo pasa por encima de la SMA (Tendencia alcista). VENDER: Cuando el precio toca el nivel de resistencia y todo sucede por debajo de la SMA (tendencia a la baja). Esta configuración entra en la técnica de probabilidad de las tendencias del mercado.

Hola a todos. Este EA es la fusión de 2 powerfulls y simple concepto de probabilidad: Viene de gamblers/traders profesionales que vivieron con esta estrategia. Juega con la demo con todas las opciones para ver lo que quiero decir. (También siempre hacer sus planes y establecer sus parámetros en el probador antes de hacerlo en cuenta real). Funciona tanto con pequeñas como con grandes soldes, por lo que cualquier trader puede utilizarlo. El EA no usa indicadores, solo probabilidad basada en las b

Con el indicador Market View , puede supervisar en un panel específico tantos productos como desee. Sólo tiene que añadir el indicador al gráfico, introducir los productos que desea ver y el período de cambio a seguir y eso es todo. Se abrirá un panel en la parte inferior del gráfico que le mostrará por producto el cambio en pips, la desviación estándar, la rentabilidad, etc. Personalmente, lo uso para seguir múltiples productos con los que tengo posiciones sin tener múltiples gráficos abiertos,

Hola y bienvenido a este EA, Mira aquí cómo configurar el bot https://www.youtube.com/watch?v=2wCzTFIGNp4&feature=youtu.be El ratio de ganancia es superior al 70%. Recomendado para funcionar en 4H o gráficos de día.
Este EA se crea para trabajar en todos los marcos de tiempo y todos los pares de divisas. Diferentes configuraciones posibles SL y TP Trailing Stop Martingala El EA es muy bueno para el crecimiento a largo plazo Funciona mejor en marcos de tiempo más altos, ya que habrá más datos

Taurus es un EA de alta calidad diseñado para ser consistentemente rentable a largo plazo.
Estrategia: Es una estrategia de Swing Trading que encuentra los puntos de inflexión clave y los negocia. Utiliza un stop loss fijo y un TP dinámico para capturar las oscilaciones.
Trabaja sobre los 7 mejores pares para diverzificación calculados por la IA para maximizar la fiabilidad y minimizar el DD.
EA trabaja en los siguientes Pares:(archivos en los comentarios)
-- EURUSD H4(POR DEFECTO) -- AUDUSD

Bfxenterprise RSI Inspirado y optimizado indicador RSI es el foco de este Asesor Experto (EA). Diseñado con el uso de RSI para realizar operaciones óptimas. Lectura de las tendencias y las inversiones de precios se realiza por el RSI cuyas funciones se han ordenado. Versión de Bfxenterprise La versión con el nombre "Bfxenterprise" se centra en la ordenación especial y minuciosa de las transacciones. Por lo tanto, esta versión no siempre realiza transacciones, a diferencia de la versión Expert A

Bfxenterprise CCI Cuando utilice este Asesor Experto (EA), las operaciones se basarán en el indicador CCI. Cada cálculo de tendencia o reversión de precios utiliza CCI. La destreza de este indicador es la razón de la optimización en el programa. Versión de Bfxenterprise La versión con el nombre "Bfxenterprise" se centra en la clasificación especial y minuciosa de las transacciones. Por lo tanto, esta versión no siempre realiza transacciones, a diferencia de la versión Expert Advisor en general.

Hola y bienvenido a este EA,
Este EA se crea para trabajar en todos los marcos de tiempo y todos los pares de divisas. Diferentes configuraciones posibles SL y TP Trailing Stop Martingala El EA es muy bueno para el crecimiento a largo plazo Funciona mejor en marcos de tiempo más altos, ya que habrá más datos recogidos.
Funciona tan bien en cuentas cent.
Deseo a todos los que compran la EA máximo éxito y buenos resultados comerciales
Por favor, operar con cuidado y responsabilidad. Gracias y

KT CCI Surfer utiliza una estrategia de trading de reversión a la media con una combinación de detección de zonas extremas de sobrecompra/sobreventa utilizando el Commodity Channel Index (CCI). Desarrollado por Donald Lambert en 1980, el CCI es un indicador adelantado que ayuda a identificar la región de sobrecompra/sobreventa en el mercado sin ningún desfase.
Obviamente, no todas las señales de sobrecompra/sobreventa se convierten en una inversión de los precios. Sin embargo, cuando se combin

Este EA ha sido desarrollado para EURUSD H4 timeframe. Todo está probado y listo para su uso inmediato en la cuenta real. Este Asesor Experto se basa en el indicador CCI . Entra si se produce una DIVERGENCIA después de un tiempo de consolidación . Utiliza órdenes pendientes de STOP con ATR STOP LOSS y TAKE PROFIT FIJO . Para obtener más beneficios también se proporcionan las funciones TRAILING PROFIT y BREAKEVEN . ESTRATEGIA muy SIMPLE con solo POCOS PARAMETROS. A las 21:00 cerramos todos los v
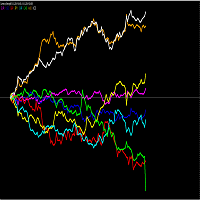
TENGA EN CUENTA QUE COMO MUCHOS INDICADORES DE ESTE TIPO EN ESTE MERCADO, ESTE INDICADOR NO FUNCIONARÁ COMO UNA DESCARGA DE DEMOSTRACIÓN PARA PROBADOR DE ESTRATEGIAS. Por lo tanto, la opción de 1 mes al menor coste permitido de 10$ está disponible para que lo pruebe. Una de las mejores maneras de operar es analizar divisas individuales en lugar de pares de divisas. Esto es imposible con los indicadores gráficos estándar en MT4. Este medidor de fuerza de divisas permite operar con la divisa más

La Línea Inversa señala un cambio en el ángulo de la media móvil, el parámetro LevelZero establece el círculo del punto cero, hay límites desde -LevelZero hasta LevelZero incluyendo los que se considerará un punto cero, esto se puede indicar en rojo en los histogramas. Opciones: NivelCero - punto cero [-NivelCero, NivelCero]; Longitud - longitud de la media móvil; Start - punto inicial para calcular el ángulo; End - punto final del cálculo del ángulo; MetodMA - método de cálculo de la media; Ap

Hola y bienvenido a este EA,
Este EA se crea para trabajar en todos los marcos de tiempo y todos los pares de divisas. Diferentes configuraciones posibles SL y TP Trailing Stop Martingala El EA es muy bueno para el crecimiento a largo plazo Funciona mejor en marcos de tiempo más altos, ya que habrá más datos recogidos.
Funciona tan bien en cuentas cent.
Deseo a todos los que compran la EA máximo éxito y buenos resultados comerciales
Por favor, operar con cuidado y responsabilidad. Gracias y

Este EA abrirá Compra y Venta simultáneamente después de adjuntarlo al gráfico. Se ha personalizado agrupación paso cuadrícula y grupo multiplicador de lote. Por favor, póngase en contacto conmigo si tiene alguna pregunta. Por favor, como, compartir y suscribirse a mi canal de Youtube. Voy a dar esta EA GRATIS para todo el mundo si hay 2k Suscriptor en mi canal de Youtube , por favor pregunte a su amigo, porque suscribirse es GRATIS :).
Necesita al menos 10k balance (10k centavos o 10k $), o se

Cada nuevo día de negociación está lleno de incertidumbre, lo único que es seguro son los SWAPS (= interés a un día) al final de su día de negociación (5:00 PM EST). Ahora con mi Carry Trader EA es muy fácil utilizar esto como una ventaja inteligente . Es la manera más fácil de apalancar sus ganancias en el mercado FOREX. Mi EA Carry Trader tiene la capacidad de escanear pares de divisas para swaps positivos. Es un EA simple pero muy efectivo . ¡Se abrirá el orden en la dirección correcta y gest

Presentamos el sistema de scalping HighScalpel. Es suficiente para optimizar una vez, por ejemplo, por mes. Después de eso, muestra excelentes resultados en el período hacia adelante (varias veces mayor), que se puede ver en las capturas de pantalla.
¡Esté atento a los indicadores de spread de su broker! Cuanto mayor sea el spread, menor será la frecuencia de las entradas en el mercado. Si el spread es superior a 20 pips, entonces el número de entradas cae en dos órdenes de magnitud.
Lo ideal

Principal: No martingala, no una cuadrícula; Funciona con todos los símbolos;
Señales: Hay un buen algoritmo racional. Trabajo de dos indicadores: Bandas de Bollinger y OsMA (puede establecer un Timeframe separado para cada indicador)
Stop Loss / Take Profit: Hay un buen sistema de gestión de dinero (hay varios tipos de trailing stop loss); Hay niveles virtuales de Stop Loss / Take Profit; Hay lote inteligente (porcentaje por riesgo) o lote fijo
Importante: EA puede trabajar en velas cerrada
ZoneFinder es un panel de indicadores que presenta una visualización interactiva y multitemporal de la dirección y la fuerza de la tendencia. La fuerza y la dirección de la tendencia se miden mediante un indicador ADX modificado basado en valores DI+ y DI- suavizados. Las zonas de alta probabilidad de negociación se identifican mediante retrocesos de Fibonacci. Cuando se encuentran estas zonas, se marcan en el gráfico junto con un objetivo de extensión de Fibonacci propuesto.

MS Trading Asesor Experto
Este Robot está totalmente automatizado y ha sido creado para todo el mundo. El Robot funciona también en cuentas cent. =============================================================================================== => funciona en todos los marcos de tiempo de 1 minuto a 1 día => En los marcos inferiores hay demasiados pequeños oficios, pero su hasta usted. => Yo recomendaría probarlo en una cuenta Cent si no está seguro. => Puede hacer clic en el enlace de abajo par

El indicador muestra la dirección de la tendencia, señalándola mediante puntos pivote. Puede utilizarse con una relación de riesgo óptima. Las flechas indican momentos y direcciones favorables para entrar en el mercado. Utiliza un parámetro para ajustar (ajuste de 1 a 3). Funciona en todos los pares de divisas y en todos los marcos temporales.
El indicador se puede utilizar tanto para piping para periodos pequeños como para trading a largo plazo. Funciona en todos los pares de divisas y en tod

Tendencia Nuevo indicador de tendencia, muestra las señales de entrada. Muestra tanto los puntos de entrada como la propia tendencia. Muestra con flechas los momentos calculados estadísticamente para entrar en el mercado. Al utilizar el indicador, es posible distribuir de forma óptima el factor de riesgo.
Ajustes :
Utiliza un único parámetro para los ajustes. Seleccionando un parámetro, es necesario asemejarlo visualmente para que el gráfico apropiado tenga una proyección de extremos.
Opcion

Marte 15 es un indicador de ruptura es un poderoso indicador de comercio Patrón para cualquier par y cualquier marco de tiempo. No requiere ningún indicador adicional para la configuración de comercio.el indicador da señales claras sobre la apertura y cierre de operaciones.este indicador es un único, de alta calidad y asequible herramienta de comercio. Se puede utilizar en combinación con otros indicadores Perfecto para nuevos operadores y operadores expertos Entradas de bajo riesgo. Nunca repin
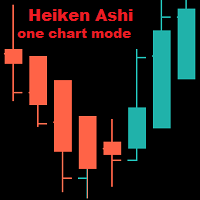
Heiken Ashi En Un Modo De Gráfico MT4 El indicador se muestra sólo en uno de los modos de gráfico: Barras, Velas, Línea. Por defecto es Barras. Al cambiar el modo de gráfico, el indicador se muestra o desaparece dependiendo del modo de gráfico. Parámetros de entrada: iChartMode: en qué modo de gráfico debe mostrarse el indicador. mBars mCandles mLine Colores: LightSeaGreen: vela alcista Tomato: vela oso

Copyright(c) 2019 Superfarabi EA Es el Asesor Experto de Forex Scalping para MT4 Trabajando en marcos de tiempo (M5) El mejor par recomendado es EU/UChf=0.4 El cálculo se basa en el indicador Envelopes
===========Rakyat +62 =========== Hak Cipta (c) 2019 Superfarabi EA Merupakan Scalping Forex Expert Advisor untuk MT4 Se puede utilizar en el marco de tiempo Kecil (M5) Rekomendasi par adalah EU / UChf = 0,4 Perhitungan didasarkan pada indikator Envelopes

Espíritu de Ilan El Asesor Experto Ilan Spirit es un análogo del Asesor Experto, con la adición de muchas lógicas adicionales y oportunidades para el comercio, con los ajustes restantes del Asesor Experto. El Asesor Experto negocia según el sistema Martingale con el aumento de lotes posteriores en una serie de órdenes, con el fin de promediarlas. La primera orden es colocada por el robot de acuerdo a las señales del indicador incorporado. El Asesor Experto también tiene la capacidad de detener l

Fx Abrams M1 El trabajo del Asesor Experto es el aumento de lotes y su promediación, pero la principal diferencia es el comercio proporcional. Gracias a esto, los parámetros del Asesor Experto no serán sobreoptimizados. El Asesor Experto opera simultáneamente en ambas direcciones, sin indicador. La información más importante sobre el trabajo se muestra en el gráfico. Lo más importante es optimizar correctamente el Asesor Experto. La compra y la venta se optimizan por separado desactivando la opc

Ilan Barbudos Fx Asesor Experto Ilan Barbudos Fx - es un análogo del asesor que negocia en un gráfico en diferentes direcciones simultáneamente (esto requiere una cuenta correspondiente que lo permita), con la adición de muchas lógicas adicionales y oportunidades para el comercio, con los ajustes restantes del asesor. El Asesor Experto opera según el sistema Martingale con el aumento de lotes subsiguientes en una serie de órdenes, con el fin de promediarlas. Las primeras órdenes que el robot pon

Edward Teach Fx Se trata de un Asesor Experto para el comercio a corto plazo utilizando una serie de órdenes con su promedio y posterior aumento. El Asesor Experto opera en ambos sentidos, eligiendo el lado más apropiado durante el proceso de negociación. Utiliza beneficios ocultos y un trailing stop virtual en forma de arrastre. El Asesor Experto también tiene la capacidad de detener la negociación (no abrir nuevas órdenes) antes de noticias importantes, tanto configuradas manualmente como reci

Ilan RGD Ilan RGD es un análogo del Asesor Experto, con la adición de muchas lógicas adicionales y oportunidades para el comercio, con los ajustes restantes del Asesor Experto. El Asesor Experto negocia según el sistema Martingale con el aumento de lotes posteriores en una serie de órdenes, con el fin de promediarlas. La primera orden la coloca el robot según las señales del indicador incorporado. o las señales del indicador propio del usuario (existe la posibilidad de incorporarlo al EA). El As

Kriptonita Fx Kryptonite Expert Advisor no tiene análogos, se crea sobre la base de la experiencia de negociación en los mercados durante más de 15 años. El Asesor Experto tiene una buena información y muestra una excelente rentabilidad, pero aún así, la base del Asesor Experto es la seguridad de la cuenta de operaciones. Hay muchos módulos de comercio incluidos que mejoran el proceso de negociación del robot y el comerciante, así como existe la posibilidad de conectar un indicador de noticias y
El indicador de triple oscilador "ThreeAngleR " es un indicador común para tres calculadoras de la desviación angular del gráfico de precios de un instrumento de negociación.
PARÁMETRO DE ENTRADA: Input1= "AnglerSPeriod "; - DRAWs1=128 - Número de barras para mostrar el indicador en el historial del gráfico; - PeriodIND=14 - periodo de cálculo del indicador en número de barras; Input2= "JAngleR "; - DRAWs2=128 - Número de barras para mostrar el indicador en el historial del gráfico; - Period_I

Bienvenido a DCC Forex Expert Advisor
En cuanto a este EA hecho a sí mismo , la tasa de ganar es del 79
se trata de un auto hecho de Forex automatizado de software por mí mismo. El robot funciona en todos los corredores, así como los corredores de centavo.
Deseo a todos los que compren el EA el máximo éxito y buenos resultados comerciales.
Por favor, el comercio con cuidado y de manera responsable. Gracias y feliz trading a todos Gracias y feliz comercio

Software de inversión a largo plazo
Este EA se crea para trabajar en todos los marcos de tiempo y todos los pares de divisas. Usted no necesita hacer mucho. El archivo está listo para ser utilizado para 1H Frame o superior. Pero, por supuesto, usted puede jugar con la configuración y elegir su marco favorito. Muy simple y fácil de entender. Diferentes configuraciones posibles SL y TP Trailing Stop Martingala El Ea es muy bueno para el crecimiento a largo plazo Funciona mejor en marcos de tiempo
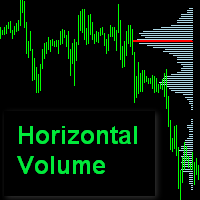
El indicador Horizontal Volume Profile muestra la distribución del volumen para un intervalo determinado. La longitud de las líneas es proporcional al volumen negociado por este precio. Parámetros de entrada : Intervalo= 0-el indicador se recalcula diariamente a las 00: 00, Intervalo= 1..5 - el indicador se recalcula en un día determinado de la semana (Lun..Vie.) Count Of Days= 1..30 - días de análisis. PipStep= 10 - paso de rango de análisis. Cuanto mayor sea, más rápido y más grueso será el re
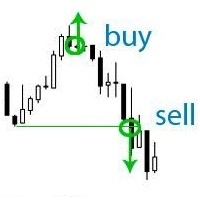
Si su depósito está en drawdown - ¡este EA le ayudará a salir de él!
DEPOSIT SAVER bloqueará su posición para evitar que el drawdown aumente significativamente, y luego cerrará todas las órdenes hasta alcanzar el punto de equilibrio. Por favor, tenga en cuenta que la tarea del EA no es traerle beneficios. La tarea del EA es retirarle del drawdown y cerrar todas las posiciones a cero. 1. Antes de instalar el EA en el gráfico, elimine el stop loss de sus órdenes, si lo hubiera; 2. El EA funciona
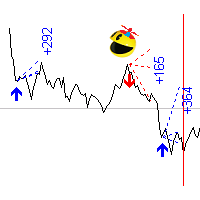
Lanzamiento simplificado de PACman EA. Experto es multycurrency, por lo que no sirve de nada para probarlo en el terminal MT4. Por lo tanto, ver la señal real y unirse a telegrama canal. Después de establecer los pares, el Asesor experto simula el comercio para el período anterior con la visualización de los resultados. El usuario puede cambiar interactivamente los niveles de señal y observar su impacto en el resultado de la simulación. De este modo, puede seleccionar los valores óptimos de los

Bossman EA Ver 1.1 Es el Asesor Experto de Forex Scalping para MT4 Bossman EA Ver 1.1 Trabajando en Timeframes (M5) Bossman EA Ver 1.1 Mejor Configuración de Disparo en el Par EURUSD o USDCHF Bossman EA Ver 1.1 El cálculo se basa en el indicador Envelopes ///////////////////////////////////////////////////////////// (I N D O N E S I A (ID) (Rakyat +62)) Bossman EA Ver 1.1 Adalah Penasihat Ahli Scalping Forex untuk MT4 EA Bossman Ver 1.1 para el mercado de divisas (M5) Bossman EA Ver 1.1 Pengatu
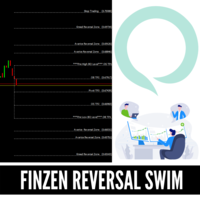
NIVELES DE INVERSIÓN FINZEN Más que un indicador regular es un sistema completo con los niveles de entrada, Stoploss, y TakeProfits niveles. Este indicador del sistema se basa en nuestra estrategia privada que ha estado utilizando durante un tiempo con nuestros fondos privados, este indicador se puede utilizar en acciones, FOREX CFD, pero sobre todo el uso con resultados sorprendentes en los mercados FOREX.
Este indicador detectará en algunos niveles específicos cuando la inversión del mercado

Este EA ha sido desarrollado para GBPUSD M15 timeframe. Todo está probado y listo para su uso inmediato en la cuenta real. Este Asesor Experto se basa en el indicador RSI . Entra si se produce una DIVERGENCIA después de un tiempo de consolidación . Utiliza órdenes pendientes STOP con ATR STOP LOSS y FIXED TAKE PROFIT . Para obtener más beneficios también hay una función TRAILING PROFIT . ESTRATEGIA muy SIMPLE con sólo POCOS PARÁMETROS. A las 21:00 cerramos todos los viernes para evitar gaps sem

El asesor experto utiliza una estrategia de ruptura al abrir todas las órdenes sin excepción. La negociación se realiza exclusivamente mediante órdenes pendientes. Los puntos de entrada se sitúan en mínimos y máximos locales, algunos niveles se excluyen con el filtro interno del EA. El número máximo de órdenes se establece en la configuración. El EA determina automáticamente el número de dígitos en las cotizaciones, por lo que el usuario no necesita pensar en ello y hacer los cambios apropiados

Presentamos Watermark Manager Utility , una poderosa herramienta diseñada para agregar marcas de agua personalizadas a los fondos de sus gráficos sin esfuerzo. Con sus opciones de personalización únicas, puede crear impresionantes marcas de agua utilizando múltiples campos de texto y campos de información de la cuenta. Ya sea que sea un YouTuber, un proveedor de señales, un blogger o cualquier persona que necesite gráficos de marcas de agua, esta utilidad es perfecta para usted. Esta utilida

*Este precio sólo por tiempo limitado y copia limitada a 1 año de alquiler. **Signal página se puede encontrar este enlace https://www.mql5.com/en/signals/614621 PDADaily Asesor Experto Este asesor experto funciona bien en gráficos diarios. Abre una orden pendiente basándose en los movimientos diarios de los precios y puede revisar esta orden pendiente basándose en los movimientos de los precios durante el día. Puede mantener la orden actual siguiendo los movimientos del precio y puede abrir ór

El asesor utiliza una estrategia basada en el uso de 7 indicadores Envelopes , en cada marco temporal (M5, M15, M30, H1, H4) hay 7 indicadores Envelopes. El trading se basa en la estrategia "Price Action", el asesor busca una señal simultánea en 5 marcos temporales: M5, M15, M30, H1, H4 y luego abre una orden. El EA utiliza el algoritmo Martingale y Averaging incorporado. El asesor utiliza noticias económicas para lograr señales más precisas. Se utilizan Take Profit, Break Even y Trailing Stop o

Dual Horizontal - un nuevo nivel en el comercio automático de Forex. El asesor utiliza una estrategia de soporte / resistencia. Todas las operaciones se realizan en un día. Se utiliza un algoritmo inteligente para la construcción de niveles de ruptura de precios. Backtesting se llevó a cabo en las garrapatas reales con una calidad de la historia del 99,9%. Muchos años de experiencia han dado sus frutos y hemos conseguido crear una nueva generación de robots. No hay estrategias arriesgadas, peque

Tengo más de $11000 en mi cuenta. ¡Estoy 100% confiado en mi robot! ¡Confía en mí y en ti! Enlace de seguimiento: https: //www.mql5.com/ru/signals/631995 Un pequeño depósito es suficiente para empezar a operar. ¡¡¡Ideal para la aceleración rápida de depósito !!! Adecuado para el comercio multi-moneda. Inmunidad a gran retraso y el tamaño de la propagación.
Principio de funcionamiento Expert Advisor comercia con martingala.
Recomendaciones Recomiendo utilizar el comercio multidivisa. Para ello
Este es un EA de inversión a largo plazo
En tiempos donde el interés con su Banco es 0 o negativo, este EA puede generar buenas ganancias a largo plazo.
Tendrá más opciones para ejecutar el EA Opción Estándar TP y SL Martingala Trailing Cómo ejecutarlo depende de usted. Funciona en todos los marcos y todos los pares. Mi recomendación Martingala o estándar con trailing stop Recomiendo la configuración actual y ejecutarlo en el gráfico del día para la inversión a largo plazo Tenga en cuenta que

Niveles Mercado es una de las herramientas más simples, pero no menos eficaces de este. A partir de estos niveles se pueden construir puntos pivote, los niveles se construyen como significación estadística en un momento dado. Operar por niveles es un clásico en el trabajo de un trader. Puede utilizarlos como una estrategia de trading ya hecha o como un filtro adicional en su sistema de trading. En los ajustes puede especificar el desplazamiento para la construcción de niveles.
Interpretación d

The 27x GBPUSD ninja
"The 27x GBPUSD ninja" is an EA that makes sure to get profit from the market using refined abilities like a Japanese ninja. It comes loaded with RSI and an indicator using a unique logic. The setting is simple and easy.
Setup
$1000 or more initial margin is recommended. Please use this EA on the GBPUSD currency pair on a 15 minute chart. It is extremely lightweight and has no problem running with other EAs at the same time.
Backtest
If you are backtesting, please us

Introducción de EA:
Gold long short hedging es una estrategia de trading totalmente automática de long short trading, cambio automático de manos y stop loss y stop profit dinámicos. Se basa principalmente en el oro y utiliza el favorable largo corto micro Martin. Al mismo tiempo, combinado con el mecanismo de cobertura, la cobertura larga corta se llevará a cabo en el mercado oscilatorio, y en el mercado de tendencia, la orden errónea de pérdida se detendrá directamente para cumplir con la tende

Funcionamiento: Athome funciona de la siguiente manera: En el momento en que usted ponga a funcionar el expert , éste colocara ordenes pendientes de compra (BuyLimit) hacia abajo del precio, y ordenes pendientes de venta (SellLimit) hacia arriba del precio. usted podra modificar las variables de Athome en los parametros de entrada. Recomendamos los siguientes parámetros para un funcionamiento eficaz: lot = 0.01 StopLoss = 3500 TakeProfit = 850 Distance = 50 OperationsAmount = 75 EarningPercent

Candle Inside indicator - dibuja velas japonesas de un marco temporal superior en el gráfico. Ahora, después de cargar el indicador, es posible ver lo que está sucediendo dentro de cada vela. Además de los botones estándar para seleccionar el marco de tiempo en el terminal MT-4, se añaden botones adicionales, cuando se hace clic, se selecciona un período más antiguo para mostrar velas japonesas o zonas. Por ejemplo, si selecciona el periodo estándar M1 y el periodo del indicador M5, entonces el
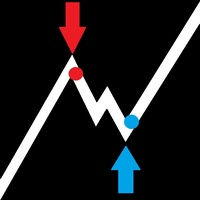
EnE EntryDotPro es un desarrollo único para los traders que no tienen confianza en sus operaciones y no encuentran una estrategia que funcione. El indicador es adecuado para todos los instrumentos y para todos los marcos de tiempo. El indicador funciona en todas las situaciones de mercado en tendencia y plano. Además, el indicador es muy simple en la configuración y en el uso para no distraer a los operadores de la negociación. El indicador muestra la señal en el lugar donde aparece el punto, t

La EA cierra las órdenes de mercado después de un cierto número de ticks después de la apertura. Use este asesor si necesita cerrar un trato después de un tiempo determinado.
El EA tiene los siguientes parámetros de entrada:
Solo símbolo actual: si es verdadero, el EA cerrará las órdenes solo del instrumento seleccionado; si se establece en falso, cerrará cualquier orden en cualquier instrumento. Tiempo de espera: la cantidad de tics después de los cuales el EA cerrará los pedidos. Tenga en c

Este EA le permite duplicar cualquier orden procedente de un proveedor de señales con un tamaño de lote especificado, abriendo y cerrando en consecuencia, incluido stop loss y take profit. El EA debe estar conectado a un gráfico y funciona automáticamente en todas las órdenes, independientemente del símbolo. Puede funcionar también en Hosting. Tenga en cuenta que la duplicación de señales aumentará su riesgo. Téngalo en cuenta.

Turbo Fix - el asesor utiliza una serie de indicadores para buscar señales para entrar. ¡Funciona en modo totalmente automático! Utiliza la configuración predeterminada. A diferencia de otros desarrollos alternativos, este bot puede operar simultáneamente en compra y venta. Esta es una ventaja significativa en el trabajo real, ya que hace que sea posible lograr resultados significativamente mejores debido al aumento de la capitalización. El bot funciona como un bisturí con movimientos bruscos d

Un indicador de tendencia, y no la primera vista, es un indicador regular, pero se puede utilizar con un coeficiente de riesgo óptimo. El principio de trabajo es simple - el indicador muestra los momentos para entrar en el mercado con flechas, que es muy fácil de percibir visualmente.
Se recomienda utilizar un oscilador con un indicador adicional, por ejemplo, RSI estándar. Debe responder al nivel 50. O utilizar algún otro sistema de confirmación.
El indicador se puede utilizar tanto para la
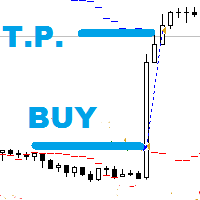
El experto coloca órdenes pendientes en torno a niveles de negociación importantes y si se activan dentro del plazo de validez de la orden, pueden cerrarse por Take Profit , Stop Loss , por indicadores implementados (Williams Percent Range , Bollinger Bands , Momentum) o por el número de velas transcurridas desde la apertura de la orden. También dispone de funciones de gestión BreakEven , TrailStop y AutoLot . Par preferido : USD/JPY ; Marco temporal : H1 ;

Este EA tiene incorporada la tendencia Estocástico, RSI y EMA Cruz indicadores para comprobar las tendencias antes de realizar cualquier acción comercial. Su motor está provisto de: trailing Stop Loss; filtro de mal momento para operar para cada día de la semana; activar y desactivar el modo martingala; definir el valor máximo de spread para operar; definir el porcentaje mínimo de equidad para permitir el comercio; los valores de entrada ya están optimizados para EURUSD en el timeframe M30. La
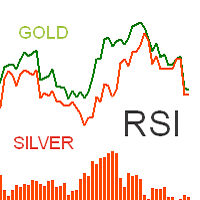
El indicador muestra dos RSI líneas de Símbolos diferentes y un histograma del módulo de diferencia entre ellos. Los nombres de los Símbolos puede Usted asignar en la configuración: First Symbol Second Symbol Para la línea RSI del segundo Símbolo el indicador capacita hacer el reflejo. El reflejo de la línea RSI del segundo Símbolo lo necesitamos para controlar la divergencia de las líneas RSI para los Símbolos con correlación inversa. Por ejemplo, cuando esta comparando Usted los datos de RSI d

Este EA está creado para trabajar en todos los marcos de tiempo y todos los pares de divisas. Diferentes configuraciones posibles SL y TP Trailing Stop Martingala El EA es puramente basado en velas. Funciona mejor en los marcos de tiempo más altos, ya que habrá más datos recogidos. Funciona también en cuentas de centavos.
Deseo a todos los que compren el EA el máximo éxito y buenos resultados comerciales.
Por favor, operar con cuidado y responsabilidad. Gracias y Feliz trading a todos

Trend Actual Indicador de la dirección de la tendencia actual. La dirección está determinada por la posición de la línea indicadora en relación con el nivel cero, si la línea está por encima del nivel cero, la dirección de la tendencia es hacia arriba y se asumen compras, si la línea del indicador está por debajo del nivel cero, la dirección de la tendencia es a la baja y se asumen ventas. Cuando la línea del indicador cruza el nivel cero, la tendencia cambia a la opuesta. Descripción de la co

Personalmente me encantan los robots de trading, pero hay muchas situaciones en las que el trading semiautomático es superior a la automatización. El sistema es muy sencillo y eficaz.
Trend lines are typically used with price charts, however they can also be used with a range of technical analysis charts such as CCI and RSI.
¿Qué es la línea de tendencia?
La línea de tendencia es una línea que delimita el movimiento de los precios. Se forma cuando se puede trazar una línea diagonal entre un

Este es un Robot de detección de inversión
https://youtu.be/2wCzTFIGNp4 El Robot fue diseñado por mí mismo y ya funciona en cuentas reales. Este Ea se basa en reversiones de alta probabilidad en las tendencias. Mayor precisión en marcos de tiempo más altos Se puede utilizar con ajustes de TP y SL con trailing stop como MArtingale El robot funciona en todos los pares de divisas y en todos los marcos temporales. Cuanto mayor sea el marco, mayor será la posibilidad de la precisión del comercio.
Marte 14 es un indicador de ruptura es un poderoso indicador de comercio Patrón para cualquier par y cualquier marco de tiempo. El indicador da señales claras sobre la apertura y cierre de operaciones. Este indicador es una herramienta única, de alta calidad y asequible. Puede ser utilizado en combinación con otros indicadores. Perfecto para nuevos operadores y operadores expertos Entradas de bajo riesgo. Nunca repinta la señal. Nunca repinta la señal. Nunca recalcula la señal. Sólo para MT4 Id
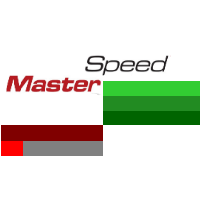
Speed Master es un indicador de tendencia, cuyas señales se muestran como un gráfico de barras y varios tipos de flechas en el gráfico de precios. Las lecturas del indicador se basan en cálculos idénticos del indicador Speed Trend - https://www.mql5.com/ru/market/product/36524#!tab=tab_p_overview , excepto que este indicador calcula en lugar de uno, tres períodos especificados en el marco de tiempo actual, y en base a ellos muestra señales en la dirección del período superior al inferior. Speed
El Mercado MetaTrader es la única tienda donde se puede descargar la versión demo de un robot comercial y ponerla a prueba, e incluso optimizarla según los datos históricos.
Lea la descripción y los comentarios de los compradores sobre el producto que le interese, descárguelo directamente al terminal y compruebe cómo testar el robot comercial antes de la compra. Sólo con nosotros podrá hacerse una idea sobre el programa, sin pagar por ello.
Está perdiendo oportunidades comerciales:
- Aplicaciones de trading gratuitas
- 8 000+ señales para copiar
- Noticias económicas para analizar los mercados financieros
Registro
Entrada
Si no tiene cuenta de usuario, regístrese
Para iniciar sesión y usar el sitio web MQL5.com es necesario permitir el uso de Сookies.
Por favor, active este ajuste en su navegador, de lo contrario, no podrá iniciar sesión.