 MetaTrader 5
 专家
专家
 指标
指标
 程序库
程序库
 实用工具
实用工具
 窗口小部件
窗口小部件
 规则
规则
适用于MetaTrader 4的新EA交易和指标 - 351
 EA交易自动执行市场交易,而指标可使您更准确地分析报价并预测价格行为。
通过这些应用程序,您将能够更明智地在MetaTrader 4执行交易,抓住更多的交易机会。
EA交易自动执行市场交易,而指标可使您更准确地分析报价并预测价格行为。
通过这些应用程序,您将能够更明智地在MetaTrader 4执行交易,抓住更多的交易机会。 
Using high-volatility channel breakout-style trading systems has historically worked well across major currency pairs, show promise in determining the opportune time to trade the channel breakout trading strategy. This Breakout Strategy may look simple, but it is good follow trade trader strategy.
Setting: Channel Periods: default 20 BarsCount: bars count in history Alert_Settings = "+++++++++++++++++++++++" SendMailMode = true - Send email SendNotificationMode = true - Send notification to you
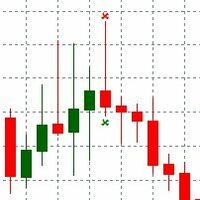
PinBar indicator is an Indicator identifies price reversal, pattern and timely identifies that price trend is changed. The Trend change is immediately identified over the chart. Alert is send over the Chart and Email address. Indicator generated Signal Price is displayed over the chart near the PinBar. Please make sure to use on Higher time frames if you are swing trader. for day traders who want to use M30 or M15 time frames, Take profit should be kept minimal. Lower than M15 is not recommende
FREE

对于那些总是想了解帐户当前情况的人来说,此信息指示器将很有用。该指标显示诸如利润点数、百分比和货币等数据,以及当前货币对的点差以及柱在当前时间范围内收盘的时间。 MT5版本 - 更多有用的指标
有多种选项可用于在图表上放置信息线: 价格右侧(运行在价格后面); 作为评论(在图表的左上角); 在屏幕的选定角落。 还可以选择信息分隔符: | / 。 \ # 该指标具有内置热键: 键 1 - 退一步显示信息类型(价格、评论或角落的右侧) 关键2——信息显示类型的进步 键 3 - 更改信息行显示的位置 可以在设置中重新分配热键。 该指标易于使用且信息丰富。可以在设置中禁用不必要的信息项目。
设置 替换显示信息的热键(向后) - 后退信息显示类型 用于替换显示信息的热键(前进) - 信息显示类型向前迈进了一步 用于更改外观/角信息字符串类型的热键 - 更改信息行显示的位置 文字颜色 - 文字颜色 盈利颜色 - 有浮动利润时的文字颜色 失色 - 存在浮动损失时的文本颜色 分离器 - 一行中的数据分隔符。可以采用五个值:“|”、“/”、
FREE
Martin Pristine Martin Pristine 是一个交易机器人,一个使用 价格通道中心 指标读数的分析作为做出交易决策的信号的顾问。不需要在图表上额外安装指标,指标内置于“EA 交易”内部。 每次亏损交易后,交易量乘以 2。 EA 自动检测货币对报价中的 5 位和 6 位数字。 一次只能在市场上持有一个头寸。
顾问设置说明: TF = 15; - 为价格通道中心指标 选择图表周期 Bars_Count = 100; - 价格通道中心指标 的分析柱数 止损 = 50; - 限制点数损失 止盈 = 50; - 以点数限制利润 手数 = 0.1; - 顾问订单的起始量 MN = 2808; - 顾问订单的幻数 UseSound = True; - 在顾问中启用或禁用事件的声音伴奏 市场观察 = 真; - 通过修改方法设置损益水平 滑点 = 30; - 最大允许价格滑点

The market is unfair if only because 10% of participants manage 90% of funds. An ordinary trader has slim changes to stand against these "vultures". This problem can be solved. You just need to be among these 10%, learn to predict their intentions and move with them. Volume is the only preemptive factor that faultlessly works on any timeframe and symbol. First, the volume appears and is accumulated, and only then the price moves. The price moves from one volume to another. Areas of volume accumu
The utility copies trades from the signal provider accounts (master accounts, one or multiple providers) to unlimited number of receiver accounts (slave accounts). Attention! Y ou need to use identifiers (Provider number) of the same length if you use several master copiers. For example. 1, 2, 3 or 11, 13, 22. The copying can be set in the opposite direction. The comments with all the recently performed actions are displayed on the screen to monitor the utility actions in slave mode. To avoid p

The Best and Worst indicator (similar to Net Change Indicator) has the peculiarity of being a dynamic indicator. It seems a very Stock Exchange Indicator. This means that it is able to draw up a list and put in order the best and worst instruments in descending order. You can choose to show the percentage of any Time Frame: 1M, 5M, 15M, 30M, H1, H4 etc ... This instrument could really give great suggestions on your trading in order to center the right time and to have a total view of the markets
Vanesa RSI Reverse provides an amazing trading strategy. Use optimization function of Strategy Tester in MetaTrader 4 to find out many high potential parameter sets in very long term of history data (more than 2 years). The EA works well with XAUUSD in M15 but it also give similar results in others symbols and time frame. It just takes some minutes to try it out in your own history data to see the very good performance. We will continue to improve the strategy to get better performance in next v
FREE

The indicator Net Change is a very useful tool able to extrapolate a percentage in order to have a real reference on the performance of the instrument. This indicator is designed to show the main values: you could monitor the Daily, Weekly, Monthly, Quarterly, Semi-annual and Annual percentages. A necessary tool for those who want to really explore the quantitative logic of the market.
Input values SYMBOLS SETTINGS Use_Only_Current_Symbol (true/false): Permits to manage only current symbol on p

BigPanel is a plug-in indicator that works exclusively with Control adora Expert Advisor. Its main functions are as follows: Select two types of button arrangement (horizontal or vertical) Change the buttons' size (from small to big; there are five different sizes in total) Move the buttons' panel around the chart. The arrangement and size can be settled in the indicators properties. To move the buttons' panel, click once over the hand button and move your mouse, the panel will follow it. To sto
FREE
BuyLimit and SellLimit Buttons opens any combination of Buy Limit and Sell Limit pending orders and closes all existing pending orders. If boolSL = true, then the EA will add a Stop Loss value to all pending orders. If boolTP = true, then the EA will add a Take Profit value to all pending orders.
Inputs Before placing all pending orders, the input window is opened allowing you to modify all input parameters: DeleteAllPendings: if true , then all pending orders (for the current currency) can be

Trend Trade indicator is based on ADX indicator to define long/medium/short trend and good entry signals. The product supports virtual trade on chart to show where/when should we make an entry/exit. It works very well on D1 or above. The indicator is efficient on GOLD and CFDs. Alert_Settings = "+++++++++++++++++++++++" SendMailMode = true - Send email SendNotificationMode = true - Send notification to your phone AlertMode = true - Sound alert Show_Virtual_Trades = true - Show virtual trades Sin

This indicator is another variant of the famous powerful indicator Fibonacci-SS https://www.mql5.com/en/market/product/10136 but has different behaviour in placing Pending Order and TP Line. Automatically places Fibonacci retracement lines from the last highest and lowest visible bars on the chart with: An auto Pending Order (Buy/Sell). Taking Profit 1, Taking Profit 2 is pivot point and Taking Profit 3 for extended reward opportunity. The best risk and reward ratio.
Simple and powerful indicat

Piramida Grid Piramida Grid - 进入市场,顾问分析 斜率方向线 指标的读数。当市场反转时改变订单网格。处理挂单 BUYSTOP 和 SELLSTOP。使用损失平均系统来控制未平仓交易的余额及其无损失的输出。自动检测 6 位和 5 位数字。
顾问设置: 周期 = 32; - 斜坡方向线指示器的周期 过滤器编号 = 2; - 设置坡度方向线指示器的过滤器 ma_method = 3; - 平滑斜率方向线指标读数的方法 应用价格 = 0; - 用于计算斜率方向线指标的价格 TF = 15; - 斜率方向线指标的图表周期 止损 = 0; - 限制点数的损失水平 Order_Step = 20; - 以点为单位的网格订单之间的距离 Count_Order = 5; - 网格中的订单数量 Lock_Pips = 22; - 以点为单位打开平均订单的距离 克夫 = 2; - 乘以大量平均订单的系数 利润 = 10; - 以点为单位的利润水平 手数 = 0.1; - 起始手数 MN = 100; - 顾问订单的幻数 UseSound = True; - 启用或禁用顾问

YF-Meter indicator help you to find the fastest speed up currency pairs.
While the US news are released, non-US currencies rising up or dropping down at the moment.
It is important to consider "the opportunity cost" of opening the positions.
If we can find the fastest rising up or dropping down currency pairs, that would improve our trading. This idea comes up with "Newton's laws of motion", different from the traditional volatility measurement.
After adjustment by the unique filter(the digital

i-Regression Channel generates regression channel: Linear regression channel consists of two parallel lines located at the equal distance from the linear regression trend line. The distance between the channel borders and the regression line is equal to the value of the highest close price deviation from the regression line. degree - degree of regression, changes from 1 to 61; kstd - regression channel width; bars - the number of bars for the channel calculation; shift - the channel horizontal s

Breakdown Velocity is a fully automated trading system, using which you'll never miss a trend or sharp price movement. The Expert Advisor uses custom indicators of trend growth and tick volume.
Main Features Low drawdown! Built-in money management Tight stops Protection against high level of spread Protection against slippage (to minimize losses and maximize profits) Non-grid system Not arbitrage. Does not fit results with historical data The maximum loss is no more than 60 points for a 5-digit

The indicator colors bullish, bearish and doji candles. Also, the amount of candles (bullish, bearish and doji) for the last N days is calculated. You can select colors for both bodies and shadows of candles. You can also enable coloring only candle bodies. МetaТrader 5 version: https://www.mql5.com/en/market/product/11649 Parameters color bulls = color of bullish candle bodies color shadow bulls = color of bullish candle shadows color bears = color of bearish candle bodies color shadow bears =
The indicator calculates WPR formula on volume-aware indicators Accumulation/Distribution , OnBalance Volume , or Price Volume Trend . WPR range is moved into positive domain [0..1] for convenience.
Parameters WPR - period of WPR, by default 24; Base - type of the underlying indicator: AccumulationDistribution (by default), OnBalanceVolume, or PriceVolumeTrend; Price - applied price type for OBV and PVT, by default - Close; it's ignored in case of AD;
Screenshots On the screenshots below the
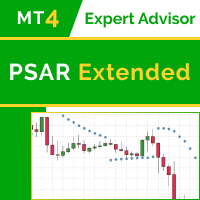
Main idea of this EA lies around the Parabolic SAR indicator. New version this Expert: PSAR Expert Extended 2 The advanced EA version includes the following changes and improvements: The free initial version has been analyzed and the EA algorithm has been improved The EA behavior has been monitored on various account types and in different conditions (fixed/floating spread, ECN/cent accounts, etc.) Cod optimization, bug fixes. The EA functionality has been expanded. Features better flexibilit

Risk Manager MT4 is an account protection Expert Advisor for traders who want strict risk control inside MetaTrader 4. The utility monitors your account equity, daily and weekly results, drawdown, open positions, trade count, consecutive losses, and trading hours. When a configured limit is reached, it can automatically close positions, cancel pending orders, stop other EAs, send notifications, or close the terminal. Instead of relying on discipline during a stressful trading session, you defi

MetaTrader 4 的通用指标顾问,具有广泛的功能,可处理标准指标。 1 个智能交易系统中的策略构建器。 来自标准 MetaTrader 集的大量交易指标。 可以选择 20 个信号中的 1 个和 20 个滤波器中的 5 个。 一百多个参数进行个性化定制以满足您的要求。 对于每个信号,您可以自定义指标参数、选择时间范围并指定信号条。 链接:
MetaTrader 5 终端的 X (MT5 的 X) 注意力 !新的通用交易顾问 Exp The xCustomEA 为了 元交易者 4 , 处理自定义指标 如果您想购买自我优化的自动交易顾问,请参阅我们的 滴答狙击手 !
可以在我们的博客中找到 EA 设置 + 演示 + PDF 的完整手册和说明 设置和输入的描述 即使 在博客中,也有关于如何优化和测试我们的顾问 The X 的信息 一个简短的功能列表:
逆势平均, 对趋势的额外发现, 追踪止损,盈亏平衡点, 关闭总损益, 虚拟止损、止盈和追踪止损, 处理头寸或挂单/限价单的能力, 鞅, 抛物线追踪止损
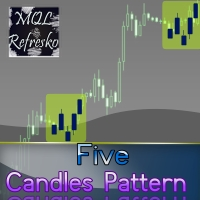
The "Five Candle Pattern" indicator is a novel way to see the market, because with it we can compare and/or seek training or the pattern of the past 4 or 5 Candles, and identify them in the same graph, to view your behavior at an earlier time. The indicator creates a pattern of those 4 or 5 candles and searches backward, identifies, and marks the same formation or pattern. With that information you adjust the strategy that is operating, or create a new one, because you can compare the past devel
The Open All indicator uses a simple market information that is "Open Candle". This tool is able to show all the openings of all time frames in order to extract information of strength and trendy. You can display 28 instruments with relative time frame interior for a total of 252 informations. The display is fully customizable, you can choose either the symbol and enable/disable Time Frames. Using it correctly you could get valuable aid to intercept correlations and turning points in the market.

This is a moving average which can move not only to the right/left, but also up/down. You can also select a mode of displaying the indicator (as a line or as dots) and all other settings of a standard moving average. If you overlay several indicators in one window, you can clearlier determine price channels setting each border individually.
Settings Line_or_Dot - mode of displaying the indicator: true - as a line, false - as dots; MA_period - moving average period; MA_shift_X - number of candle

The Expert Advisor opens orders from the horizontal line, the a trader can set on any level by dragging using the mouse or by changing the line properties. For example, when a horizontal line is above the current price, the EA will open a Buy order once the horizontal line is reached. And vice versa: If the line is below the current price, the EA will open a sell order once the line is crossed. A buy crossover of the line is: opening of the current candlestick below the horizontal line; the curr

This is an indicator detecting trend direction. It uses the popular Bill Williams Alligator. It shows market state on all timeframes on one chart. As is well known, traders gain the main profit on the Forex market trading by trend, and losses usually occur when the market is flat. So, in order to gain profit a trader should learn to detect trend market and direction of a current trend in a rapid manner. This indicator has been developed for this purpose. MTF Alligator helps to: Profitably trade
FREE
The main rule of the profitable trading is opening trades in the direction of a trend. You can define the current trend using fractal analysis. The Important Zone ResSup indicator displays important price support and resistance levels on the chart. The breakthrough or bounce from those levels shows further price direction. The data panel allows you to track the current trends on all timeframes. The current timeframe's important level values are shown in the comments. The indicator can be useful

LoLFx is a scalper Expert Advisor which uses the strategy of support and resistance lines breakthrough. Fully automated. Designed for trading EURUSD, a low spread broker is preferred. The EA independently detects support and resistance lines and places pending orders. When the market changes it removes old pending orders and places new ones. Just in case, orders are placed with preset stops to avoid significant losses in emergency situations, for example in case of Internet disconnection. Virtua

https://www.mql5.com/en/signals/my/all
Batman EA is a very simple expert system that works with ZigZag Indicator and using breakout strategy. It only opens trade when market actually breakout. It opens maximum 2 trades (1 buy and 1 sell if one of those does not close). It is very easy to use, does not need any complicated settings, just add it to a chart and it will run like clockwork for you. You can trade or test it on XAUUSD because we created this EA for this pair, but you can also trade or
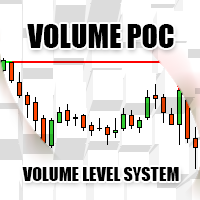
Volume POC
The Volume POC indicator displays important levels. You can use it as an independent trading system. Warning functions at a candle closing allow you to have some information on the market direction. The graphical display is simple and effective. The levels reported are the result of the study of historical market volumes. These levels give excellent entry points and excellent levels of support and resistance. You can use the indicator also on very low timeframes. It is suitable for t

SAAD Scalper is fully automated EA and handles two strategies at same time with its unique style to make most of trades profitable. The EA scalps pips by its strong Entry strategy. Trades that are not successful to scalp are handled in a different and unique way of martingale. It includes two options to deal with open trades. Pending Order Martingale (It helps to reduce Draw Down) Market Order Martingale It works on multiple currency pairs simultaneously and best results found for EURUSD, GBPUSD
FREE
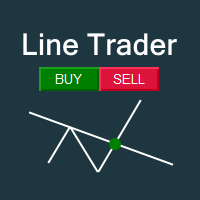
This EA you can automatically act on trend lines of your choice. You only need to draw a line and then press the buy or sell button. Suitable for traders the chart pattern (triangles, channels, spikes ...) act. The tool is also suited for quick and easy to set Pending Orders.
Input parameters Magic - Choose magic number MoneyManagement - Automatically calculated lot size, values are displayed on the lines RiskMode - Choose risk model RiskPercent or RiskMoney RiskPercent - In percent when money

Advanced ideas of the popular MACD indicator: It detects and displays classic and reverse divergences (three methods of detecting divergences). It uses different color to highlight an uptrend and a downtrend. Two methods of determining a trend: а) MACD crosses the 0 level (classic signal); б) MACD crosses its own average (early signal). This is a multi-timeframe indicator: it can display MACD data from other timeframes. Two methods of drawing: classic histogram and line. It generates sound and v
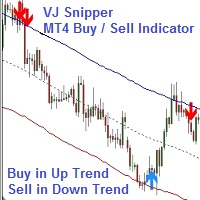
VJ Sniper - MT4 Buy / Sell Indicator: This Indicator is as simple as Buy in Up Trend & Sell in Down Trend. There are 2 Support / Resistance lines for choosing the best Entries. Background: Any in-built indicator of MT4 does not work as stand alone such as Stochastic, CCI or DeMarker etc. But combination of them with trend projection work & give the best results for Trading entries. So this Indicator is blended to give the best results whi

This EA requires a broker having Market Execution (ECN, NDD, STP accounts), low spread, zero StopLevel (or close to such level), no commission if possible (as it influences on the profit amount). Order executin time should be measured in milliseconds, not minutes, requotes and slippage should not happen too often. Deposit: Minimum deposit is $50 (MinLot = 0.01) or $500 (MinLot = 0.1) Recommended currency pairs: EURUSD, GBPUSD, AUDUSD, NZDUSD, USDJPY, USDCHF, USDCAD No Martingale / No grid / No a

Limpid Expert Advisor capable to work in weak and fast market as well as can do news trading. The EA places pending orders using indicators, price speed and different built-in filters. The strategy works without floating loss and good for low deposit accounts and can work with $50. No Martingale No Grid No Arbitrage No any other risky strategy inside If you have any question about the EA or need any help please contact me
Key Features It can work with small deposit Only Pending Orders Every tra

BreakEven Line is a very useful and easy to use indicator. In case of multiple positions opened on the same instrument, the indicator shows the breakeven point where it is possible to close the positions. Its graphic simplicity makes it an unobtrusive and customizable tool. You can enable/disable a line on a chart, so you can make the indicator invisible. Inputs Show cumulative BE (line on/off) Breakeven line color (to change the line color) Breakeven line style Breakeven line width Show short B

前言 “只有当股价的运动得到了两个平均指数运动的确认时,才有考虑它的价值”。 —————查尔斯·亨利·道 背景 道氏理论与道琼斯工业平均指数的主要创始人查尔斯·亨利·道所说,指数在市场决策中具有非常重要地位”任何脱离指数的行动最终可能都是错误的“。然而,通常在外汇市场中现成的指数很少,只有在股票市场中才有很多现成的指数 。 幸运的是,现在有了这个指标你也可以象亨利 · 道那样去编制指数,而且你完全可以轻而易举的完成任何你需要的指数。它甚至完全可以是你的专属,比如:纽元指数、加元指数、澳元指数、直盘指数、交叉盘指数、非美元的指数、欧元指数、日元指数、英镑指数、黄金指数……,总之有了这个指标任何你需要的指数操作都将变得简单。 当然,是否购买的权利始终是只掌握在你的手中的。 亨利· 道先生曾给过我们这样的忠告:“他们应该是许多投资者用来做商业决定的一种工具。” 在此,真心的祝愿这个指标能在你的决策中能发挥好的作用让你从此走在更赚钱的道路上! 基本功能使用方法及特点 的确, 这是一个基于道氏理论的指标。它可在 MT4上 帮你制作几乎任何类型指数的指标。 更重要的是,如今我们 除了计
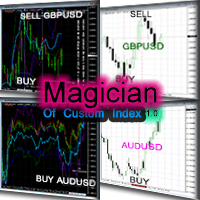
Magician Of Custom Index separate window 前言 “只有当股价的运动得到了两个平均指数运动的确认时,才有考虑它的价值”。 —————查尔斯·亨利·道 背景 道氏理论与道琼斯工业平均指数的主要创始人查尔斯·亨利·道所说,指数在市场决策中具有非常重要地位”任何脱离指数的行动最终可能都是错误的“。然而,通常在外汇市场中现成的指数很少,只有在股票市场中才有很多现成的指数 。 幸运的是,现在有了这个指标你也可以象亨利 · 道那样去编制指数,而且你完全可以轻而易举的完成任何你需要的指数。它甚至完全可以是你的专属,比如:纽元指数、加元指数、澳元指数、直盘指数、交叉盘指数、非美元的指数、欧元指数、日元指数、英镑指数、黄金指数……,总之有了这个指标任何你需要的指数操作都将变得简单。 当然,是否购买的权利始终是只掌握在你的手中的。 亨利· 道先生曾给过我们这样的忠告:“他们应该是许多投资者用来做商业决定的一种工具。” 在此,真心的祝愿这个指标能在你的决策中能发挥好的作用让你从此走在更赚钱的道路上! 基本功能使用方法及特点 的确, 这是一个基于道氏理论的指标

This utility tool help you to close all orders or apart of all (you can choose which symbol you want) immediately with only ONE CLICK, its work very fast ,so it will helpful for you in your trading to manage trading faster. If you want to close all orders, you just need to let symbol parameter is blank (like in default setting). If you want to close all orders of one pair (for example EURUSD orders) you need to put symbol =EURUSD (see screenshot below). This is a script, so its will be putted in

This utility tool help you to close all orders having profit immediatly with only ONE CLICK, its work is very fast. You can choose which symbol you want or close all symbols so it will helpful for you in your trading to manage trading faster. If you want it work on all symbols, you just need to leave symbol parameter blank (like in default setting). If you want it work on 1 symbol only (for example EURUSD orders) you need to put symbol =EURUSD (see screenshot below). This is a script, so its wil

This utility tool help you to close all orders which is having loss immediatly with only ONE CLICK, its work is very fast. You can choose which symbol you want or close all symbols so it will helpful for you in your trading to manage trading faster. If you want it work on all symbols, you just need to leave symbol parameter blank (like in default setting). If you want it work on 1 symbol only (for example EURUSD orders) you need to put symbol =EURUSD (see screenshot below). This is a script, so

The indicator searches Price Action patterns and puts corresponding labels on a chart. It can display only certain selected patterns.
Determined Patterns: Inside Bar. Determinative bullish bar Inside Bar. Determinative bearish bar BUOVB (engulfing). Bullish setup BEOVB (engulfing). Bearish setup DBLHC. Bullish setup (bars with similar Lows and higher closure) DBHLC. Bearish setup (bars with similar Highs and lower closure) Pin Bar. Bullish setup Pin Bar. Bullish setup Pin Bar. Bearish setup Pin

Trend Hunter 是一款用于交易外汇、差价合约、加密货币和金属的趋势指标。它能够识别长期趋势,并根据趋势寻找入场点。 指标信号一旦生成,便会保持激活状态,不会重绘。 每个指标信号都会计算止盈和止损位。交易可以在多个止盈位分阶段平仓,每个止盈位都是止损位的倍数: TP1 、 TP2 、 TP3 、 TP5 和 TP7 。 为了方便使用,指标菜单位于图表底部。提供三种信号显示模式:默认模式、线图模式和经典模式。 在默认模式和线图模式下,将鼠标悬停在信号上即可显示止盈和止损位;而在经典模式下,则会显示所有止盈和止损位。 在经典模式下,您可以直观地查看止盈和止损位是否已达到。如果价格已达到止盈位,该止盈位将变为绿色。如果价格触及止损位 (SL),则价格继续向止盈位 (TP) 移动时,止盈位颜色不会改变,仍然保持灰色。这是一种评估指标信号质量的合理方法。 趋势猎手扫描器允许您查看指标在不同交易品种和时间周期上的走势。 指标参数 Send Alert - 发送警报 Send EMail - 发送电子邮件 Send Notification - 发送推送通知 Show Trend Data

Parabolic Converter is and analogue of the Parabolic indicator for МТ4 which can automatically recalculate parameters of Time Frame specified in settings for lower time periods. It has a Notification System which triggers when the price movement direction is changed. For example: if we set Time Frame 1 Hour to H1 and M30, M15, M5 and M1 contained therein, we can see the indicator's readings corresponding to H1 (fig.). At that, if we add one more Parabolic on the same chart (of several charts) wi

Ask any successful forex traders the secret of their success and they will tell you that the first key to a successful forex trading is proper trade management. Trade management is what differentiates the rookie from the pro in Forex. While the rookie trades based on emotions and greed, the pro trades based on certain logic and rules . These logic and rules are all embodied in a successful Trade Management System. Advanced Trade Manager is a combination of different trade management systems desi
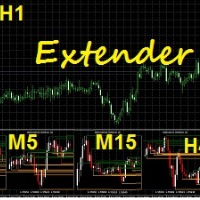
Extender represents a multifunctional indicator which can be used for own investing strategy or can be easily adopted as a part your own investing strategy. After installation as a secondary indicator you can see a multiframe visualization of selected timeframes of analyzed underlying asset. The multiframe visualization has a few modifications which can be selected in section Indicator Setup.
Input parameters Indicator setup Timeframes – definition of selected timeframes for visualization, e.g.

Display all text information you need on your live charts. First, import the library: #import "osd.ex4" void display( string osdText, ENUM_BASE_CORNER osdCorner, int osdFontSize, color osdFontColor, int osdAbs, int osdOrd); // function to display void undisplay( string osdText); // function to undisplay int splitText( string osdText, string &linesText[]); // function called from display() and undisplay() void delObsoleteLines( int nbLines); // function called from display string setLineName( int
Introduction to GARCH Indicator GARCH is the short initial for Generalized Autoregressive Conditional Heteroskedasticity and it is the volatility prediction model commonly used in financial industry. GARCH model was first appeared in the work by Danish Economist, Tim Peter Bollerslev in 1986. The 2003 Nobel Prize winner, Robert F Engle also added much contribution for the refinement of GARCH model with Tim’s work. Our GARCH INM predictor took the original method of Nelder Mead for GARCH model bu
FREE
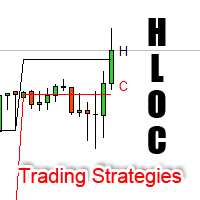
High Low Open Close Levels The indicator HLOC is a good ally to correctly identify the appropriate trend of price. The indicator is designed to be minimally invasive and it shows a visual and sound aid in order to take decision on the market. The indicator is equipped with sound alert and window alert in order to have a reminder of the price movements. We suggest you watch the video below to evaluate its operational benefits.
Input values: Show Level (true/false) TimeFramePeriod (refer to lines

How to use Pair Trading Station Pair Trading Station is recommended for H1 time frame and you can use it for any currency pairs. To generate buy and sell signal, follow few steps below to apply Pair Trading Station to your MetaTrader terminal. When you load Pair Trading Station on your chart, Pair Trading station will assess available historical data in your MetaTrader platforms for each currency pair. On your chart, the amount of historical data available will be displayed for each currency pai

This panel is very simple to use and it is a very ally to manage your positions and orders. Also you can modify your risk, writing in fields directly on Panel.
One click on buttons and the operation on market is done!
Operations possible: BUY/SELL Break Even Split (close 50% all orders) Close All positions Hedging (opens reverse positions to cover) Close only BUY positions Close only SELL positions Close All pending orders Reverse all positions Please watch the video to verify the very simple u

It is widely known that colors affect the emotional state of a human, especially if this human is a trader. Psychologists recommend that you follow your instincts and select the color of your environment that is most comfortable to you. In order to reduce emotional stress, impact of colors on a person should be considered. The optimal range of the most beneficial colors includes green, yellow-green and green-blue ones. This indicator allows you to manage your emotional state and health. Choose a
FREE

EA Features This Expert Advisor is based on standard indicators. You can custom your best parameter for each indicator with your own settings.
Inputs Trade Settings AutoBuy : Auto Buy Trading AutoSell : Auto Sell Trading CloseAll : Close all open orders (this Symbol only) PauseTrade : EA will not open a new order but still holding all opened positions (Example: Before big news coming) ResetTime : Close all opening orders at time selection ResetHour : Close all opening orders at Hour selection R

The e-FastCHF EA is developed for GBPCHF. The EA has no trading limitations only on GBPCHF. 16.01.2015. The Swiss National Bank decided not to support the EUR/CHF course on the level of (1.20). Now it is pegged not to EUR but to USD. Our strategy is based on this fact. Tests have been performed from 02.01.2015. Timeframe – М15 Currency pair – GBPCHF No Martingale Calculation of lot basing on the balance (risk per trade). Supporting ECN accounts. This option operates as follows: first a position
FREE

This multi-currency EA analyzes the last closed candle of a specified timeframe (Weekly is recommended), calculated candle body and, if it exceeds the set parameter, opens an order in the opposite direction from the calculated price. Pairs are specifies in the EA's settings. It has the trailing stop function. You can also set a trading day (for D1, W1) and day of closing open orders. Specify trading type in settings: all pairs or by the largest candle body . Manual tests of the strategy using "b

Informational indicator which shows: Swap Price under/upper Open for every Time Frame Spread Time to close the current candle Broker Time Net Change: delta in percentage from Open (MN-W1-D1) Tick Value Volumes Info for every trades open: Lots Breakeven Profit Buy-Profit Sell Equity Symbol Positive values are green and negative values are red (modifiable in input).
Inputs: View BE line (enable/disable) View all Symbol (shows the list of symbol) Color (for every text) Line Color (for BE line)

The script clears the chart window from labels of order tracing. It removes labels of only closed orders. It clears charts in all windows opened in the terminal.
Parameters: Symbol: clear charts of the specified symbol. If not said, clear charts in all windows. Last Data : orders with a date of closure which goes after the specified one will not be deleted. If not said, tracing of all closed orders will be deleted. Confirmation : True - confirmation of chart clearance for each window, False - n
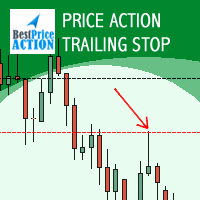
A key element of trend trading is using a trailing stop loss in place of exiting trades with a pre-determined target. This allows for a trade to continue working in the direction of the trend. In good trends this is a very efficient way of profiting from the markets. The Expert Advisor is meant for securing/locking profit as the price moves in favor of a trade. The Expert Advisor can be placed on any chart and be used simultaneously with any other Expert Advisor. You can initialize your stop los

MCAD stands for M ulti C urrency A ccumulation/ D istribution, so please don't confuse it with the well-known MACD. MCAD calculates relative strengths of Accumulation/Distribution of volumes for plain Forex currencies (that is their synthetic behaviour extracted from Forex pairs), market indices, CFDs and other groups of tickers. It uses standard Accumulation/Distribution formula ( Wikipedia's article ) and can apply it either to tick volumes, or to pseudo-real volumes ( volume surrogates , intr

This indicator is an interpretation of the Average Directional Movement Index (ADX), which helps to determine the presence of a price trend. It was developed and described in detail in the book "New Concepts in Technical Trading Systems" by Welles Wilder. The indicator determines entry points into the market, using the intersection of the +/- lines of the ADX indicator as a signal, as well as the rise or fall of the main line of the ADX indicator. Crossing the zero line by the indicator indicate
FREE

Alarm Clock generates sound signal at the prescribed time. Time is set by a vertical line on the chart. Just shift this line on the chart to the future. After you set the line at the desired time, you can do whatever you want with the chart, like change a timeframe and a symbol - the alarm clock will generate a signal at the prescribed time anyway. If you accidentally remove the line, the indicator will restore it at the prescribed time. You can attach the indicator to different charts and set d
FREE

EquityProtect provides hidden StopLoss, TakeProfit or TrailingStop based on the account equity. All orders of all symbols can be closed or just the chosen currency and/or just buys or sells or pending orders deleted. EquityProtect closes all or just defined orders when the account equity falls under or rises over a certain level. Besides EquityProtect can use the account equity as trailing stop. A comment in the chart shows the equity where the robot will react. mt5 version >> EquityProtect is v
This indicator provides you with MACD formula applied to volume-aware Accumulation/Distribution and OnBalance Volumes indicators. In addition to tick volumes it supports special pseudo-real volumes, synthesized for Forex symbols where real volumes are unknown. More details on the volume surrogates may be found in description of another indicators - TrueVolumeSurrogate and OnBalanceVolumeSurrogate (algorithm of the latter is used internally in MACDAD for AD and OBV calculation before they proceed
Control Trading Intraday Zones shows the best candles-zones to trade intraday. Shows maximum of the day and minimum of the day zones, adaptable to each symbol, gives you a guide to know the best zones to make the best intraday trades. Indicator goes from -100 (lowest of the day) to 100 (highest of the day), when 0 is middle price of the day. For example, when price reaches high of the day the indicador will continue showing max levels even the price continue rising, because indicator limits to 1

Inform Panel For ALL Symbols — Advanced Multi-Instrument Trading Management The Inform Panel For ALL Symbols is a sophisticated trading management tool designed to streamline control over all financial instruments in a trader’s portfolio, eliminating the need to attach it to specific charts. Its core innovation lies in using modifiable virtual levels for stop loss (SL) and take profit (TP), allowing discreet order closure hidden from brokers. The panel automatically detects and lists all active

This is a prototype of the famous Control and management of transactions panel. There are two main differences: Allows to work with all the variety of financial instruments opened by a user and not only with instruments it was attached to; To activate levels of order closure hidden from a broker, it uses not lines but modifiable virtual levels. To enjoy the full functionality of the panel you are advised to have: Desk analytical table . Their combined operation allows to keep the situation under
Setting Take profit (TP) to fixed level does not optimize your trade while using trailing stop requires traders to stay all time to screen. Vanesa Trailing Stop does trail stop by preset scenarios automatically. Vanesa Trailing Stop provides 3 (maximum) TP levels in points. For example: Level 1< Level 2 < Level 3. Traders provide value of trailing stop level for each TP level as parameters. Whenever total gain of a trade in points reaches the first TP level, EA will start doing trailing stop wit
FREE
Percent Crosshair is a powerful and easy percentage measure tool. Measure the chart percentage quickly! Don't waste your time anymore! Just attach the Percent Crosshair indicator to the chart, select crosshair mode at toolbars or press Ctrl+F and start using the crosshair as you always do! The percent measure will be next to the indicative price. Customize your indicator the way you want! There are four entry parameters: Positive % color: set the desired color when % is positive. Negative % colo
学习如何在MetaTrader AppStore上购买EA交易,MetaTrader平台的应用程序商店。
MQL5.community支付系统支持通过PayPay、银行卡和热门付款系统进行交易。为更好的客户体验我们强烈建议您在购买前测试EA交易。
